The Anatomy of a TSLA Retracement TradeBased on a detailed analysis of Tesla's recent price action, a compelling bearish thesis suggests that the stock is poised for a significant retracement. The current market structure indicates that the recent rally may be unsustainable, necessitating a retest of a critical support level to re-establish a more stable foundation.
The Bearish Hypothesis: Retracement to Trendline Support
The core thesis is that the price is set to retrace and test the integrity of the ascending diagonal support trendline. This is not an indication of a full trend reversal, but rather a high-probability correction. T
This corrective phase will likely see the price descend to the lower boundary of the channel. A retest of this key support trendline is a common and healthy technical pattern.
Trade: A short position could be considered upon a clear rejection at the recent highs or upon a decisive breakdown of a minor support level, with the primary profit target being the ascending diagonal support trendline.
TL0 trade ideas

TSLA SELL AT $426! Retracement to $372 imminent TSLA was a perfect ascending bullish triangle, yes, I drew the Elliott Wave wrong but got the calls right at $300 ($339 first target) and bounce off support at $324.80 ish (separate post). Remember the $7500 EV credit expires soon so there will likely be a pull forward of purchases this quarter which could temporarily juice the stock. We could see all time highs but first we must retrace once target of $426 is reached.
Tesla Financials: Q1 2025The market is currently staging a short-term rally - essentially a speculative mean reversion bounce as a reaction to -55% crash from all-time high. This move appears driven largely by retail traders seizing what it perceives as a rare opportunity to accumulate an oversold "large-caps".
While retail participation and opportunistic capital are supporting the current bounce, this alone is insufficient to sustain a full recovery. As the price approaches higher levels, particularly near key supply zones, it will likely encounter significant resistance, resulting in reversal.
Let's not forget the fact that figures in Tesla’s Q4 '24 financial report initiated bearish sentiment among institutional investors which resulted in market crash. Similarly, the upcoming Q1 earnings report presents a clear downside risk, as the significant events throughout this quarter will inevitably be reflected in the financial figures!
Anticipated impact of significant developments on Tesla’s Q1 2025 Financial Statements
🛑 Revenue Decline
• U.S. Market Weakness: Lower-than-anticipated vehicle sales in the U.S. directly reduce automotive revenue.
• Severe European Slump: A significant 76% sales decline in Germany and weakness elsewhere in Europe will notably reduce international revenues.
• Chinese Market Challenges: A substantial 49% sales drop in China will negatively affect one of Tesla’s crucial growth markets.
• Cybertruck Weakness and Recalls: Reduced demand and multiple recalls of Cybertruck models further erode revenue growth.
• Resale Value Decline and Trade-Ins: Increased vehicle trade-ins indicate lower demand, causing inventory buildup, discounting pressures, and further sales reductions.
🛑 Gross Margin Erosion
• Price Reductions and Sales Incentives: Competitive pressures and lower demand likely forced Tesla to reduce vehicle prices and offer incentives, compressing gross margins.
• Increased Competition from BYD: BYD’s advanced battery technology (providing 400 km of range in just 5 minutes of charging) pressures Tesla to increase R&D spending or cut prices further, negatively affecting margins.
• Production Challenges (Supply Chain and Battery Issues): Ongoing global supply chain disruptions and difficulties scaling battery production significantly increase manufacturing costs, further squeezing gross margins.
🛑 Increased Operating Expenses
• Recall Costs and Legal Expenses: Vehicle recalls, along with lawsuits related to product issues such as phantom braking, will significantly increase warranty provisions, legal fees, and related operating expenses.
• Protests and Vandalism Costs: Public backlash and vandalism necessitate additional expenditures on security, facility repairs, and public relations initiatives.
• Employee Turnover Costs: Departures of key personnel result in increased recruiting, training, onboarding, and severance expenses.
🛑 Net Income and EPS Impact
• Analyst Earnings Downgrades: Already-reduced EPS projections by major analysts suggest Tesla will likely report earnings below expectations, reflecting revenue shortfalls and elevated expenses.
• $1.4 Billion Financial Discrepancy: If confirmed or unresolved, this discrepancy could lead to substantial asset impairments, restatements, or write-downs, negatively impacting net income and earnings per share (EPS).
🛑 Cash Flow and Liquidity Pressures
• Lower Operating Cash Flows: Reduced revenue coupled with rising operating costs (including recalls, lawsuits, security, and PR spending) severely diminish cash generated from business operations.
• Increased Capital Expenditures: Additional CapEx is likely required to address battery production bottlenecks and delays in autonomous driving technology development, resulting in elevated investing cash outflows.
• Investor Divestment and Stock Volatility: Negative investor sentiment could lead to costly equity financing conditions if Tesla needs to raise capital, adversely affecting financing cash flows and liquidity.
🛑 Balance Sheet Risks
• Rising Inventory Levels: Weak sales combined with continued vehicle production may lead to increased inventory levels, reducing cash and potentially requiring markdowns or provisions.
• Debt and Liquidity Challenges: Deteriorating credit metrics or covenant breaches could make refinancing existing debt more expensive or complicated, negatively impacting Tesla’s financial stability.

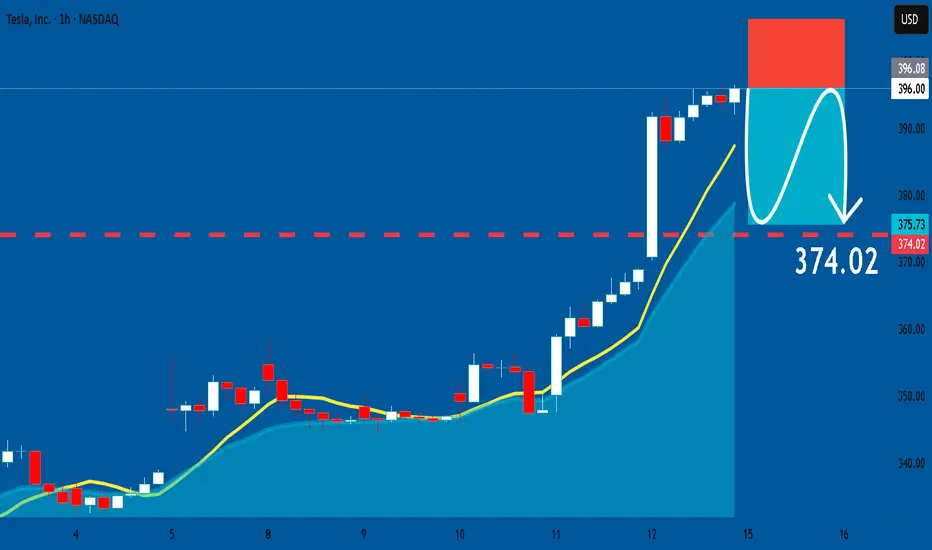
TESLA : Short Signal Explained
TESLA
- Classic bearish setup
- Our team expects bearish continuation
SUGGESTED TRADE:
Swing Trade
Short TESLA
Entry Point - 396.08
Stop Loss - 406.37
Take Profit - 374.02
Our Risk - 1%
Start protection of your profits from lower levels
Disclosure: I am part of Trade Nation's Influencer program and receive a monthly fee for using their TradingView charts in my analysis.
❤️ Please, support our work with like & comment! ❤️
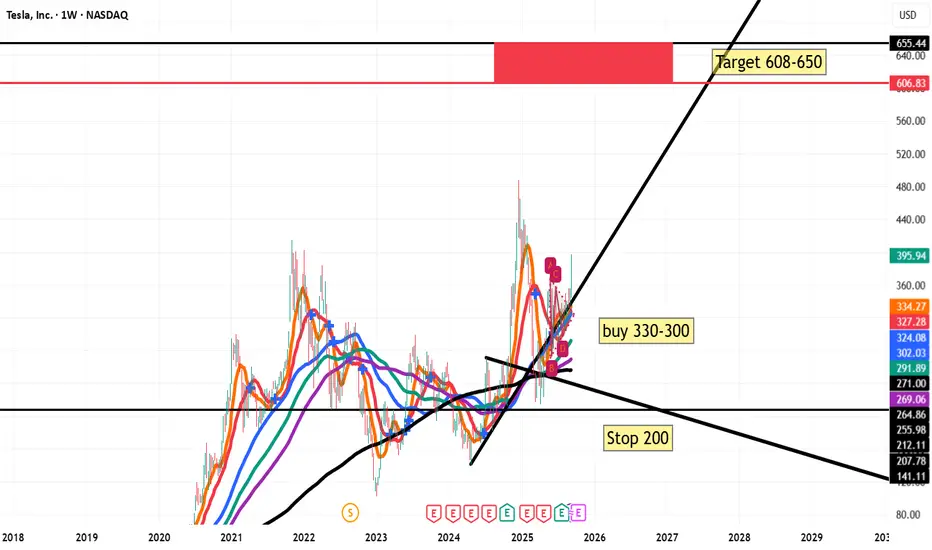
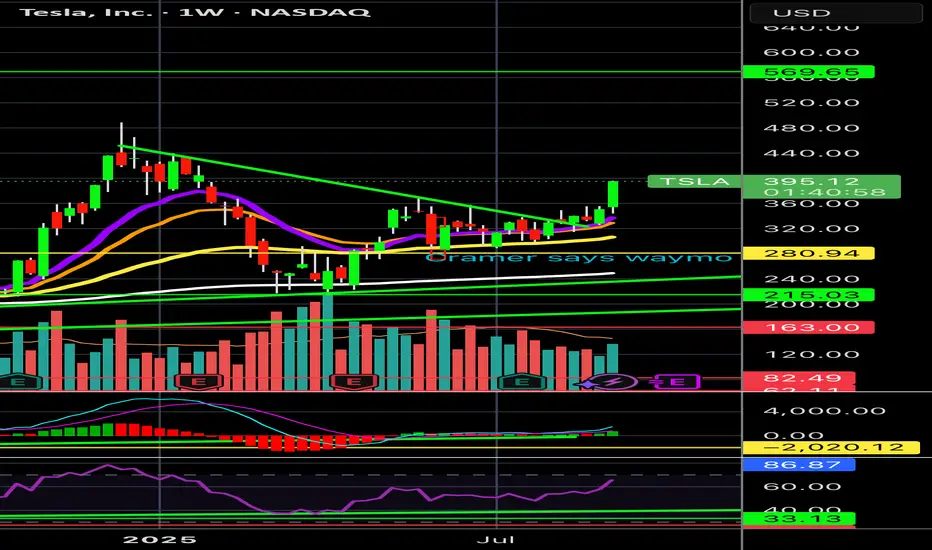
TSLATechnical Analysis (Weekly Chart – TSLA, NASDAQ):
Current Price: $395.94 (+12.85% in the latest session), showing strong bullish momentum.
Support Zone (Buy Area): The chart highlights an attractive buying range between $300–330, where multiple moving averages converge, acting as dynamic support.
Stop-Loss: Placed at $200, which sits well below the long-term trendline and previous key support. This ensures risk control in case of a major reversal.
Target Zone: The bullish projection is toward the $608–650 area, aligning with previous resistance levels and a strong supply zone from 2021–2022.
Trend & Structure:
The stock recently broke out of a consolidation pattern (A–B–C–D) with strength, supported by high volume and upward momentum.
Long-term moving averages (200-week shown in black) are flattening and turning up, signaling a potential multi-year bullish reversal.
If price sustains above $330, the bullish scenario remains valid with the probability of continuation toward $600+.
Outlook:
Short-term: Possible minor retracement to $330–350 before resuming the uptrend.
Medium- to Long-term: Bullish trend continuation toward $608–650.
Risk: A breakdown below $300 would weaken the bullish case, and a fall under $200 would invalidate it completely.
📌 Summary:
Tesla shows a strong bullish setup on the weekly chart. Entry zone is $300–330 with stop-loss at $200. The first major target is $608–650, offering an excellent risk–reward ratio for long-term investors.
TSLA UPDATE 13 SEP 2025I dont care what price does next. I have exited from Tesla at $390. I want it to go moon and I will buy it back again whenever I want but wont hold here or make new entries here. There is a big monthly supply zone here so I wont be touching Tesla now & wait for further price action

#TSLA "third big leg up"This is what I see as a logical continuation just by looking at the chart. I also think that Elon can make it happen. I don't like to read long explanations so I won't write one. Don't want to add to the noise. A picture is worth a thousand words.
Limiting beliefs anybody?

TSLA has got the momentum ^.^Brother Elon is back on business. 1 trillion bonus Yummy!
Technicals are favor Tesla Stock,
Large Greenbar has broken out of resistance.
More investors are joining the rally, This may break previous highs.
Come and make some money.
Risk ? Don't worry about it because its 1 Trillion.

TESLA stock to gain more heights again!Tesla has finally broke out of that ardous consolidation it was in! investors can look for the buying opportunities for a probable pullback on a shown order block!
Tesla Near Term SpeculationBuilding on the flag formation from the past 3 years, its possible an rising wedge could form. Very early days and highly speculative, but if price plays out somewhat like my chart, an ascending wedge could form. Indicating that Tesla may have hit a near/mid term high and can't won't break through for a few years, with several implied price crashes going into 2026 and 2027.
Economic conditions and the apparent slow down in sales, would also support the technical analysis with macro fundamentals.
Very curious to see how things play out, again, highly speculative, just wanted to post to remind myself to keep and eye on this. The potential volatility is presenting interesting trades ahead.

Breakout time $TSLA$570 inbound
The start of the Energy abundance and Robotaxi era is upon us. Autonomous robots will transport everything within the next 10 years.
Optimus wave will follow shortly behind over the next 5 years.
TAM Potential: 10X autonomous transport.
How high this eventually goes is almost laughable, time to sit back and watch compound growth and all its magical glory.
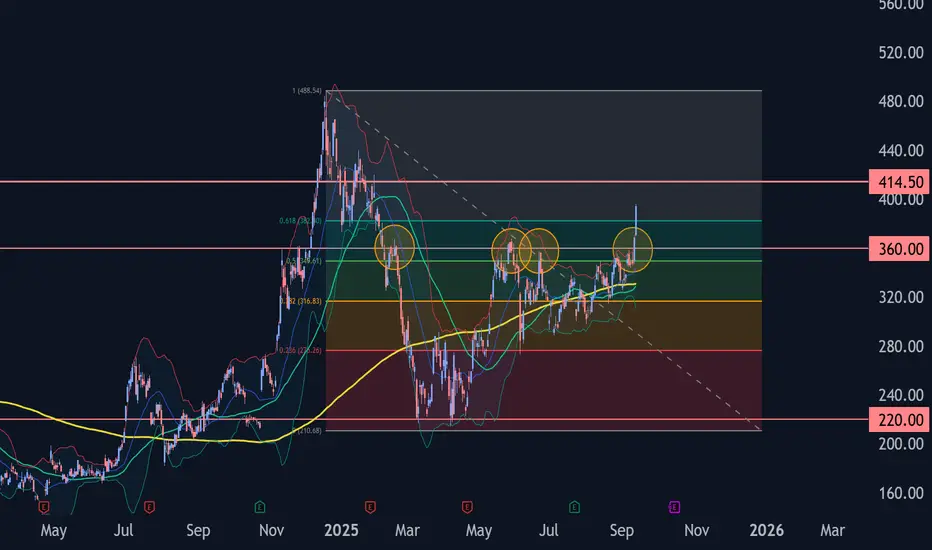
Tesla Wave Analysis – 12 September 2025- Tesla broke resistance area
- Likely to rise to resistance level 414.50
Tesla recently broke the resistance area located at the intersection of the resistance level 360.00 (which has been reversing the price from February), resistance trendline of the daily up channel from July and the 50% Fibonacci correction of the downward impulse from December.
The breakout of this resistance area accelerated the active impulse wave 3 of the intermediate impulse wave (3) from June.
Tesla can be expected to rise to the next resistance level 414.50 (target price for the completion of the active impulse wave 3).
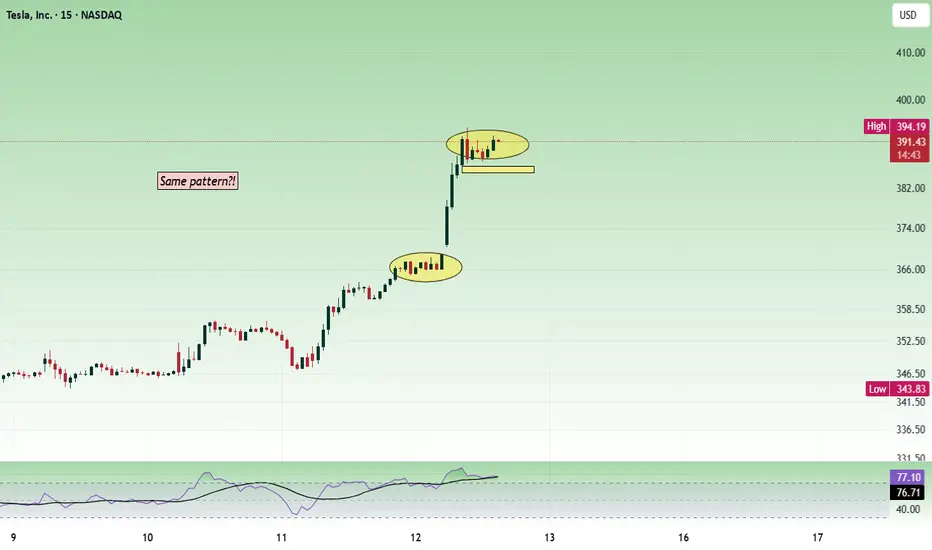
You will ask yourself, "how did he know Tesla would do that"?I wrote this on my July 29th chart description (below):
"Price action really has less to do with the news making Elon a hero, then a villain and then back and forth...but moreso to do with price action patterns that just keep repeating". Since then, the pattern has played out exactly as anticipated, and my 1st take profit target just hit (+22%).
July 29th chart:
Now the question remains, will Telsa hit my next target range (T2). Although it is a much larger range than my T1, I will monitor price action closely and use TA to get out near the top before the next major retracement.
Let me know if you're into Tesla and if you are interested in me charting the top of this run.
May the trends be with you.

Tesla - consolidation patternUsually, whenever the price gives a breakout, we will think the price will reverse or have a pullback. Sometimes the same trend will continue after a small consolidation. I am seeing similar type of consolidation here.
Buy above 390 with the stop loss of 387 for the targets 383, 396, and 399. We can expect resistance or some profit booking around 400.
Always do your analysis before taking any trade.
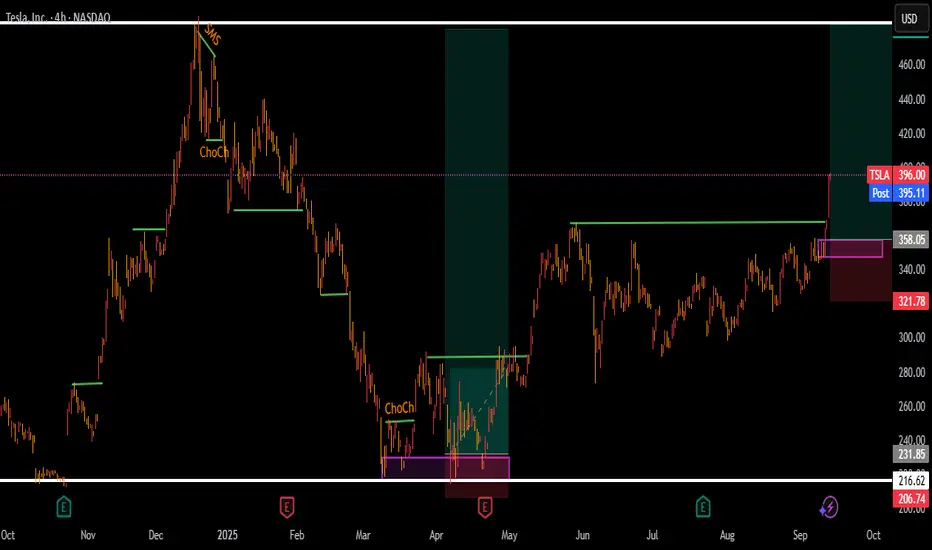
Tesla Breakout? For the majority of the calendar year TESLA has been in a range between $220 - $365 with a clear midpoint of $295.
From March to the beginning of May TESLA bounced between range low and the midpoint until finally breaking through into the upper half of the range where it has stayed ever since. However, there is a clear diagonal resistance level that is preventing higher highs.
So will TESLA breakout, or will it lose the midpoint? Structurally it is clear that the bulls have a set level they are happy to buy at (Midpoint) but the bears are getting more aggressive with their selling, hence the lower highs. This compression inevitably leads to an impulse move but the direction is not so clear.
Bullish scenario: A clean breakout with volume that makes a new higher high, signaling a shift in structure. A pullback and retest of the breakout would be an ideal opportunity to go long and aim for that range high before expecting resistance.
Bearish scenario: The lower highs keep printing until the midpoint is lost and price accepts below it, that would then signify to me the new trading range is between Range Low and Midpoint.
The fakeout scenario is a risk but with price so close to the midpoint already it follows the same invalidation criteria as the bullish scenario, the midpoint is vital to both sides.

#TESLA - $40 Swing?Date: 14-08-2025
#Tesla - Current Price: 339
#Tesla Pivot Point: 339 Support: 331 Resistance: 347
#Tesla Upside Targets:
| 🎯 Target 1 | 356 |
| 🎯 Target 2 | 365 |
| 🎯 Target 3 | 374 |
| 🎯 Target 4 | 384 |
#Tesla Downside Targets:
| 🎯 Target 1 | 323 |
| 🎯 Target 2 | 314 |
| 🎯 Target 3 | 304 |
| 🎯 Target 4 | 295 |
#TradingView #Nifty #BankNifty #DJI #NDQ #SENSEX #DAX #USOIL #GOLD #SILVER

TESLA BULLISH BREAKOUT|LONG|
✅TESLA is going up
Now and the stocks is trying to
Made a bullish breakout
Of the key horizontal
Level of 367.50$ and IF breakout
Is confirmed we will be expecting
A further bullish move up
LONG🚀
✅Like and subscribe to never miss a new idea!✅

Could we see another Bullish leg on #TSLAmore consolidation here will confirm this wave scenario with targets of
324
384
The invalidation of this scenario is the break of 240.7 (-5%)
Trade safe

Follow-through buying on TSLA?Following a one-sided 6.0% gain in Tesla’s share price on Thursday, this helped lift the S&P 500 and Nasdaq to fresh records. As shown in the chart below, the TSLA Stock rallied through a 6M resistance level of US$360.03 to a high of US$368.99, levels which have not been seen since earlier this year.
Further buying could now be seen for the Stock towards the resistance between US$389.72 and US$383.09. However, before reaching said area, a pullback may occur, retesting US$360.03 as support, with a dip into 1M support from US$343.88 possible.
Written by the FP Markets Research Team

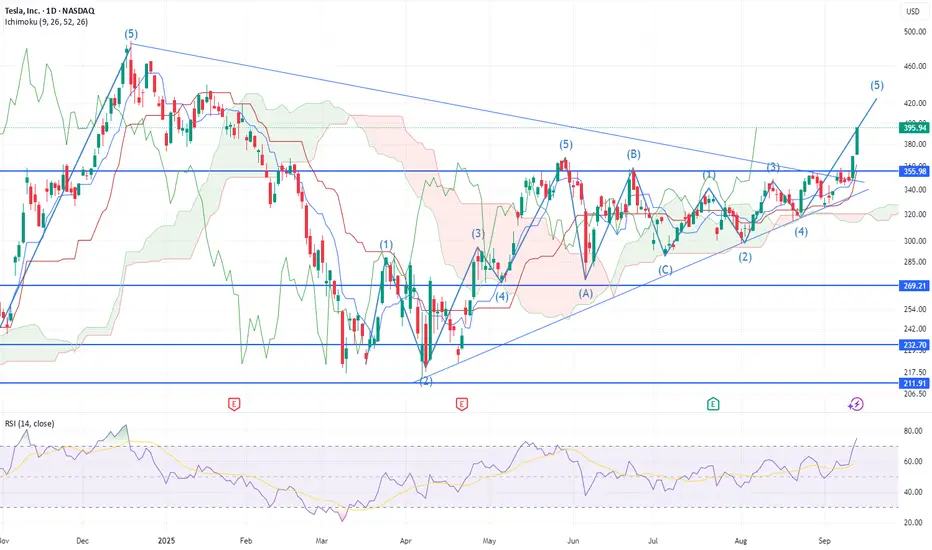
Possible retrace before upside moveThe initial upward move from 214 is corrective in nature. Since the current correction to 273 doesn't seem to be proper ABC correction, I am expecting further C wave correction to the Green box. Breaking the Red Box and the trendline with a retest will invalidate further downward correction. Based on the Major Indexes structure, I am not expecting Tesla to retrace below 213 as depicted by red line .
Note
**Disclaimer** : All details shared here is for educational purpose only. Please do your own research and consider appropriate risk management before making short term or long-term investment decisions.
Approach Market always with probabilities and make sure risk management in place.
Request your support by like, comment and follow

WXY structure with a double topTesla has been in a uptrend with a corrective structure WXY. I am not sure if the WXY is a part of wave 5 terminal structure or a B wave. However expecting a double top or 78.6 retrace to 425-430 range as a minimum. For this scenario, an impulsive upside move is expected within the next few weeks. However the price needs to move back into the channel next week as a first step.

$TSLA - channel breakout on the daily. possible $400 soonTSLA - Stock finally seeing channel breakout after long consolidation. calls above $370 looking good for a move towards $378 and $400. Stock is decent at indicator. needs to hold $365 to hold the breakout move.

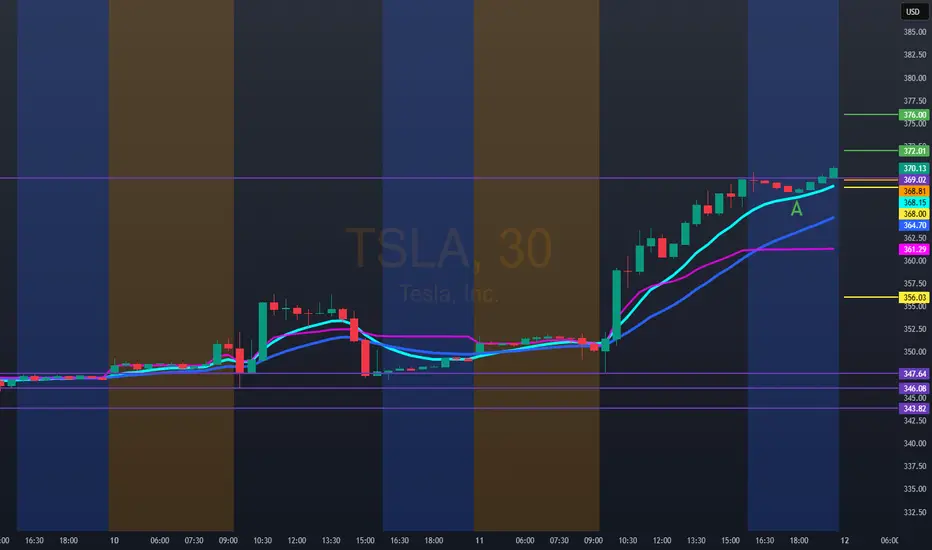
Hello trader, nice to meet you. For tomorrow, TSLA: 368.81we have a bullish entry at 372.00/376.00. Next, a possible target is 385.00/390.00. For better control of your stop, you can use the VWAP.
Bearish technical entry at 368.00. If you lose, this area could reach the 356.00 zone with a possible rebound. It's important to keep in mind that September is often a negative month for TSLA.