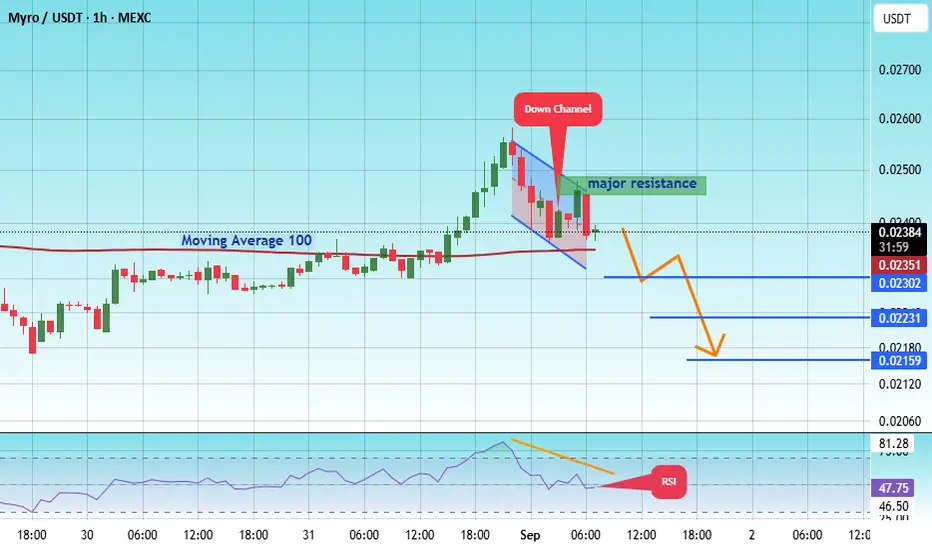
#MYRO/USDT myro road map ( 1 H )#MYRO
The price is moving within a descending channel on the 1-hour frame, adhering well to it, and is heading for a strong breakout and retest.
We have a bearish trend on the RSI indicator that is about to be broken and retested, which supports the decline.
There is a major resistance area (mark
Myro UpdateIn this case im only looking for that anchored vwap which usually acts as a strong magnet. Lets see how its gonna play out. might than also a good short at the vwap

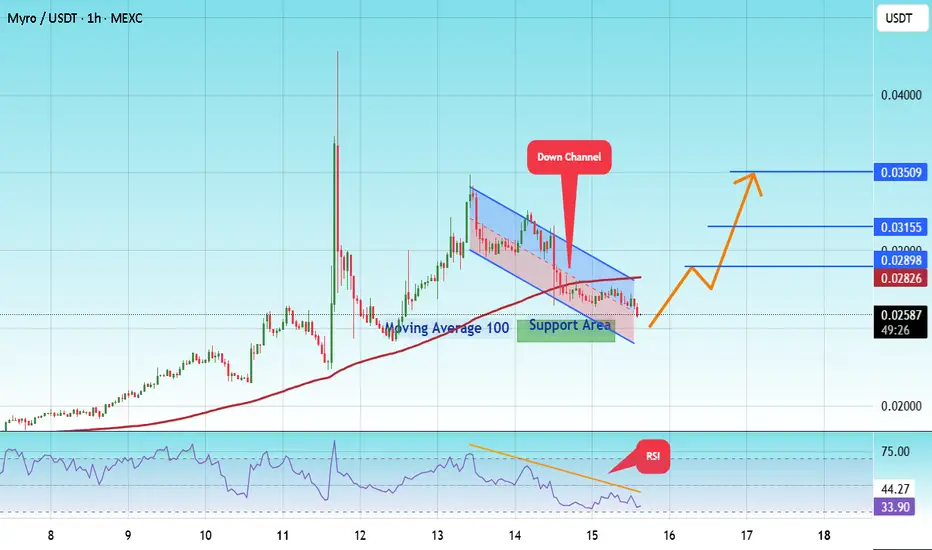
#MYRO/USDT Testing Key Support – Breakout or Breakdown ?#MYRO
The price is moving within a descending channel on the 1-hour frame and is expected to break and continue upward.
We have a trend to stabilize above the 100 moving average once again.
We have a downtrend on the RSI indicator that supports the upward break.
We have a support area at the low
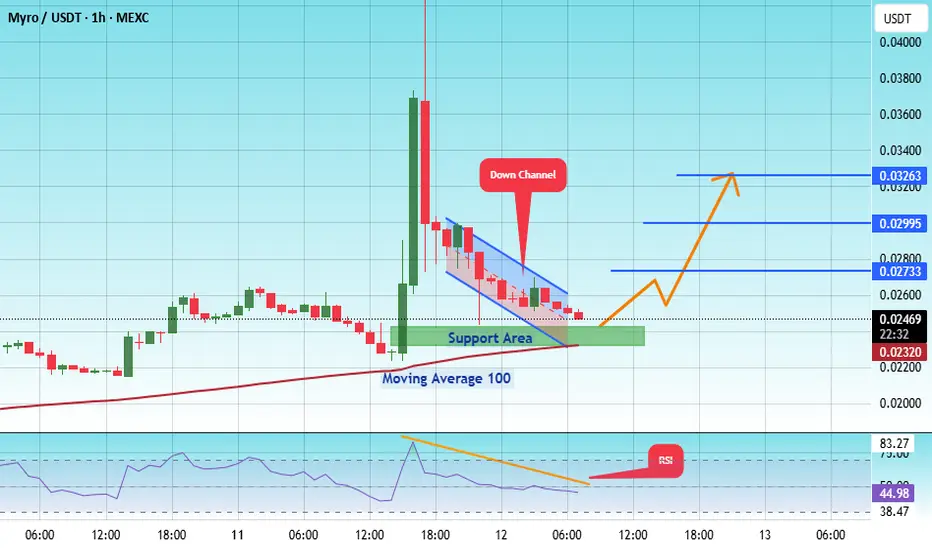
#MYRO/USDT Testing Key Support – Breakout or Breakdown ?#MYRO
The price is moving within an ascending channel on the 1-hour frame, adhering well to it, and is poised to break it strongly upwards and retest it.
We have support from the lower boundary of the ascending channel, at 0.02316.
We have a downtrend on the RSI indicator that is about to break a
#MYRO/USDT #MYRO
The price is moving within an ascending channel on the 1-hour frame, adhering well to it, and is on its way to break it strongly upwards and retest it.
We have support from the lower boundary of the ascending channel, at 0.02164.
We have a downtrend on the RSI indicator that is about to bre

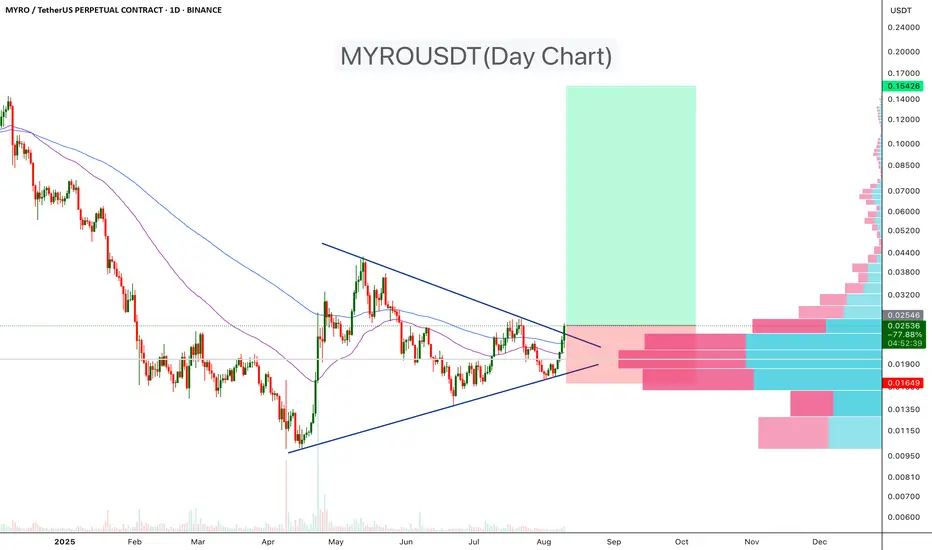
MYROUSDT Bullish Breakout Above Triangle Resistance!MYROUSDT has been trading within a symmetrical triangle pattern for the past few months. Today, the price has broken above the upper trendline, signaling a potential bullish breakout. The breakout is supported by increased volume and a clear move above both the 50-day and 100-day EMAs, suggesting st
#MYRO/USDT myro road map ( 1 H )#MYRO
The price is moving within an ascending channel on the 1-hour frame, adhering well to it, and is poised to break it strongly upwards and retest it.
We have support from the lower boundary of the ascending channel, at 0.02040.
We have a downtrend on the RSI indicator that is about to break an

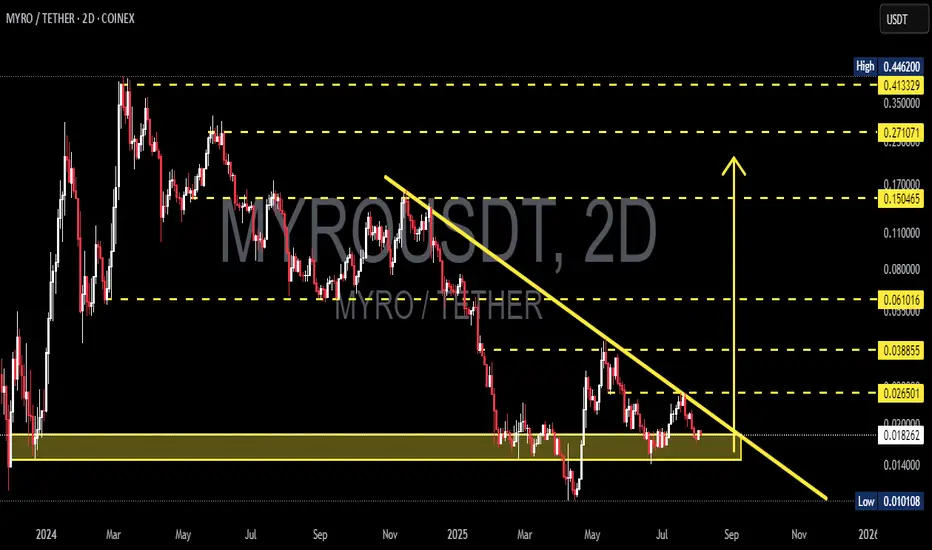
MYRO/USDT Testing Key Support – Breakout or Breakdown?📊 Complete and Relevant Chart Analysis:
The MYRO/USDT pair is currently in a consolidation phase after experiencing a medium-term downtrend. Several key technical elements can be observed in this chart:
---
🟡 Support Zone (Demand Area):
Price is now sitting at a strong support zone (yellow box),
#MYRO/USDT myro road map (HI)#MYRO
The price is moving within a descending channel on the 1-hour frame, adhering well to it, and is on its way to breaking it strongly upwards and retesting it.
We have a bounce from the lower boundary of the descending channel. This support is at 0.02400.
We have a downtrend on the RSI indica

#MYRO/USDT myro road map (HI)#MYRO
The price is moving within a descending channel on the 1-hour frame, adhering well to it, and is on its way to breaking it strongly upwards and retesting it.
We have a bounce from the lower boundary of the descending channel. This support is at 0.02431.
We have a downtrend on the RSI indica

See all ideas
Summarizing what the indicators are suggesting.
Oscillators
Neutral
SellBuy
Strong sellStrong buy
Strong sellSellNeutralBuyStrong buy
Oscillators
Neutral
SellBuy
Strong sellStrong buy
Strong sellSellNeutralBuyStrong buy
Summary
Neutral
SellBuy
Strong sellStrong buy
Strong sellSellNeutralBuyStrong buy
Summary
Neutral
SellBuy
Strong sellStrong buy
Strong sellSellNeutralBuyStrong buy
Summary
Neutral
SellBuy
Strong sellStrong buy
Strong sellSellNeutralBuyStrong buy
Moving Averages
Neutral
SellBuy
Strong sellStrong buy
Strong sellSellNeutralBuyStrong buy
Moving Averages
Neutral
SellBuy
Strong sellStrong buy
Strong sellSellNeutralBuyStrong buy
Displays a symbol's price movements over previous years to identify recurring trends.