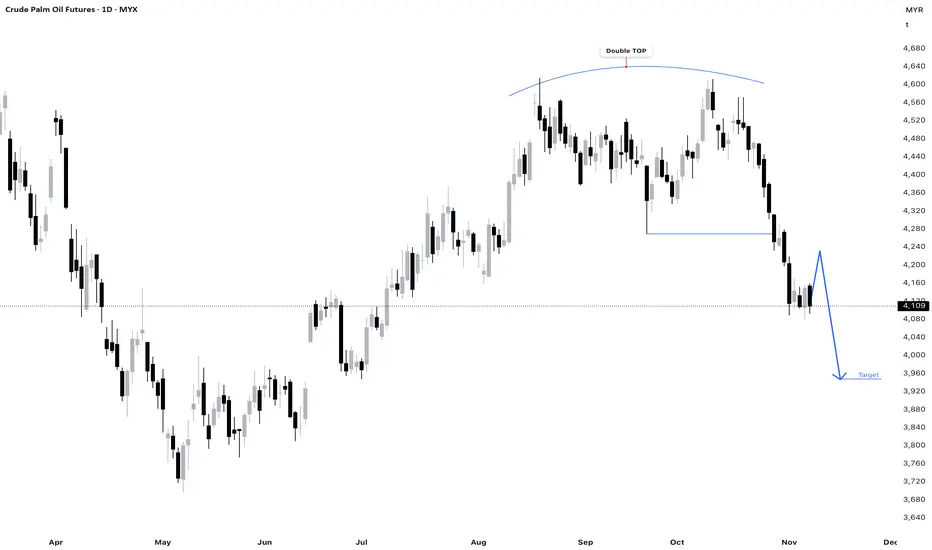
FCPO Week 46 2025: SHORT.MYX:FCPO1! is bearish. However the bearish momentum might be weaken and needs to reenergised. Expecting that price to make a retracement higher before going lower again. This will create a lower high before continuing lower towards below 4000.
Related commodities
12/11/25 Still Sideways Small Trading Range So Far
Yesterday’s candlestick (Tuesday, Nov 11) was a bull bar closing in its lower half with a long tail above.
In our previous report, we said traders would watch whether the bulls could produce more decent bull bars in the days ahead, or if the bears would extend their follow-through selling inste
14/11/25 Still Sideways Tight Trading Range
Yesterday’s candlestick (Thursday, Nov 13) was a bull doji closing around the middle of its range.
In our previous report, we said traders would watch whether the bears would attempt to create another leg down, or if the market would continue to consolidate sideways.
The market retested the No

4/11/25 Can The Bulls Create a Minor PB to 20-Day EMA?
Yesterday’s candlestick (Monday, Nov 3) was a follow-through bear bar closing near its low with a small tail below.
In our previous report, we noted that traders would watch whether the bulls could produce a minor pullback and a few decent bull bars in the days ahead, or if the bears would exte

FCPO Trading Plan - 4th Nov - Morning sessionMain Trend: Bearish
Short Term Trend : Bearish
Trading Plan: For Morning Session
• Short –
o If price unable to break above 4141. TP1=4103 TP2=4063
SL=4153
o If price gap up but fail to break above 4193. TP1=4167 TP2=4141 SL=4195
• Long –
o If price break above 4141. TP1=4167 TP2=4193 SL=4135
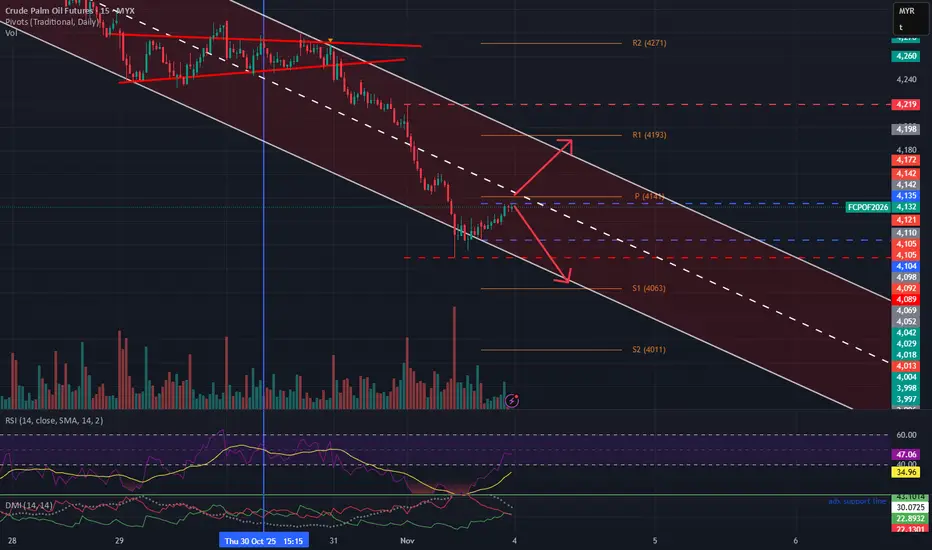
FCPO Week 45 2025: Retrace or consolidation to continue bearish.Bearish overall. However there is a sign of bearish exhaustion.Price making swing lows but the momentum has declined thus signalling that price might retrace before resuming lower. However looking at 15m chart this retracement is not started yet. Still no higher low or higher high yet. Monday sessio

3/11/25 - Nov Likely to Trade at Least a Little Lower
Friday’s candlestick (Oct 31) was a bear bar closing near its low.
In our previous report, we noted that the bulls wanted a strong bull bar to form a weekly candlestick with a long tail below, reducing the week’s bearishness. Conversely, the bears wanted a strong bear bar to confirm control and

Strong downtrend, price has broken below several support levels.The price is well below the Kumo (cloud), which is a strong bearish signal.
The Kijun-Sen (Base Line) is at 4,405 and the Tenkan-Sen (Conversion Line) is below it, suggesting bearish momentum.
The Chikou Span (Lagging Span) is below the price from 26 periods ago, confirming the bearish trend.
The

13/11/25 Still No Bounce, Will Bears Get Another Leg Down?
Yesterday’s candlestick (Wednesday, Nov 12) was an inside bear bar closing in its lower half.
In our previous report, we said traders would watch whether the bulls could produce more decent bull bars in the days ahead, or if the pullback phase continues to be sideways.
The market continues to

11/11/25 Can Bulls Create a Decent Pullback?
Yesterday’s candlestick (Monday, Nov 10) was a doji bar with prominent tails that closed in its lower half.
In our previous report, we said traders would watch whether the bulls could produce more decent bull bars in the days ahead, or if the bears would extend their follow-through selling inst
See all ideas
Summarizing what the indicators are suggesting.
Neutral
SellBuy
Strong sellStrong buy
Strong sellSellNeutralBuyStrong buy
Neutral
SellBuy
Strong sellStrong buy
Strong sellSellNeutralBuyStrong buy
Neutral
SellBuy
Strong sellStrong buy
Strong sellSellNeutralBuyStrong buy
A representation of what an asset is worth today and what the market thinks it will be worth in the future.
Displays a symbol's price movements over previous years to identify recurring trends.
Frequently Asked Questions
The current price of Crude Palm Oil Futures is 4,100 MYR / TNE — it has risen 0.32% in the past 24 hours. Watch Crude Palm Oil Futures price in more detail on the chart.
The volume of Crude Palm Oil Futures is 5.49 K. Track more important stats on the Crude Palm Oil Futures chart.
The nearest expiration date for Crude Palm Oil Futures is Dec 15, 2025.
Traders prefer to sell futures contracts when they've already made money on the investment, but still have plenty of time left before the expiration date. Thus, many consider it a good option to sell Crude Palm Oil Futures before Dec 15, 2025.
Open interest is the number of contracts held by traders in active positions — they're not closed or expired. For Crude Palm Oil Futures this number is 22.11 K. You can use it to track a prevailing market trend and adjust your own strategy: declining open interest for Crude Palm Oil Futures shows that traders are closing their positions, which means a weakening trend.
Buying or selling futures contracts depends on many factors: season, underlying commodity, your own trading strategy. So mostly it's up to you, but if you look for some certain calculations to take into account, you can study technical analysis for Crude Palm Oil Futures. Today its technical rating is sell, but remember that market conditions change all the time, so it's always crucial to do your own research. See more of Crude Palm Oil Futures technicals for a more comprehensive analysis.