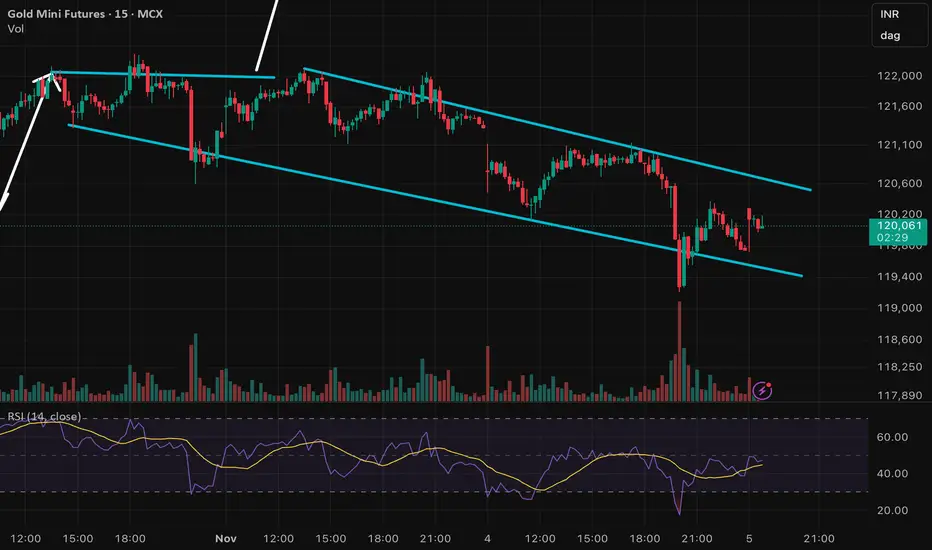
GOLD falling in a parallel channel formation Gold price has been falling since yesterday as expectations of December rate cut fades away. It is forming a parallel falling channel pattern and has recently bounced from the lower zone.
Keep an eye on it as volatility is expected to stay and there will be ample opportunities to capture movements. Follow me for live updates.
Trade ideas
XAUXAUStraight from perplexity - Potential for a Return to $4,200
Gold prices have fluctuated but repeatedly tested the $4,200 level, and the consensus among many experts is that, despite recent corrections, gold could readily revisit or sustain levels near $4,200, depending on global economic events, monetary policy (especially Fed rate decisions), inflation, and geopolitical uncertainties.

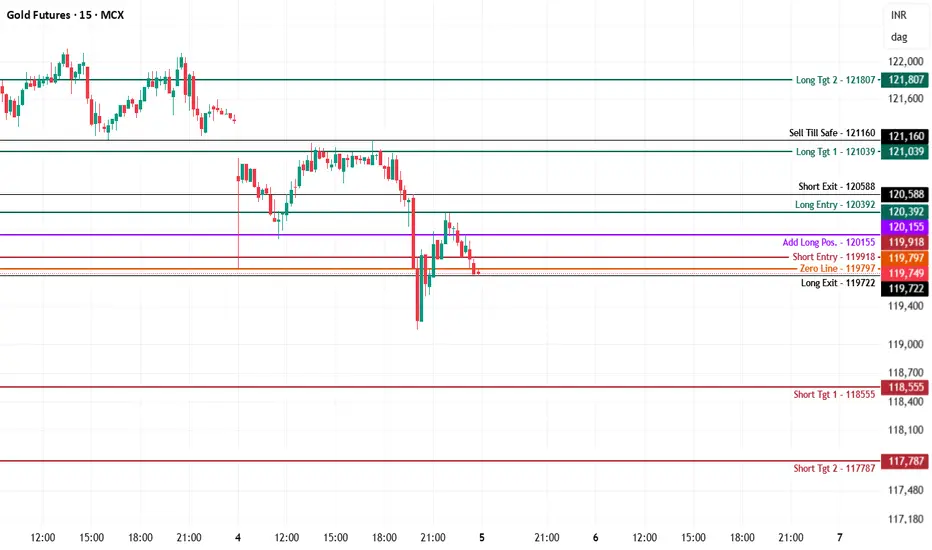
Gold MCX Future - Intraday Technical Analysis - 5th Nov., 25MCX:GOLD1!
MCX Gold Futures — Chart Pathik Insights | 5-Nov-25
Gold futures are under selling pressure, trading stall at 119,749 right at the zero line after a sharp leg down and minor bounce attempts. Price remains weak as sellers control action just beneath the 120,000 psychological mark, pointing to possible further downside unless reclaimed by bulls.
Bearish Structure:
Short setups dominate below 119,918, with every failed retest of the add-long (120,155) keeping momentum with sellers.
Downside Levels:
118,555: First logical target for bears; cover some, trail the rest.
117,787: Aggressive extension if broad liquidation triggers.
Risk Management: Shorts should be managed above the add-long or zero line to minimize risk if a reversal takes hold.
Bullish Structure:
Longs to be considered only above 120,392, needing quick acceptance back in the prior higher band and strong closes above resistance.
Upside Levels:
121,039: Initial resistance for partial or full booking.
121,807: Extension if sentiment flips with volume.
Risk Management: Use the short-entry/zero-line as stops for any fresh longs caught in whipsaws.
Neutral/Inflection:
The 119,797–119,749 band marks the direct battle for the session — choppy price is likely until a firm imbalance emerges. Be patient for confirmation before executing size.
Use these mapped zones for optimal structure, adaptive entries, and aggressive defense.
If these levels clarify your daily plan, boost, comment, and share—your support boosts the learning loop.
Follow Chart Pathik for unbiased pivots, process-backed logic, and practical market learning.
GC week 45threw this together real quick.
T.A explained -
BS & FS levels are expected support when dashed lines, tested when dotted and resistance when solid lines.
The inverse is true for the Inv. BS Inv. FS levels, they are resistance as dashed lines, tested as dotted and support as solid lines.
Monthly timeframe is color pink
weekly grey
daily is red
4hr is orange
1hr is yellow
15min is blue
5min is green if they are shown.
strength favors the higher timeframe.
2x dotted levels are origin levels where trends have or will originate. When trends break, price will target the origin of the trend. its math, when the trend breaks, the vertex breaks too so the higher timeframe level/trend that breaks, the more volatility there could be as strength in the orders flow in to fuel the move.

GOLD COMEXGold looks weak and face Resistance in 4010 and 4050. On 1hour good setup for short. Target near 3810 and SL NEAR 4050 .

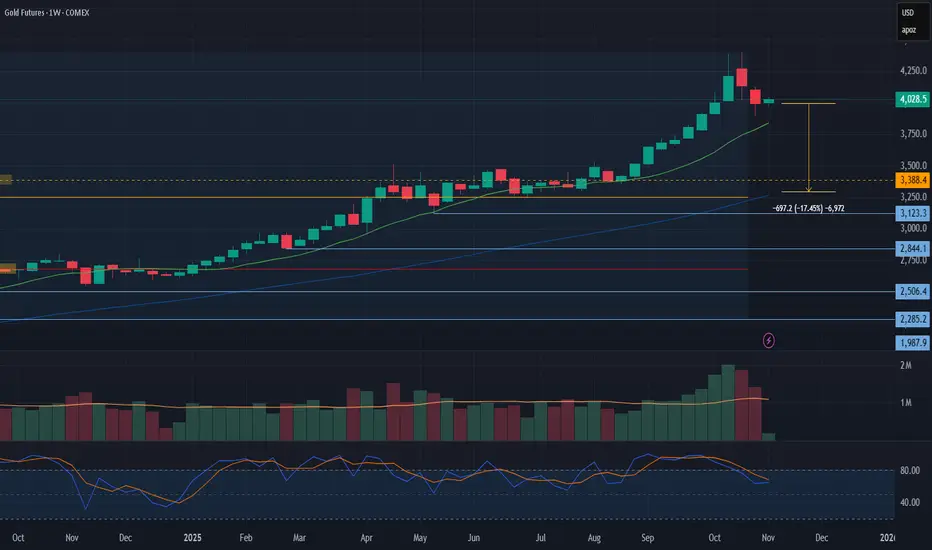
Gold futuresOver the past four weeks, gold futures have pulled back and fallen below the $4000 level. Formally, the trend remains bullish; however, from a historical perspective, it has already lasted nearly 1000 days, which leaves little room for further growth. In the event of a downward correction, gold could target the support level in the $3200-3300 range.
Long-term trend: Up
Resistance level: 4400
Support level: 3200-3300
GC Higher or Lower?Looking at GC on the 4 hour TF, we see it consolidating in a small rising wedge. If price wants to continue higher, I will be looking for price to drop back down to the $3980s level and then move higher breaking out of the wedge. If price wants to continue lower, I will be looking for price to make its way up to the 38.2% Fibonacci level marked on the chart, around $4090s, before breaking back down and creating another leg down in its recent downtrend.
What are your thoughts on GC?
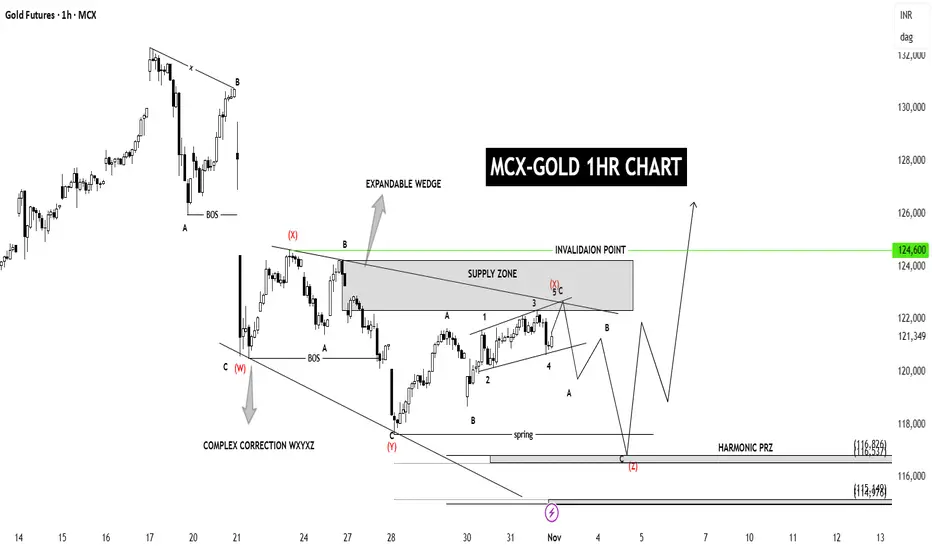
MCX-GOLD 1HR SWING🟡 1. Chart Title
“MCX-GOLD 1HR CHART” — This means the analysis is based on each candle representing 1 hour of price action.
⸻
⚙ 2. Structure Breakdown
• Complex Correction (W–X–Y–X–Z):
This shows that gold has been in a corrective phase, not an impulsive move.
The correction is labeled as a WXYXZ structure — a complex sideways/downward correction with multiple swings.
• Expandable Wedge:
The pattern shows an expanding shape, meaning each swing is getting slightly larger.
This is a sign of high volatility and often forms before a major breakout.
⸻
⚫ 3. Key Zones
• Supply Zone (around ₹124,000–₹124,600):
This is where sellers are expected to enter the market, possibly pushing the price down again.
• Invalidation Point (₹124,600):
If the price goes above ₹124,600, this current bearish correction view is invalidated, and a bullish breakout could start.
• Harmonic PRZ (Potential Reversal Zone):
Located around ₹116,800 – ₹113,400, marked at the bottom of the chart.
This is a buy zone (demand area) based on harmonic projection — expecting the price to reverse upward from this region.
⸻
🔁 4. Elliott Wave Labels
• Current correction labeled as Wave (4) —
After completion, a strong Wave (5) impulse upward is expected.
• Sub-waves (a–b–c) are drawn within the correction to show smaller internal movements.
⸻
📉 5. Expected Move
The chart shows two possible paths:
1. Short-term bearish move —
Price may fall from the supply zone (~₹122,000–₹124,000) to the harmonic PRZ around ₹117,000.
2. Then bullish reversal —
From the PRZ, the chart expects a strong upside rally, possibly toward ₹126,000+.
Gold Today's gold chart has 11 drawings from the monthly timeframe in pink to the 15min timeframe in blue.
top down analysis favors the higher timeframe levels for strength but the best entries are found on the lower timeframes fractals confirming the larger timeframe direction.
Gold has broken an accumulation trend and is now looking for the liquidity from above to test the support at lower levels. We'll look back later and see which levels were taken and where liquidity was hiding,
price just tested a 4hr trend so price is in between the 1hr timeframe support ladder and daily resistance. If price can hold the 1hr timeframe, it has a chance to regain the daily trend or at least back test it.

Gold: Bearish Divergence Signals Weak MomentumFenzoFx—Gold tapped into the $4,050.00 buy-side liquidity yesterday, currently trading below this level. The cumulative volume delta demonstrates a lack of buying interest in gold, formed a bearish divergence with the price chart.
From a technical perspective, if Gold remains below $4,050.00, the price will likely decline toward the equal lows at $3,925.00.

GOLD might be resuming it's bullish trend soon!Price is breaking the trendline, made higher low and
now is making a higher high. IF confirmed this brekout.
And the faster moving averages crossover above the 55 EMA,
it will be configured a good entry point for Gold.
Now, with the price and faster moving averages 25 EMA
and 55 EMA between the 200 EMA and SMA moving averages, it's still in a non
decision zone for me.
After crossover, trend confirms, after higher high (with body), trend
confirms. If it goes above 4,171 and 4.394 with a good volume and
strenth, it might be a crystal clear indication of a new trend that can
go up to 5K pretty quick.

COMEX Gold Futures : Technical View
Gold futures are forming a falling wedge pattern, currently trading at ₹3,995. A break below ₹3,930 could indicate a short-term correction, while failing to sustain above ₹4,050 might lead to continued downward pressure.
Key Levels:
- Current Price: ₹3,995
- Support: ₹3,930
- Resistance: ₹4,050
- Potential Outcome: Break below ₹3,930 may lead to further decline, while sustaining above ₹4,050 could indicate a bullish reversal
Technical Analysis:
The falling wedge pattern suggests a potential reversal or continuation of the trend. If gold futures break below ₹3,930, it may signal a short-term correction. Conversely, sustaining above ₹4,050 could indicate a bullish reversal.

Bearish Gap Caps XAU/USD UpsideFenzoFx—Gold traded lower after it crossed above the descending trendline, capped at the $4,050.00 bearish gap. Currently, Gold is testing the trendline as support, with support at $3,925.00. The recent breakout has confirmation from cumulative volume delta, and the delta also made a new higher low and lower high.
The immediate support rests at $3,925.00. Yesterday, the price swept the sell-side liquidity by a few ticks below this level. This means the price should not return below this level in the current session if the market is bullish today.
From a technical perspective, if $3,925.00 support holds, XAU/USD will likely rise to take the buy-side liquidity at $4,050.00. Please note that the bearish outlook should be invalidated if the price closes below the immediate support. This setup has a 1 to 4 risk-to-reward.

GC Futures – Patience While the Market Waits for a CatalystYesterday’s session was pure range — no real direction, likely ahead of Fed news and the Trump-China talks. Price continues to consolidate beneath the H4 FVG and above the Daily Low (D-L), with both sides holding liquidity.
Until we see a clean displacement, I’m sitting on my hands and preserving capital. The market’s indecision is information — it’s telling us to wait.
Key levels remain 4,046 (D-H) and 3,930 (D-L) — any clean break beyond these zones should define the next directional move.
#Gold #Futures #GC #DayTrading #NoFOMO #ICT #OrderFlow #MarketStructure

gold to go another leg or two lower? 3800 or 3650gold achieves measured move just outside of timed zone from head and shoulders setup, retests bottom of initial shoulder, and returns to measured down move looking to break 3900 support down to 3800.
if downward momentum continues look for 3650 as solid support from an old upward trend line and parallel channel.

The reveral candle cannot be ignoredReversal candle on massive volume could be indication that the big money is exiting quietly. This along with the recent subtle strength moving into the treasuries and the consistent over exuberance of the market says it time for a sell off in gold.

Gold Near 4k: Mean-Reversion Short — Watch 3,985–4,015Timeframe: 15m • 30m • 1h
Symbol: COMEX_MINI:MGC1!
Current Read (MTF)
15m (lead): Drives turns. Watching for rejection wicks into 3,985–4,015 ; momentum rolling under guides.
30m (confirm): Capped by MA cluster ~ 4,002 ; sellers defending sub-4k. A 30m close above 4,030 changes the script.
1h (context): Lower-highs intact until 4k+ is reclaimed with closes.
Plans From Here
Fade a pop (preferred): Re-sell 3,985–4,015 on wick/rejection.
Stops: 4,032 (tight, better R:R) or 4,038 (safer vs quick sweep above 4,030/4,035).
Breakdown → retest: Lose/close below 3,960 , sell the underside retest (≈3,960–3,965) toward 3,930 , then 3,900 .
Flip long if invalidated: 30m acceptance > 4,030 opens 4,078 → 4,152; look for pullback buys into 4,015/4,030.
Levels I’m Trading
Supply/short zone: 3,985–4,015
Invalidation for shorts: 4,030 (30m close)
Downside magnets: TP1 3,960 • TP2 3,930 • TP3 3,900
Indicator Cheatsheet
15m & 30m lead the higher TFs. I act on 15m, confirm with 30m.
Bottom panel colors: Red = sell pressure , Green = buy pressure , Yellow = potential reversal .
Buy/Sell signals: Highest weight when they line up with the 3,985–4,015 zone or the 3,960 breakdown/retest.
Plan: let 15m/30m lead. Fade into 3,985–4,015 unless we accept above 4,030; otherwise trade breakdown–retests toward 3,930/3,900. Not financial advice — manage your own risk.
COMEX_MINI:MGC1!

Buy Entry Model Key Points Summary
Market is still in a downtrend, but a pullback is in progress.
Lower supply zone around 4,050 is currently holding resistance.
Strong demand zone around 3,975 is your main downside target.
Trade setup shows a short position respecting supply-demand structure.
Confirmation of continued bearishness would come from a break below 3,990.
A break above 4,075 would invalidate the short and suggest potential shift in momentum.

Expecting the worst. Hoping for the best.We have an engulfing candle on the monthly. Definitely a bearish candle on the weekly in the past weeklies. It only had known the first of the year. To put everything in the gold. I would be 2x richer. Than I was. Than I am. Brace for the pullback. Short GDX late if you want to. It always lags. Zoom out. Check out the 15 Minute check it all. It's not looking good.

Understanding Margin & Mechanics in Futures MarketsBefore you trade Futures, it’s essential to understand how these markets operate, especially how margin, leverage, and settlement work. This insight helps you manage risk, stay capital-efficient, and avoid unnecessary surprises.
Margin Basics
Every future position requires margin. It’s important to note margin is not an added cost per contract, margin is a good-faith deposit or can be thought of as a “performance bond” to ensure you can meet your obligations. There are three main types:
Initial Margin: The exchange sets this as a percentage of the contract’s notional value based on a wide variety of factors including volatility, size of the contract, and average market movement.
Maintenance Margin: The minimum balance required to keep your position open. If your balance drops below this, you’ll get a margin call.
Day Trading Margin: Set by your broker, often a fraction of the exchanges Initial Margin. Day Trading margins can provide more leverage, but in turn this comes with more risk.
Leverage in Action
Futures are leveraged products. With just a small amount of capital, you can control a much larger position. For example, with the E-mini S&P 500 trading at 6800, one contract has a notional value of $50 x 6800 = $340,000. We illustrate this below using initial margin and day margins examples.
Leverage using Initial Margin:
Leverage = Notional Value / Initial margin required
Example:
For 1 Long ES contract, with initial margin $23429.
Leverage = 340,000 /23429
Leverage = 14.5x
Leverage using Day Trading Margin:
Leverage = Notional Value / Day margin required
For 1 Long ES contract, with day margin at $1000.
Leverage = 340,000/1000
Leverage = 340x
**As the notional value rises or falls, so does leverage. Leverage is a double-edged sword it can work for you and against you. Higher leverage increases the risk of gains as well as losses.
Depending on your margin, you might only need a few thousand dollars to take that trade. While this enhances your buying power, it also increases risk, as losses could exceed your initial deposit.
Mark-to-Market & Daily Settlements
Futures are marked to market daily. This means your P&L is updated at the end of each session based on the day’s closing price. Gains are credited to your account, and losses are debited, helping to ensure real-time risk management and capital adequacy.
Physical vs. Cash Settlement
When a contract expires, there are two possible outcomes:
Physical Delivery: You receive or deliver the actual commodity.
Example: An oil producer secures a price of $62.00 per barrel through a long futures position. At contract expiration, the producer is obligated to take delivery of 1,000 barrels, which represents $62,000 in total value. If market prices rise to $80.00 per barrel, the producer can sell the physical oil at an $18.00 per barrel gain (before accounting for commissions and futures and other related fees).
Cash Settlement: No goods change hands, and your account is adjusted based on the final settlement price set by the exchange. This is common in financial contracts like the E-mini S&P 500 (ES).
Understanding margin and leverage is fundamental to trading futures effectively. These mechanics define how much risk you’re taking, how your capital is allocated, and how your account is managed daily.
At EdgeClear, our mission is to help traders develop a deeper understanding of the markets and the tools that move them. Follow us on TradingView for more Trade Ideas like this one, or connect with our team to learn how you can trade futures with confidence, precision, and the right guidance.
GC UpdateIf gold was done, silver would have flat out tanked instead of going sideways.
Overlayed the last flat, expanded to the last ramp up. We're gonna see sideways movement until teh Fed decides on even more rate cuts and end to QT. Then we're headed to over 5k.
You'll know if it's happening if it sets a new high. All previous tanks did not set a new high before tanking.

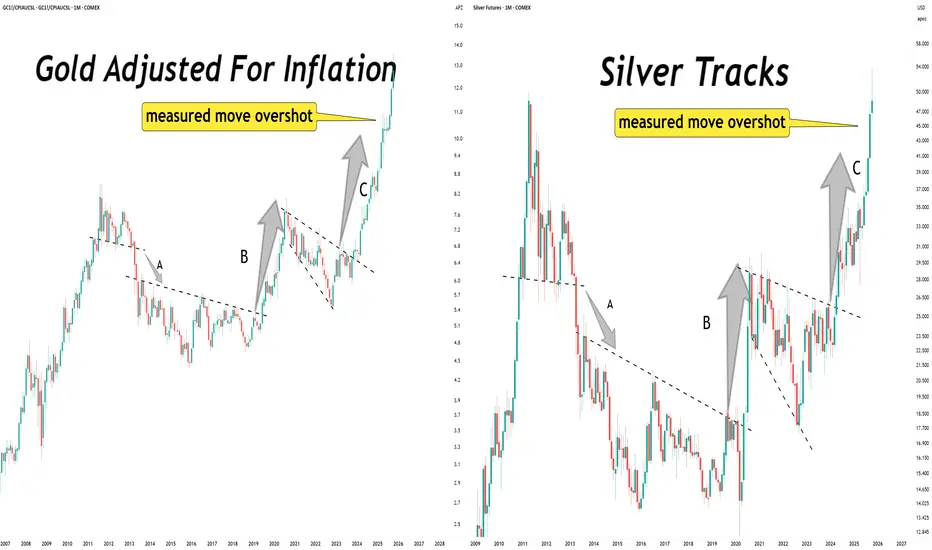
Launch patterns have exceeded their measure move targets.Gold. Silver.
Launch patterns have exceeded their measure move targets.
What comes next?
I would expect more launch patterns to morph into existence. Those are the building blocks of a long term uptrend.