Choosing Your Path in Futures TradingThere’s more than one way to participate in the futures markets. Whether you're hands-on or prefer a more passive approach, selecting the right method depends on your trading goals, risk tolerance, and available time. Here’s a breakdown of the most common approaches used by active and aspiring futures traders.
1. Self-Directed Trading
If you like full control over your trades, this approach is for you. It requires staying up to date on market news, analyzing charts, and executing your own trades according to a plan and framework which can be referred to as your “strategy.” Experienced traders may prefer this model for its flexibility and transparency.
Looking to enhance your edge? Tools like EdgeWatch offer performance tracking, trade organization, and detailed statistics. While EdgeWatch is free, it does require a Rithmic data feed to operate.
2. Automated Trading Systems
These systems use predefined rules to analyze data and execute trades without manual intervention. They can be ideal for traders who want to capitalize on algorithmic speed and logic while minimizing emotional decision-making, or for traders who might not have the time to dedicate to self-directed trading.
EdgeClear offers connectivity to a handful of automated programs, if you are interested in learning more please contact us.
3. Managed Futures
For a more passive route, managed futures allow you to invest in futures contracts through a Commodity Trading Advisor (CTA) or Commodity Pool Operator (CPO). The advisor handles the trading, using their expertise to manage risk and seek opportunity.
4. Broker-Assisted Trading
Prefer to have a trusted guide by your side? With broker-assisted trading, a professional helps execute trades, manage risk, and offer support—all tailored to your preferences.
Key Takeaway
Every trader’s journey in the futures markets looks different. Whether you thrive on taking full control of your trades, prefer automated systems, or rely on professional guidance, the key is to find the approach that aligns with your goals, risk tolerance, and lifestyle.
Understanding the options available self-directed, automated, managed, or broker-assisted empowers you to trade more confidently and effectively.
Call to Action
At EdgeClear, we’re dedicated to helping traders at every level find the tools, guidance, and support they need to succeed. Explore our platforms, connect with our expert brokers, or follow us on TradingView to discover more Trade Ideas and educational content to refine your edge.
Trade ideas

Gold: Bearish Divergence Signals Weak MomentumFenzoFx—Gold tapped into the $4,050.00 buy-side liquidity yesterday, currently trading below this level. The cumulative volume delta demonstrates a lack of buying interest in gold, formed a bearish divergence with the price chart.
From a technical perspective, if Gold remains below $4,050.00, the price will likely decline toward the equal lows at $3,925.00.

GOLD might be resuming it's bullish trend soon!Price is breaking the trendline, made higher low and
now is making a higher high. IF confirmed this brekout.
And the faster moving averages crossover above the 55 EMA,
it will be configured a good entry point for Gold.
Now, with the price and faster moving averages 25 EMA
and 55 EMA between the 200 EMA and SMA moving averages, it's still in a non
decision zone for me.
After crossover, trend confirms, after higher high (with body), trend
confirms. If it goes above 4,171 and 4.394 with a good volume and
strenth, it might be a crystal clear indication of a new trend that can
go up to 5K pretty quick.

“Gold – Compression Into the MAs, Breakdown Loading?”short but sweet for today.
Gold has been moving sideways into the 5/10/20 MA cluster after a sharp pullback from recent highs — a classic relief phase inside a developing down leg. With momentum still leaning bearish and the MAs pressing from above, the current structure suggests more downside ahead for now.
Until the Daily trend realigns and we see clean strength reclaiming the MAs, the focus remains strictly on shorts only. Price could easily roll over from this zone and continue toward 3,850–3,600 where stronger demand may appear.
If buyers step in and flip structure, we’ll reassess — but for the moment, continuation to the downside remains the base case.

COMEX Gold Futures : Technical View
Gold futures are forming a falling wedge pattern, currently trading at ₹3,995. A break below ₹3,930 could indicate a short-term correction, while failing to sustain above ₹4,050 might lead to continued downward pressure.
Key Levels:
- Current Price: ₹3,995
- Support: ₹3,930
- Resistance: ₹4,050
- Potential Outcome: Break below ₹3,930 may lead to further decline, while sustaining above ₹4,050 could indicate a bullish reversal
Technical Analysis:
The falling wedge pattern suggests a potential reversal or continuation of the trend. If gold futures break below ₹3,930, it may signal a short-term correction. Conversely, sustaining above ₹4,050 could indicate a bullish reversal.

Bearish Gap Caps XAU/USD UpsideFenzoFx—Gold traded lower after it crossed above the descending trendline, capped at the $4,050.00 bearish gap. Currently, Gold is testing the trendline as support, with support at $3,925.00. The recent breakout has confirmation from cumulative volume delta, and the delta also made a new higher low and lower high.
The immediate support rests at $3,925.00. Yesterday, the price swept the sell-side liquidity by a few ticks below this level. This means the price should not return below this level in the current session if the market is bullish today.
From a technical perspective, if $3,925.00 support holds, XAU/USD will likely rise to take the buy-side liquidity at $4,050.00. Please note that the bearish outlook should be invalidated if the price closes below the immediate support. This setup has a 1 to 4 risk-to-reward.

GC Futures – Patience While the Market Waits for a CatalystYesterday’s session was pure range — no real direction, likely ahead of Fed news and the Trump-China talks. Price continues to consolidate beneath the H4 FVG and above the Daily Low (D-L), with both sides holding liquidity.
Until we see a clean displacement, I’m sitting on my hands and preserving capital. The market’s indecision is information — it’s telling us to wait.
Key levels remain 4,046 (D-H) and 3,930 (D-L) — any clean break beyond these zones should define the next directional move.
#Gold #Futures #GC #DayTrading #NoFOMO #ICT #OrderFlow #MarketStructure

XAUXAUStraight from perplexity - Potential for a Return to $4,200
Gold prices have fluctuated but repeatedly tested the $4,200 level, and the consensus among many experts is that, despite recent corrections, gold could readily revisit or sustain levels near $4,200, depending on global economic events, monetary policy (especially Fed rate decisions), inflation, and geopolitical uncertainties.

gold to go another leg or two lower? 3800 or 3650gold achieves measured move just outside of timed zone from head and shoulders setup, retests bottom of initial shoulder, and returns to measured down move looking to break 3900 support down to 3800.
if downward momentum continues look for 3650 as solid support from an old upward trend line and parallel channel.

The reveral candle cannot be ignoredReversal candle on massive volume could be indication that the big money is exiting quietly. This along with the recent subtle strength moving into the treasuries and the consistent over exuberance of the market says it time for a sell off in gold.

Gold Near 4k: Mean-Reversion Short — Watch 3,985–4,015Timeframe: 15m • 30m • 1h
Symbol: COMEX_MINI:MGC1!
Current Read (MTF)
15m (lead): Drives turns. Watching for rejection wicks into 3,985–4,015 ; momentum rolling under guides.
30m (confirm): Capped by MA cluster ~ 4,002 ; sellers defending sub-4k. A 30m close above 4,030 changes the script.
1h (context): Lower-highs intact until 4k+ is reclaimed with closes.
Plans From Here
Fade a pop (preferred): Re-sell 3,985–4,015 on wick/rejection.
Stops: 4,032 (tight, better R:R) or 4,038 (safer vs quick sweep above 4,030/4,035).
Breakdown → retest: Lose/close below 3,960 , sell the underside retest (≈3,960–3,965) toward 3,930 , then 3,900 .
Flip long if invalidated: 30m acceptance > 4,030 opens 4,078 → 4,152; look for pullback buys into 4,015/4,030.
Levels I’m Trading
Supply/short zone: 3,985–4,015
Invalidation for shorts: 4,030 (30m close)
Downside magnets: TP1 3,960 • TP2 3,930 • TP3 3,900
Indicator Cheatsheet
15m & 30m lead the higher TFs. I act on 15m, confirm with 30m.
Bottom panel colors: Red = sell pressure , Green = buy pressure , Yellow = potential reversal .
Buy/Sell signals: Highest weight when they line up with the 3,985–4,015 zone or the 3,960 breakdown/retest.
Plan: let 15m/30m lead. Fade into 3,985–4,015 unless we accept above 4,030; otherwise trade breakdown–retests toward 3,930/3,900. Not financial advice — manage your own risk.
COMEX_MINI:MGC1!

Buy Entry Model Key Points Summary
Market is still in a downtrend, but a pullback is in progress.
Lower supply zone around 4,050 is currently holding resistance.
Strong demand zone around 3,975 is your main downside target.
Trade setup shows a short position respecting supply-demand structure.
Confirmation of continued bearishness would come from a break below 3,990.
A break above 4,075 would invalidate the short and suggest potential shift in momentum.

Expecting the worst. Hoping for the best.We have an engulfing candle on the monthly. Definitely a bearish candle on the weekly in the past weeklies. It only had known the first of the year. To put everything in the gold. I would be 2x richer. Than I was. Than I am. Brace for the pullback. Short GDX late if you want to. It always lags. Zoom out. Check out the 15 Minute check it all. It's not looking good.

Understanding Margin & Mechanics in Futures MarketsBefore you trade Futures, it’s essential to understand how these markets operate, especially how margin, leverage, and settlement work. This insight helps you manage risk, stay capital-efficient, and avoid unnecessary surprises.
Margin Basics
Every future position requires margin. It’s important to note margin is not an added cost per contract, margin is a good-faith deposit or can be thought of as a “performance bond” to ensure you can meet your obligations. There are three main types:
Initial Margin: The exchange sets this as a percentage of the contract’s notional value based on a wide variety of factors including volatility, size of the contract, and average market movement.
Maintenance Margin: The minimum balance required to keep your position open. If your balance drops below this, you’ll get a margin call.
Day Trading Margin: Set by your broker, often a fraction of the exchanges Initial Margin. Day Trading margins can provide more leverage, but in turn this comes with more risk.
Leverage in Action
Futures are leveraged products. With just a small amount of capital, you can control a much larger position. For example, with the E-mini S&P 500 trading at 6800, one contract has a notional value of $50 x 6800 = $340,000. We illustrate this below using initial margin and day margins examples.
Leverage using Initial Margin:
Leverage = Notional Value / Initial margin required
Example:
For 1 Long ES contract, with initial margin $23429.
Leverage = 340,000 /23429
Leverage = 14.5x
Leverage using Day Trading Margin:
Leverage = Notional Value / Day margin required
For 1 Long ES contract, with day margin at $1000.
Leverage = 340,000/1000
Leverage = 340x
**As the notional value rises or falls, so does leverage. Leverage is a double-edged sword it can work for you and against you. Higher leverage increases the risk of gains as well as losses.
Depending on your margin, you might only need a few thousand dollars to take that trade. While this enhances your buying power, it also increases risk, as losses could exceed your initial deposit.
Mark-to-Market & Daily Settlements
Futures are marked to market daily. This means your P&L is updated at the end of each session based on the day’s closing price. Gains are credited to your account, and losses are debited, helping to ensure real-time risk management and capital adequacy.
Physical vs. Cash Settlement
When a contract expires, there are two possible outcomes:
Physical Delivery: You receive or deliver the actual commodity.
Example: An oil producer secures a price of $62.00 per barrel through a long futures position. At contract expiration, the producer is obligated to take delivery of 1,000 barrels, which represents $62,000 in total value. If market prices rise to $80.00 per barrel, the producer can sell the physical oil at an $18.00 per barrel gain (before accounting for commissions and futures and other related fees).
Cash Settlement: No goods change hands, and your account is adjusted based on the final settlement price set by the exchange. This is common in financial contracts like the E-mini S&P 500 (ES).
Understanding margin and leverage is fundamental to trading futures effectively. These mechanics define how much risk you’re taking, how your capital is allocated, and how your account is managed daily.
At EdgeClear, our mission is to help traders develop a deeper understanding of the markets and the tools that move them. Follow us on TradingView for more Trade Ideas like this one, or connect with our team to learn how you can trade futures with confidence, precision, and the right guidance.
GC UpdateIf gold was done, silver would have flat out tanked instead of going sideways.
Overlayed the last flat, expanded to the last ramp up. We're gonna see sideways movement until teh Fed decides on even more rate cuts and end to QT. Then we're headed to over 5k.
You'll know if it's happening if it sets a new high. All previous tanks did not set a new high before tanking.

GOLD Futures SHORT - MS BreakdownPrice has broken the lower high (LH), confirming a shift from bullish to bearish.
Expecting continuation down to the 4,000 demand zone (Futures). The demand zone is strong but has been tested twice already. Would expect on the third test to break it.

time to start looking for good short entries on XAULook at that volume spike
Look at that parabola
May spike to 5k to rinse early shorts BUT
it's time to send the relic much, much, lower
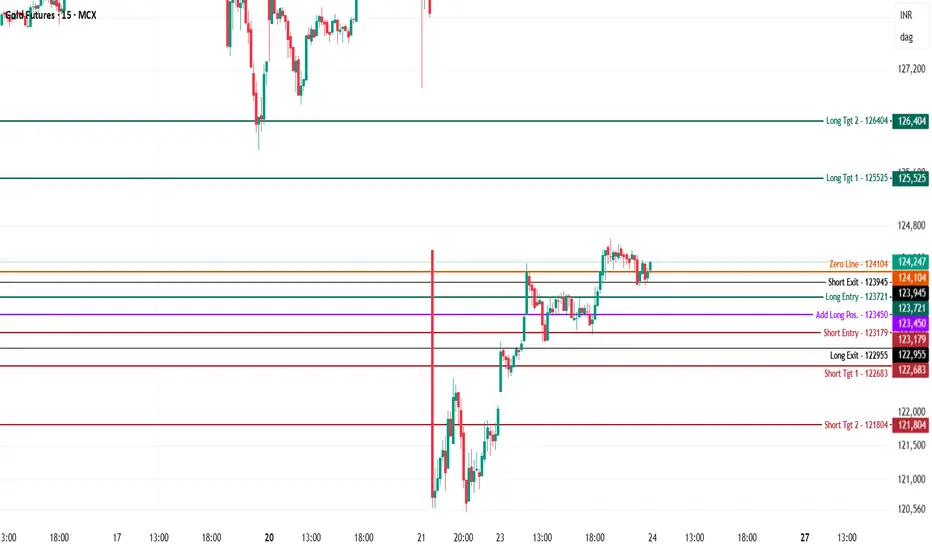
Gold MCX Future - Intraday Technical Analysis - 24 Oct., 2025$MCX:GOLD — Chart Pathik Insights | 24-Oct-25
Gold continues to advance, holding firm at 124,247, consolidating just above the zero line at 124,104 after a robust upside move from the midweek lows. Today’s levels lay out key turning zones for session traders who demand structure and decisive signals.
Bearish Outlook:
Short setups become actionable below 123,179, particularly if sellers regain control at or beneath the add-long (123,450) and long-exit (122,955) zones.
Downside Levels:
122,683: First short target for quick booking or cover.
121,804: Deeper extension should downward momentum continue.
Risk Control: Keep stops tight above 123,450; cover or reduce position if price closes above for more than one bar.
Bullish Outlook:
Long ideas gain traction above 123,721, with momentum confirmed on advances above 123,945 and strong closes above resistance.
Upside Levels:
125,525: Targeted resistance for intraday trend profit-taking.
126,404: Major extension if breakout energy persists.
Risk Control: Manage risk on new longs at 123,450 or 123,179, as per session volatility and entry structure.
Neutral Zone:
124,104 stands as the near-term control line. Price persistence here will keep trade choppy — let the market break cleanly above or below to trigger the next leg of activity.
Reference these levels to stay structured and always play within your system.
If these insights support your gold strategy, show your love: boost, comment, and share! Your feedback keeps these levels coming for all learners and disciplined traders.
Follow Chart Pathik for clarity, logic-driven maps, and relentless, rules-based perspective.
Gold Mcx Future update on 23/10/2025 Price 1,23,500/- Per 10g MCX GOLD (DEC 2025 FUTURES) — QUICK MARKET UPDATE
As of 23 Oct 2025 · 13 : 25 UK / 17 : 55 IST
Last Trade: ₹ 1 23 500 (– 0.9 % intraday · heavy sell-off in progress)
Bias: Bearish | Market Regime: High-volatility unwind | Sentiment: Fear building
Market Pulse
Gold is sliding sharply as intraday longs unwind across MCX and COMEX.
The ₹ 1 24 000 support gave way within the last hour, triggering algorithmic selling and dealer gamma hedges.
At ₹ 1 23 500, the market has erased most of this week’s bounce and is back in line with the lower end of the October value zone.
Macro cues are unsupportive:
The US 10-year yield hovers near 4 %,
USD Index firm around 98.8,
ETF flows negative for a third week.
The combination keeps risk assets on the defensive and gold under pressure.
Technical Read
Structure: Lower-high sequence confirmed.
Daily EMAs: 21 < 55 < 89 < 200 → bearish alignment.
Immediate range: ₹ 1 22 800 – ₹ 1 24 200.
Momentum: RSI ≈ 42, MACD below signal → trend weakness intact.
Failure to hold ₹ 1 23 400 could open the door toward ₹ 1 22 900 and then ₹ 1 22 400.
Order Flow Snapshot
Large sell blocks have reappeared near ₹ 1 23 900 – ₹ 1 24 100.
Cumulative delta remains negative (≈ – 2 000 lots).
No evidence yet of strong absorption by physical or hedging accounts.
Cross-Asset Signals
Asset Last Change Comment
XAUUSD 4 102 $ – 0.2 % Mirrors MCX weakness
USD Index 98.8 + 0.2 % Dollar bid caps metals
US 10Y Yield 3.99 % + 0.8 % Real-rate headwind
Crude Oil (MCX) ₹ 5 425 + 5.3 % Inflation beta higher
Silver (MCX) ₹ 1 48 670 + 2 % Still outperforming gold
Strategy Desk View
Gold is now in short-term breakdown mode after a textbook failure at the ₹ 1 24 300 zone.
The path of least resistance is lower until buyers defend the ₹ 1 22 800 band.
Momentum traders remain short-biased; positional players can look to cover part-profits near ₹ 1 22 400 – ₹ 1 22 600.
Volatility likely to stay elevated as dealers remain short gamma.
Bottom Line:
The rally attempt is over for now. With the dollar firm and yields sticky, MCX Gold could retest the ₹ 1 22 000 area before stabilising.
Expect two-way volatility but the bias remains sell-on-rise until the market closes back above ₹ 1 24 600.
Disclaimer: This note is for market insight and educational purposes only, not investment advice.
Trade responsibly and manage risk.
#Gold #MCX #Commodities #MarketUpdate #BullionAdvise #Finscan #Trading #Macro #InstitutionalFlows

Gold Today's gold chart has 11 drawings from the monthly timeframe in pink to the 15min timeframe in blue.
top down analysis favors the higher timeframe levels for strength but the best entries are found on the lower timeframes fractals confirming the larger timeframe direction.
Gold has broken an accumulation trend and is now looking for the liquidity from above to test the support at lower levels. We'll look back later and see which levels were taken and where liquidity was hiding,
price just tested a 4hr trend so price is in between the 1hr timeframe support ladder and daily resistance. If price can hold the 1hr timeframe, it has a chance to regain the daily trend or at least back test it.

OOO GOLD IS THAT A DOUBLE TOP?I feel like I see a double top formed on the daily! The real test will come with the fib pull back in the 4249-4255 price range but only price will show us but I think we are seeing a key area for gold and If I had to choose I would say we may be heading for a minor pullback to let off some steam and also take some par profits!
Let me know yall thoughts tho and what do you think! GD luck tomorrow, I cant wait for the NY session.

Gold 1hr levels onlyUpdated levels for today
BS & FS levels are expected support when dashed lines, tested when dotted and resistance when solid lines.
The inverse is true for the Inv. BS Inv. FS levels, they are resistance as dashed lines, tested as dotted and support as solid lines.
Monthly timeframe is color pink
weekly grey
daily is red
4hr is orange
1hr is yellow
15min is blue
5min is green if they are shown.
strength favors the higher timeframe.
2x dotted levels are origin levels where trends have or will originate. When trends break, price will target the origin of the trend. its math, when the trend breaks, the vertex breaks too so the higher timeframe level/trend that breaks, the more volatility there could be as strength in the orders flow in to fuel the move.

Can Gold Head Lower?This is the price action I’ll be watching on Gold early next week. Considering the strong bullish momentum we’ve seen in recent weeks, this setup carries higher-than-usual risk, but also offers a clean technical structure and favorable R:R if confirmed.
Last week, comments from President Trump regarding potential 100% tariffs on Chinese imports briefly pressured safe-haven assets. He acknowledged that such tariffs would be unsustainable long term, triggering a late-week pullback in Gold and Silver as risk appetite improved slightly.
However, even if Gold resumes its upward trajectory, it’s important to remember: we trade probabilities, not certainties. This scenario presents a solid probability for short-term downside continuation. This model is supported by both technical exhaustion and shifting short-term fundamentals that could provide the momentum needed for a retracement.
