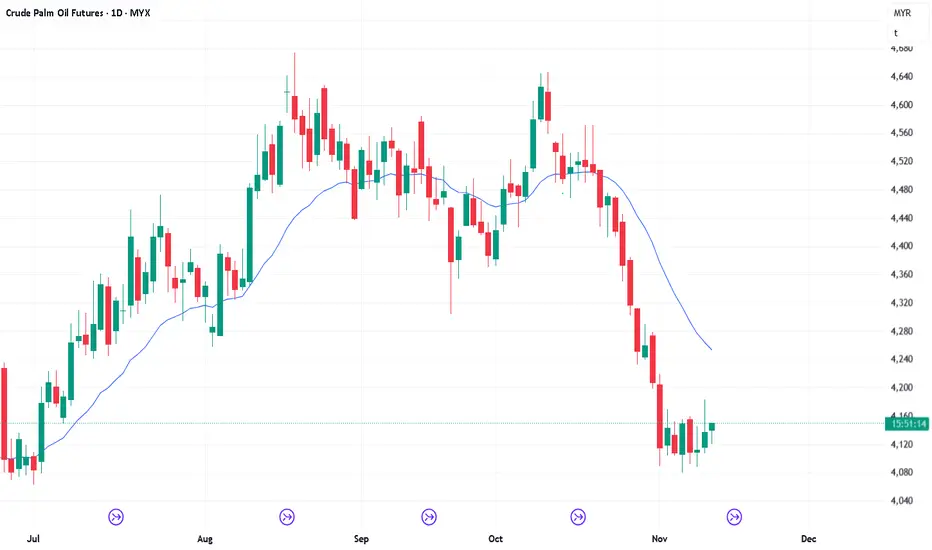
FCPO Week 47 2025: Transition to bullish?Price is in consolidation. It has 2 weeks to follow through on the double top but so far it held. This might indicate that it is in transition to possibly going higher and bearish is losing momentum. Two options next week:
1) Price close and stay above 4200 then we might see price going bullish towa
Related commodities

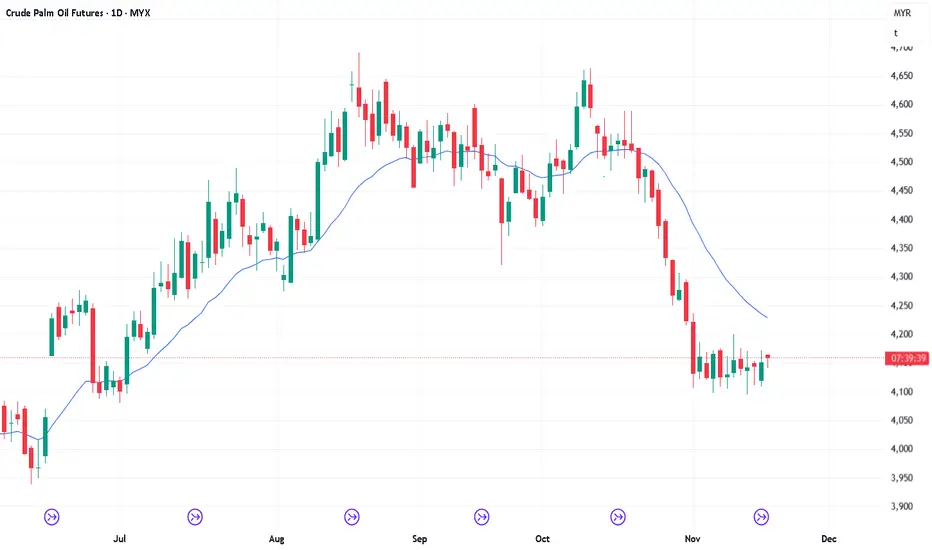
12/11/25 Still Sideways Small Trading Range So Far
Yesterday’s candlestick (Tuesday, Nov 11) was a bull bar closing in its lower half with a long tail above.
In our previous report, we said traders would watch whether the bulls could produce more decent bull bars in the days ahead, or if the bears would extend their follow-through selling inste
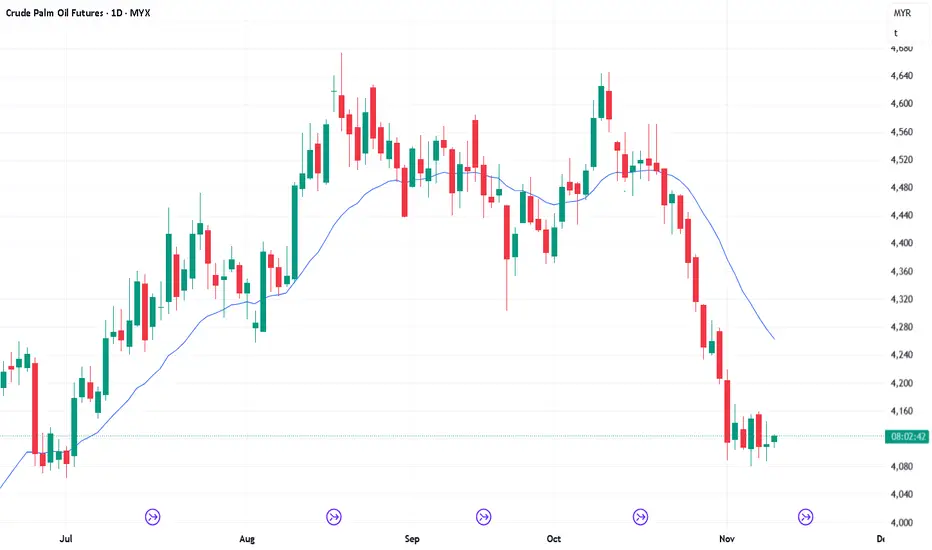
18/11/25 No Breakout from Sideways Tight Trading Range Yet
Monday’s candlestick (Nov 17) was an outside bull bar closing in its upper half with a prominent tail above.
In our previous report, we said traders would watch whether the market continues to chop sideways within the tight trading range formed in the last 9 trading days, or if the market would
Is CPO Malaysia can Breaout 2022 Resistance?Soon MYX:FCPO1! will test it's long term Resistance (since 2022) at MYR4,500.
The question, can it Breakout now?
Try to look at Monthly Chart and you will see that since 2022, CPO Malaysia has been Up Trending according to SMA60. You can expect the fall from early 2022 up to now is within Techni

CPO to move upward to MYR5,800CPO is in Uptrend since June 2021 and will move upward to reach MYR5,800.
Support that needs to be Broken Down to reverse Uptrend is in MYR4,700. As long as CPO is still above MYR4,700, I predict it will move to MYR5,800.

14/11/25 Still Sideways Tight Trading Range
Yesterday’s candlestick (Thursday, Nov 13) was a bull doji closing around the middle of its range.
In our previous report, we said traders would watch whether the bears would attempt to create another leg down, or if the market would continue to consolidate sideways.
The market retested the No

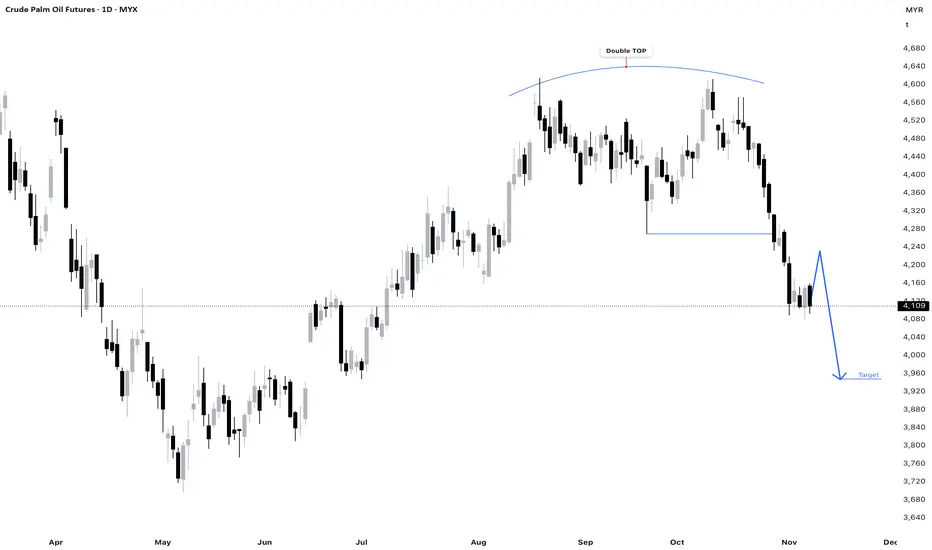
FCPO Week 46 2025: SHORT.MYX:FCPO1! is bearish. However the bearish momentum might be weaken and needs to reenergised. Expecting that price to make a retracement higher before going lower again. This will create a lower high before continuing lower towards below 4000.
17/11/25 Market in Sideways Tight Trading Range
Friday’s candlestick (Nov 14) was a doji closing near its high with a long tail below.
In our previous report, we said traders would watch whether the bears get a strong bear bar or if the bulls could create a strong bull bar, which would create a bull body on the weekly candlestick.
The marke

13/11/25 Still No Bounce, Will Bears Get Another Leg Down?
Yesterday’s candlestick (Wednesday, Nov 12) was an inside bear bar closing in its lower half.
In our previous report, we said traders would watch whether the bulls could produce more decent bull bars in the days ahead, or if the pullback phase continues to be sideways.
The market continues to

11/11/25 Can Bulls Create a Decent Pullback?
Yesterday’s candlestick (Monday, Nov 10) was a doji bar with prominent tails that closed in its lower half.
In our previous report, we said traders would watch whether the bulls could produce more decent bull bars in the days ahead, or if the bears would extend their follow-through selling inst
See all ideas
Summarizing what the indicators are suggesting.
Neutral
SellBuy
Strong sellStrong buy
Strong sellSellNeutralBuyStrong buy
Neutral
SellBuy
Strong sellStrong buy
Strong sellSellNeutralBuyStrong buy
Neutral
SellBuy
Strong sellStrong buy
Strong sellSellNeutralBuyStrong buy
A representation of what an asset is worth today and what the market thinks it will be worth in the future.
Displays a symbol's price movements over previous years to identify recurring trends.
Frequently Asked Questions
The current price of USD RBD Palm Olein Futures is 1,082.5 USD / TNE — it hasn't changed in the past 24 hours. Watch USD RBD Palm Olein Futures price in more detail on the chart.
Track more important stats on the USD RBD Palm Olein Futures chart.
The nearest expiration date for USD RBD Palm Olein Futures is Sep 25, 2026.
Traders prefer to sell futures contracts when they've already made money on the investment, but still have plenty of time left before the expiration date. Thus, many consider it a good option to sell USD RBD Palm Olein Futures before Sep 25, 2026.
Open interest is the number of contracts held by traders in active positions — they're not closed or expired. For USD RBD Palm Olein Futures this number is 1.08 K. You can use it to track a prevailing market trend and adjust your own strategy: declining open interest for USD RBD Palm Olein Futures shows that traders are closing their positions, which means a weakening trend.
Buying or selling futures contracts depends on many factors: season, underlying commodity, your own trading strategy. So mostly it's up to you, but if you look for some certain calculations to take into account, you can study technical analysis for USD RBD Palm Olein Futures. Today its technical rating is neutral, but remember that market conditions change all the time, so it's always crucial to do your own research. See more of USD RBD Palm Olein Futures technicals for a more comprehensive analysis.