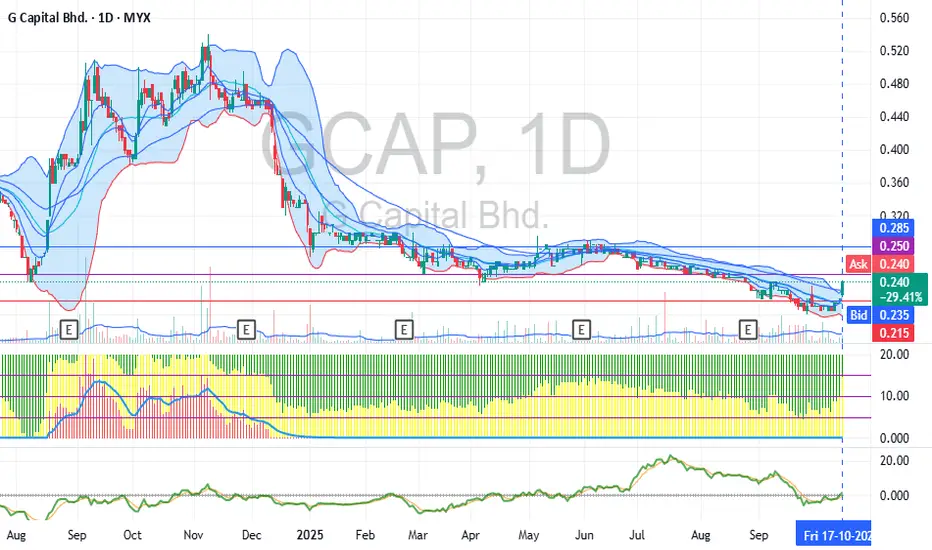
Started to increaseIf the screener and the indicator were right, the trend would change to mark up and will change the trend to an uptrend. Follow the trading plan that I have done.
G Capital Bhd.
No trades
−0.015 MYR
−13.88 M MYR
19.50 M MYR
296.78 M
About G Capital Bhd.
Sector
Industry
Website
Headquarters
Kuala Lumpur
Founded
1995
Identifiers
2
ISIN MYL7676OO009
G Capital Bhd. is an investment holding company, which engages in the provision of management consultancy services. It operates through the following segments: Transportation, Small Hydropower, Solarpower and Energy Efficiencies, Water, and Investment Holding and Others. The Transportation segment refers to the chartering of fleet of land-based transportation assets and specialty vehicles. The company was founded on January 10, 1995, and is headquartered in Kuala Lumpur, Malaysia.
Related stocks
gcapital will retrace at 0.618 and reboundcurrently wave 2, abc correction, will make major wave 3 soon

GCAP WLabout time to Burse! GCAP one of my fav counter regarding Renewable Energy.
lets ride the trendline together. haha

GCAP VCP DEVELOPMENTGCAP VCP developed for 63 days with 4 contraction below:
C1: ~41%
C2: ~20%
C3: ~14%
C4: ~4%
Volume seem to be very dry since mid of December. Will it attack soon?
Immediate support at 0.840 with only 5% risk.
Disclaimer:
The content provided is my personal experience sharing through technical a


GCAP: Ready to go up?GCAP manage to closed with a bull candle today with a consistent sign of an uptrend. From the chart, we can also see a very nice normal bullish divergent. I'm expecting Gcap to fly higher and higher in the next day forward to test the next resistant level for the 2nd time.
TAYOR!
Trend AnalysisIn the analysis of Fibonacci landscape, the most important level to monitor actually is the 50% line and yet it is the most overlooked one. Just like any sport game, the middle of the playing field normally is the first line of defense and an indication that which side is controlling the game. If it


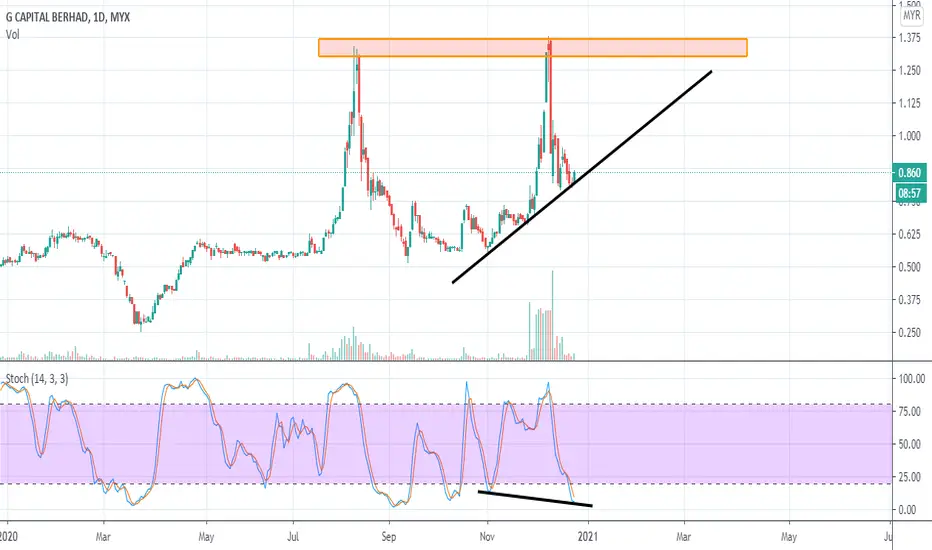
Bullish BreakoutGCAP has broke ATH in 2003 after meeting Fibonacci target level 2.618 at 1.295. The share was then enormously dipped to key support at 0.52 and bounce off this level. In our view, the trend is still Bullish. The price has recently broke above a range bound between 0.55 to 0.75. The share is likely

See all ideas
Summarizing what the indicators are suggesting.
Oscillators
Neutral
SellBuy
Strong sellStrong buy
Strong sellSellNeutralBuyStrong buy
Oscillators
Neutral
SellBuy
Strong sellStrong buy
Strong sellSellNeutralBuyStrong buy
Summary
Neutral
SellBuy
Strong sellStrong buy
Strong sellSellNeutralBuyStrong buy
Summary
Neutral
SellBuy
Strong sellStrong buy
Strong sellSellNeutralBuyStrong buy
Summary
Neutral
SellBuy
Strong sellStrong buy
Strong sellSellNeutralBuyStrong buy
Moving Averages
Neutral
SellBuy
Strong sellStrong buy
Strong sellSellNeutralBuyStrong buy
Moving Averages
Neutral
SellBuy
Strong sellStrong buy
Strong sellSellNeutralBuyStrong buy
Displays a symbol's price movements over previous years to identify recurring trends.
Frequently Asked Questions
The current price of GCAP is 0.200 MYR — it hasn't changed in the past 24 hours. Watch G Capital Bhd. stock price performance more closely on the chart.
Depending on the exchange, the stock ticker may vary. For instance, on MYX exchange G Capital Bhd. stocks are traded under the ticker GCAP.
GCAP stock has fallen by −2.44% compared to the previous week, the month change is a −13.04% fall, over the last year G Capital Bhd. has showed a −33.33% decrease.
GCAP reached its all-time high on Dec 8, 2020 with the price of 1.380 MYR, and its all-time low was 0.050 MYR and was reached on Oct 9, 2008. View more price dynamics on GCAP chart.
See other stocks reaching their highest and lowest prices.
See other stocks reaching their highest and lowest prices.
GCAP stock is 0.00% volatile and has beta coefficient of −0.59. Track G Capital Bhd. stock price on the chart and check out the list of the most volatile stocks — is G Capital Bhd. there?
Yes, you can track G Capital Bhd. financials in yearly and quarterly reports right on TradingView.
GCAP net income for the last quarter is 2.90 M MYR, while the quarter before that showed −1.68 M MYR of net income which accounts for 272.61% change. Track more G Capital Bhd. financial stats to get the full picture.
No, GCAP doesn't pay any dividends to its shareholders. But don't worry, we've prepared a list of high-dividend stocks for you.
As of Jan 6, 2026, the company has 33 employees. See our rating of the largest employees — is G Capital Bhd. on this list?
EBITDA measures a company's operating performance, its growth signifies an improvement in the efficiency of a company. G Capital Bhd. EBITDA is 4.01 M MYR, and current EBITDA margin is −1.09%. See more stats in G Capital Bhd. financial statements.
Like other stocks, GCAP shares are traded on stock exchanges, e.g. Nasdaq, Nyse, Euronext, and the easiest way to buy them is through an online stock broker. To do this, you need to open an account and follow a broker's procedures, then start trading. You can trade G Capital Bhd. stock right from TradingView charts — choose your broker and connect to your account.
Investing in stocks requires a comprehensive research: you should carefully study all the available data, e.g. company's financials, related news, and its technical analysis. So G Capital Bhd. technincal analysis shows the sell today, and its 1 week rating is sell. Since market conditions are prone to changes, it's worth looking a bit further into the future — according to the 1 month rating G Capital Bhd. stock shows the strong sell signal. See more of G Capital Bhd. technicals for a more comprehensive analysis.
If you're still not sure, try looking for inspiration in our curated watchlists.
If you're still not sure, try looking for inspiration in our curated watchlists.