MNHLDG TO CONTINUE MARK UPMy previous, last entry for MNHLDG got knocked out
*pls refer to the link
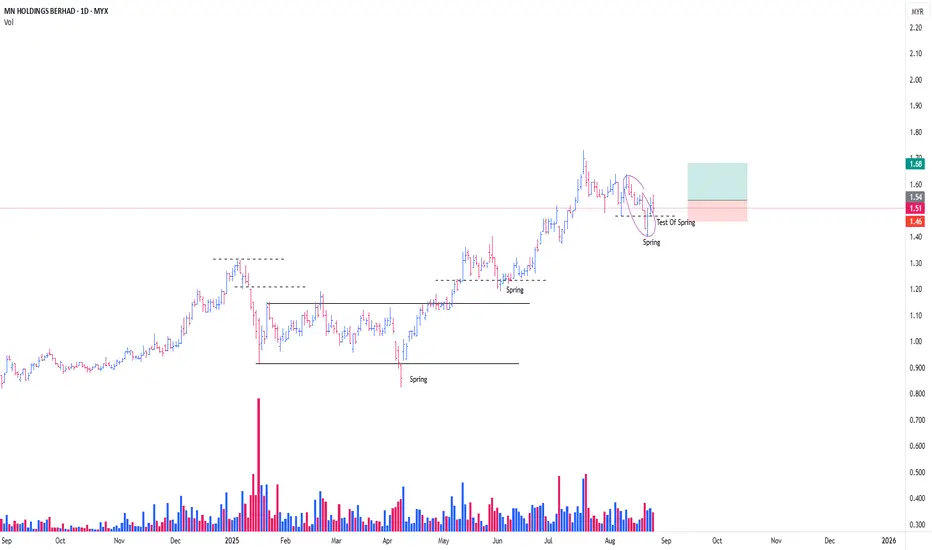
This is my new position for MNHLDG
In view of Local Spring Formation, along with Schematic #2 of SpringBoard (purple colored circle)
- i initiated the 1st position @ 22/8/25 (RM 1.51)
I added another position @ 25/8/25
Next report date
—
Report period
—
EPS estimate
—
Revenue estimate
—
0.09 MYR
48.22 M MYR
535.43 M MYR
359.73 M
About MN Holdings Bhd.
Sector
Industry
CEO
Eng Keat Toh
Website
Headquarters
Subang Jaya
Founded
2007
ISIN
MYQ0245OO009
FIGI
BBG016NT9N06
MN Holdings Bhd. engages in the provision of infrastructure utilities, construction services, and solutions. It operates through the following segments: Underground Utilities Engineering, Substation Engineering, and Investment Holding. The Underground Utilities Engineering segment focuses on the provision of underground utilities engineering services and solutions. The Substation Engineering segment is involved in the provision of substation engineering services and solutions, and trading and supplying. The Investment Holding segment refers to the provision of investment holding and management services. The company was founded in 2007 and is headquartered in Subang Jaya, Malaysia.
Related stocks
MNHLDG CONTINUE MARKING UPThis is a continuation from my previous entry
**Refer link
Referring to the Red Box, I see it as a Stepping Stone (SS) , a mere temporary stop centre,
before continuing marking up from previous Trading Range (Red Arc Line).
My hypothesis is that, this box are forming a mini Trading Range ,

MNHLDG GOING TO CONT MARK UPI maintained my previous thesis for MNHLDG
**please refer to my previous
Just need an addition, for the formation of new 'Local Spring' *black color word
i was knocked out on last position for this
market environment dragged MNHDLG despite with a positive surrpise earning
Based on Spring S

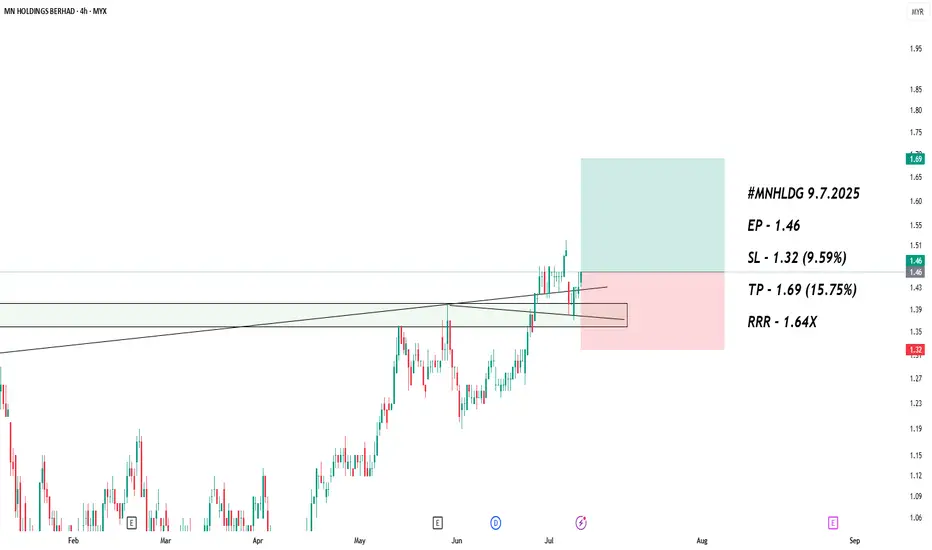
MNHLDG 4H Chart Analysis & Trading Plan SummaryBased on the 4-hour TradingView chart for MNHLDG, the stock is currently trading near RM1.30 and showing signs of attempting a retest towards its previous high near RM1.40. However, looking at the overall setup, we anticipate a possible short-term pullback before any potential breakout occurs.
Key

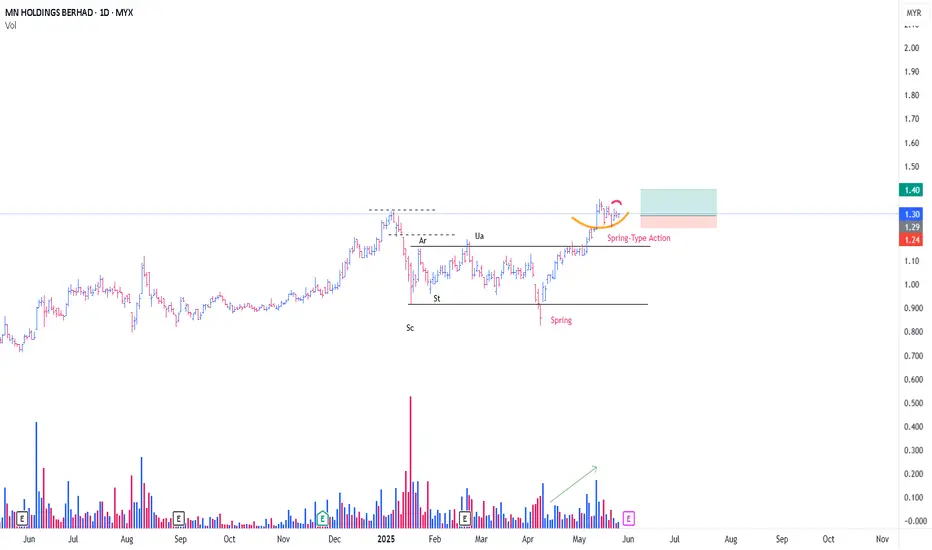
MNHLDG CONT TO MARK UPA rare schematic, of Type #1 Accmulation
This is a Power Play
-Since Spring, price soaring high with influx of demand (Green Arrow)
With a Possiblity of Feather's Weight ( Yellow LIne)
-Position initiated @ Spring Board (Red Line)
-Plus with additional Local Spring Type Action
Posit


MNHLDG - Which sentiment is stronger, Bullish or Bearish?The chart presents two potential outcomes depending on the current market sentiment. The candle is below the Kumo, suggesting bearish momentum, but both bullish and bearish scenarios are possible:
N wave with E, V, N & NT projection.
The price is below the Kumo, indicating a bearish trend. However,

MNHLDG swing tradeMultiple edge trading area as per screenshot
Buy on price increase and volume increase previous 2 trading days candle

See all ideas
Summarizing what the indicators are suggesting.
Neutral
SellBuy
Strong sellStrong buy
Strong sellSellNeutralBuyStrong buy
Neutral
SellBuy
Strong sellStrong buy
Strong sellSellNeutralBuyStrong buy
Neutral
SellBuy
Strong sellStrong buy
Strong sellSellNeutralBuyStrong buy
An aggregate view of professional's ratings.
Neutral
SellBuy
Strong sellStrong buy
Strong sellSellNeutralBuyStrong buy
Neutral
SellBuy
Strong sellStrong buy
Strong sellSellNeutralBuyStrong buy
Neutral
SellBuy
Strong sellStrong buy
Strong sellSellNeutralBuyStrong buy
Displays a symbol's price movements over previous years to identify recurring trends.
Frequently Asked Questions
The current price of MNHLDG is 1.85 MYR — it hasn't changed in the past 24 hours. Watch MN Holdings Bhd. stock price performance more closely on the chart.
Depending on the exchange, the stock ticker may vary. For instance, on MYX exchange MN Holdings Bhd. stocks are traded under the ticker MNHLDG.
MNHLDG stock has risen by 7.47% compared to the previous week, the month change is a 18.35% rise, over the last year MN Holdings Bhd. has showed a 97.86% increase.
We've gathered analysts' opinions on MN Holdings Bhd. future price: according to them, MNHLDG price has a max estimate of 2.20 MYR and a min estimate of 1.92 MYR. Watch MNHLDG chart and read a more detailed MN Holdings Bhd. stock forecast: see what analysts think of MN Holdings Bhd. and suggest that you do with its stocks.
MNHLDG reached its all-time high on Sep 25, 2025 with the price of 1.92 MYR, and its all-time low was 0.20 MYR and was reached on May 10, 2022. View more price dynamics on MNHLDG chart.
See other stocks reaching their highest and lowest prices.
See other stocks reaching their highest and lowest prices.
MNHLDG stock is 2.72% volatile and has beta coefficient of 1.97. Track MN Holdings Bhd. stock price on the chart and check out the list of the most volatile stocks — is MN Holdings Bhd. there?
Yes, you can track MN Holdings Bhd. financials in yearly and quarterly reports right on TradingView.
MN Holdings Bhd. is going to release the next earnings report on Dec 2, 2025. Keep track of upcoming events with our Earnings Calendar.
MN Holdings Bhd. revenue for the last quarter amounts to 179.40 M MYR, despite the estimated figure of 73.40 M MYR. In the next quarter, revenue is expected to reach 103.10 M MYR.
MNHLDG net income for the last quarter is 12.06 M MYR, while the quarter before that showed 16.50 M MYR of net income which accounts for −26.86% change. Track more MN Holdings Bhd. financial stats to get the full picture.
EBITDA measures a company's operating performance, its growth signifies an improvement in the efficiency of a company. MN Holdings Bhd. EBITDA is 75.55 M MYR, and current EBITDA margin is 14.11%. See more stats in MN Holdings Bhd. financial statements.
Like other stocks, MNHLDG shares are traded on stock exchanges, e.g. Nasdaq, Nyse, Euronext, and the easiest way to buy them is through an online stock broker. To do this, you need to open an account and follow a broker's procedures, then start trading. You can trade MN Holdings Bhd. stock right from TradingView charts — choose your broker and connect to your account.
Investing in stocks requires a comprehensive research: you should carefully study all the available data, e.g. company's financials, related news, and its technical analysis. So MN Holdings Bhd. technincal analysis shows the buy rating today, and its 1 week rating is buy. Since market conditions are prone to changes, it's worth looking a bit further into the future — according to the 1 month rating MN Holdings Bhd. stock shows the strong buy signal. See more of MN Holdings Bhd. technicals for a more comprehensive analysis.
If you're still not sure, try looking for inspiration in our curated watchlists.
If you're still not sure, try looking for inspiration in our curated watchlists.