AAPL....What's next....The Good
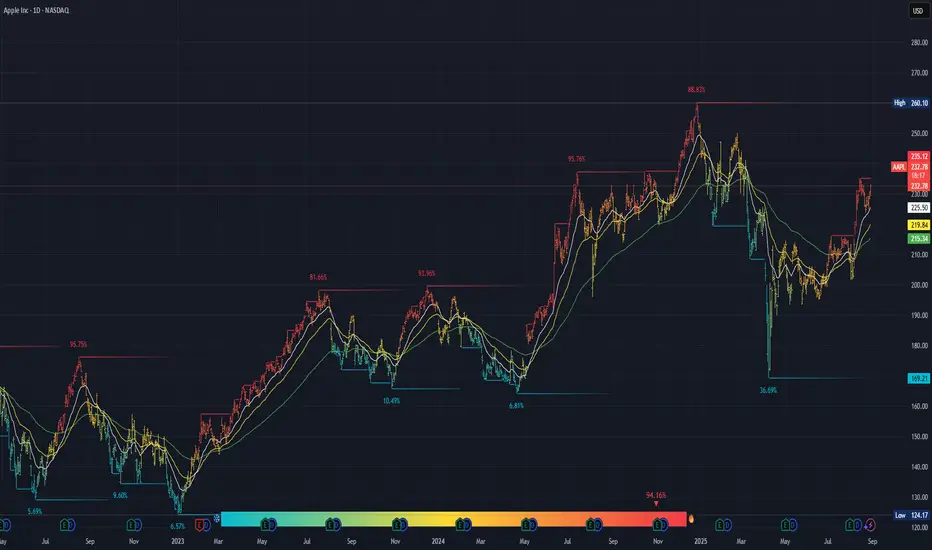
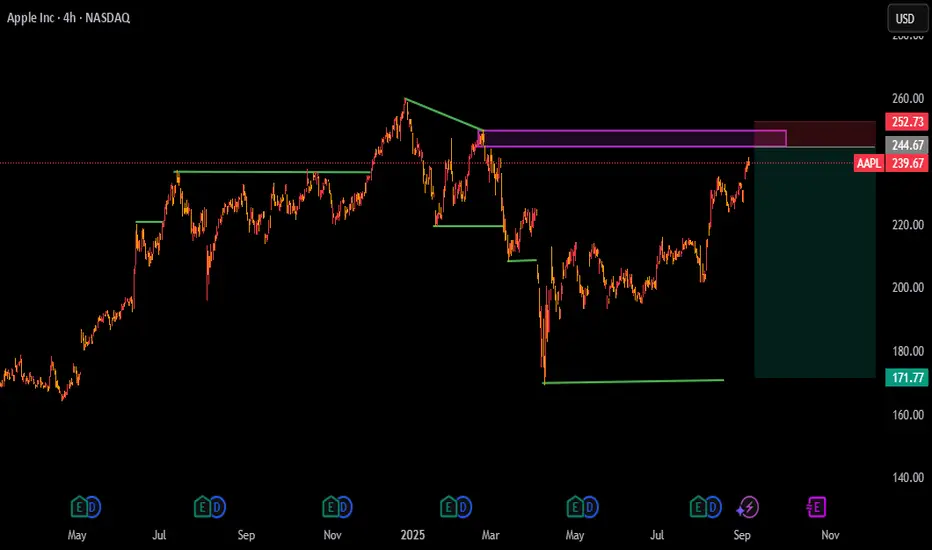
Recovery off lows: That sharp reversal from ~$165 back above $230 shows strong buyer support. The +36% bounce (highlighted on chart) is impressive.
Trend alignment: Shorter EMAs are stacked above longer ones again, suggesting bullish momentum is back.
Volume: Decent participation on the rebound, not a weak drift higher.
The Bad
Heavy resistance overhead: $235–$240 is a supply zone. Price has stalled there multiple times, and you can see past rejection points at 235, 260. This area must be cleared for continuation.
Lower high risk: Unless AAPL breaks above $260, it could be setting up a “lower high” compared to past peaks (Feb & July 2024).
Valuation risk: Apple isn’t cheap right now. Macro risk (Fed cuts, consumer spending slowdown, China supply chain issues) could make it more vulnerable than Nvidia/semis.
The Ugly
Previous deep drawdowns: AAPL saw nearly a -36% correction not long ago. That’s a reminder this is not a low-risk hold anymore. One earnings miss or weak iPhone cycle could re-trigger that.
Crowded trade: Everyone owns Apple. Hedge funds, ETFs, retail. If big money rotates out, selling pressure is brutal.
Cost vs. Benefit
Benefit: If Apple breaks $240 convincingly, next stop is likely $260 (prior high). That’s ~12% upside.
Cost: If it fails here and rolls over, you could be looking at a drop back to $215 (near 50-day/200-day confluence) or even $200 (~15% downside).
AAPL trade ideas
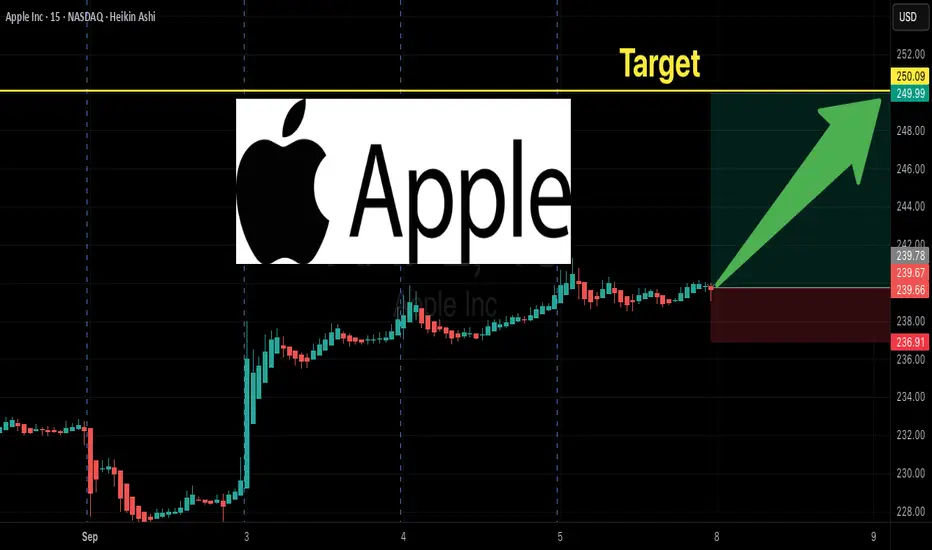
Apple (AAPL) Shares Jump to a Six-Month HighApple (AAPL) Shares Jump to a Six-Month High
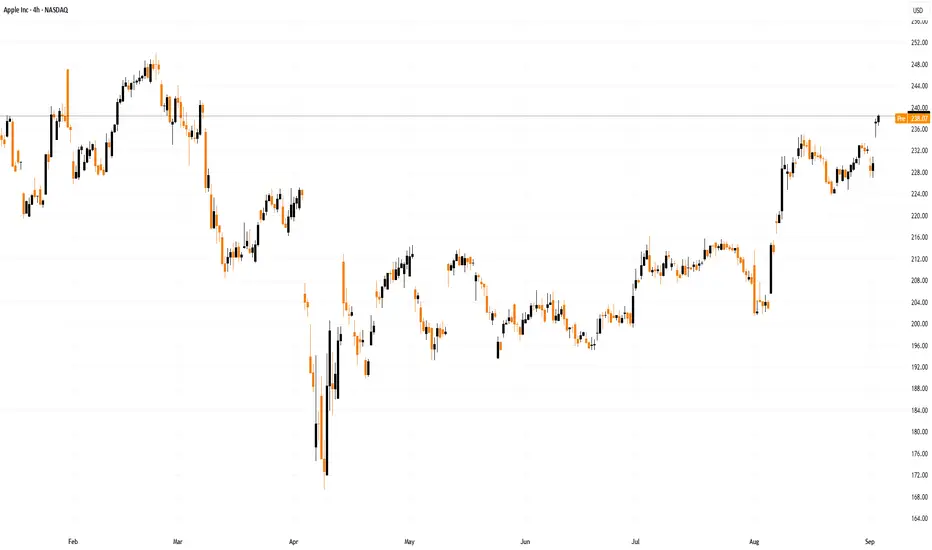
As the AAPL chart shows, yesterday the price rose above $238 – its highest level since early March.
The optimistic sentiment was fuelled by:
→ A court ruling concerning Google, which we reported on yesterday. Apple shares advanced after the court allowed Alphabet to continue paying Apple for preloading Google Search on the iPhone. Bank of America analysts even raised their AAPL price target to $260.
→ The upcoming Apple presentation scheduled for 9 September. Expectations are that the event could unveil the iPhone 17 and new Apple Watch models, which may provide a bullish catalyst.
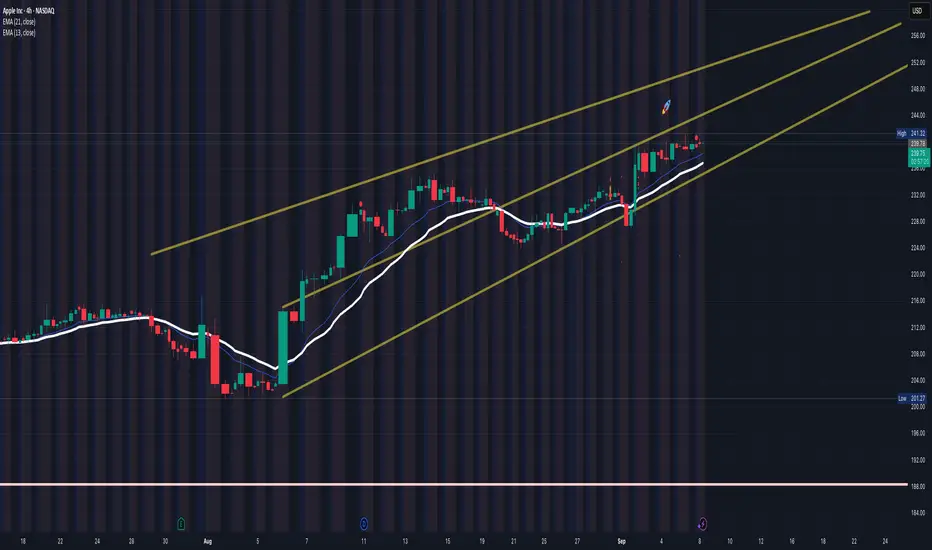
Technical Analysis of Apple (AAPL) Stocks
Analysing the chart in early August, we:
→ identified an ascending channel (shown in blue);
→ noted that, given the aggressive rally (accompanied by bullish gaps) and a strong fundamental backdrop, any corrections were likely to be limited.
Since then:
→ AAPL has moved higher, justifying the expansion of the blue channel;
→ the pullback (marked by an arrow) was minor, as expected, confirming the median line of the expanded channel as support;
→ in the short term, we could identify grounds for a new upward trajectory (shown in orange).
Yesterday’s price action in AAPL:
→ produced a wide bullish gap at the open (which may act as support);
→ broke through the long-term descending trendline (R), which had been acting as resistance;
→ indicated that the $235 level (around the August high) now functions as support.
Within this context, we could assume that:
→ in the short term, AAPL may maintain its upward trajectory within the orange channel;
→ in the longer term, bulls may target the upper boundary of the blue channel – located near the psychological $250 mark. Reaching this level could trigger stronger selling pressure.
In the event of a significant correction (for example, due to disappointment with new product launches), potential support levels could include:
→ the median of the blue channel;
→ the trendline R.
This article represents the opinion of the Companies operating under the FXOpen brand only. It is not to be construed as an offer, solicitation, or recommendation with respect to products and services provided by the Companies operating under the FXOpen brand, nor is it to be considered financial advice.
APPLE: Will Start Falling! Here is Why:
The price of APPLE will most likely collapse soon enough, due to the supply beginning to exceed demand which we can see by looking at the chart of the pair.
Disclosure: I am part of Trade Nation's Influencer program and receive a monthly fee for using their TradingView charts in my analysis.
❤️ Please, support our work with like & comment! ❤️
AAPL | Money will Rotate into this MEGA CAP | LONGApple, Inc. engages in the design, manufacture, and sale of smartphones, personal computers, tablets, wearables and accessories, and other varieties of related services. It operates through the following geographical segments: Americas, Europe, Greater China, Japan, and Rest of Asia Pacific. The Americas segment includes North and South America. The Europe segment consists of European countries, as well as India, the Middle East, and Africa. The Greater China segment comprises China, Hong Kong, and Taiwan. The Rest of Asia Pacific segment includes Australia and Asian countries. Its products and services include iPhone, Mac, iPad, AirPods, Apple TV, Apple Watch, Beats products, AppleCare, iCloud, digital content stores, streaming, and licensing services. The company was founded by Steven Paul Jobs, Ronald Gerald Wayne, and Stephen G. Wozniak in April 1976 and is headquartered in Cupertino, CA.
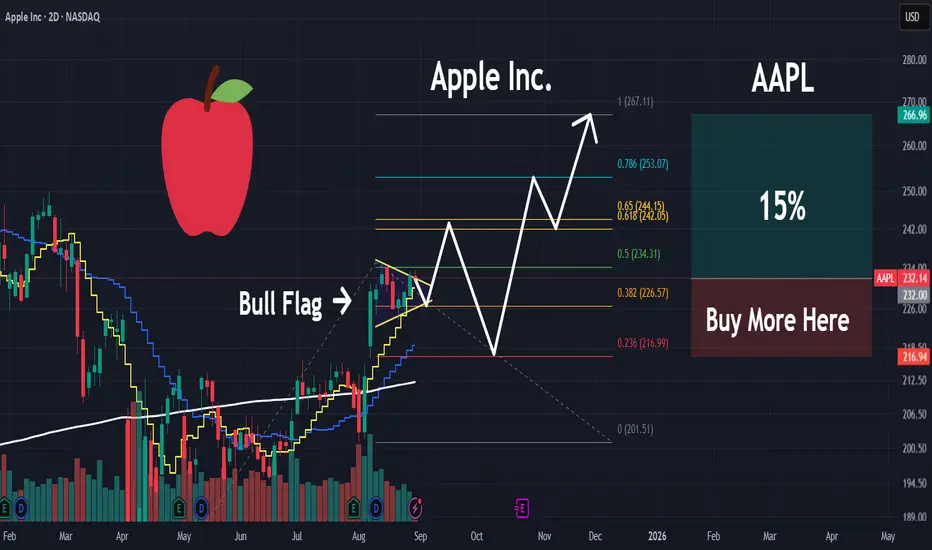
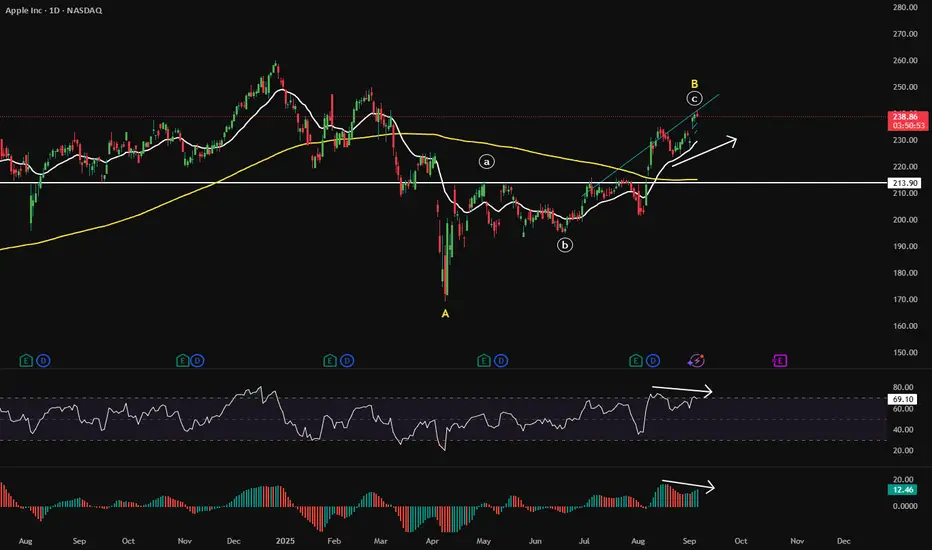
Could be a good month for Apple. Apple has potentially broken out of a recent flag pattern. While I typically don't use hourly charts, in this case, it does present the situation more clearly. The next target price will be 260 USD, although I plan to continue holding my long position until it reaches over $270. Since the predicted Golden Cross, Apple has been very bullish. With increased trading activity.
Forming lack of market confidence in AI market overall and its associated potential bubble, Apple remains a well-rounded stock to hold. We could see further rewards, especially since they have not yet heavily invested in the AI market and are not as reliant on its future revenue and value. So could be bubble protected to some extent, if it pops.
With September approaching and the "sell in May and walk away" period coming to an end, I expect trading volumes to increase and a rebalancing of portfolios, with capital likely flowing back into Apple. Additionally, Apple has its September launch event coming up, and expectations are high. Overall, Apple looks promising for potential returns in September. Although Q3 numbers could be bearish given the current market climate, Apple appears more stable and less bubble-like than other stocks in the Magnificent Seven...
As previous too much fear regarding Apple for the last few quarters. Which presented some really good entry points and good returns.

APPL Breakout Play: Ride Momentum w/ $250 Calls
# 🚀 APPL Swing Trade Setup (2025-09-07)
**Bias:** 🔥 Bullish (multi-timeframe momentum confirmed)
**Conviction:** ⭐⭐⭐⭐ (75%)
### 📊 Key Takeaways
* ✅ Daily RSI = 73.3 → strong momentum
* ✅ Multi-timeframe alignment → bullish trend continuation
* ⚠️ Volume = \~1.0x avg → breakout needs confirmation
* ⚖️ Options flow = neutral (C/P \~1.0) → no big institutional push
* 🌐 VIX \~15 → low vol = cheap calls
---
### 🎯 Trade Plan
* **Instrument:** \$APPL
* **Direction:** CALL (single-leg)
* **Strike:** \$250
* **Expiry:** 2025-09-19
* **Entry Price:** 0.78 (ask)
* **Profit Target:** 1.56 (≈100% gain)
* **Stop Loss:** 0.47 (\~40% risk)
* **Size:** 1 contract (adjust to 2% account risk)
* **Entry Timing:** Open (or breakout > \$241.5 + volume)
---
### 🧠 Rationale
* \$250 strike = liquid (OI 36k+) & balanced delta/liquidity
* Low VIX keeps theta drag manageable (12 DTE)
* Upside continuation likely toward \$246–\$250 zone
* Defined risk/reward w/ simple naked call
---
### ⚠️ Risks
* ❌ Failed breakout → fast premium decay
* ⏳ Time decay accelerates after 7–8 DTE
* 📰 Macro/news shocks = whipsaw risk
---
## 📌 TRADE DETAILS (JSON)
```json
{
"instrument": "APPL",
"direction": "call",
"strike": 250.0,
"expiry": "2025-09-19",
"confidence": 0.75,
"profit_target": 1.56,
"stop_loss": 0.47,
"size": 1,
"entry_price": 0.78,
"entry_timing": "open",
"signal_publish_time": "2025-09-07 13:19:26 EDT"
}
```
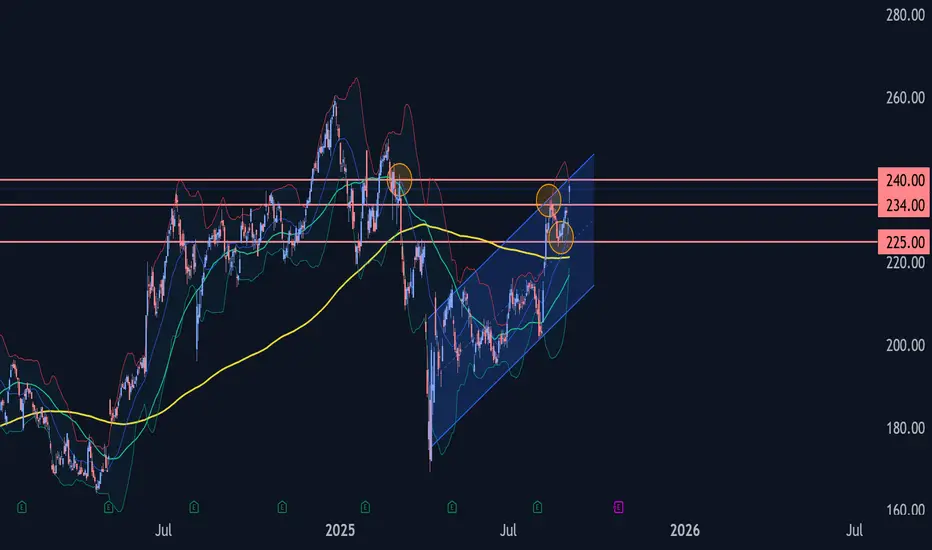
Apple Wave Analysis – 3 September 2025- Apple broke the resistance level 234.00
- Likely to rise to resistance level 240.00
Apple recently broke with the upward gap above the resistance level 234.00, which stopped the previous minor impulse wave 1 at the start of August.
The price earlier reversed from the support level 225.00 (former strong resistance from March and April).
Given the multi-month uptrend, Apple can be expected to rise to the next resistance level 240.00, former resistance from the start of March.
A New iPhone Is Coming. Should You Upgrade or Just Fix Your Old This year, your best iPhone upgrade might be a fresh battery, a clean screen and some new software tricks. Plus, the extra cash you get to keep in your pocket.
AAPL SELL 249.7On the daily chart, AAPL is fluctuating upward. Currently, we can pay attention to the resistance near 249.7 above. This position is a short-selling position for a potential bearish bat pattern. At the same time, this position is in the previous supply area.

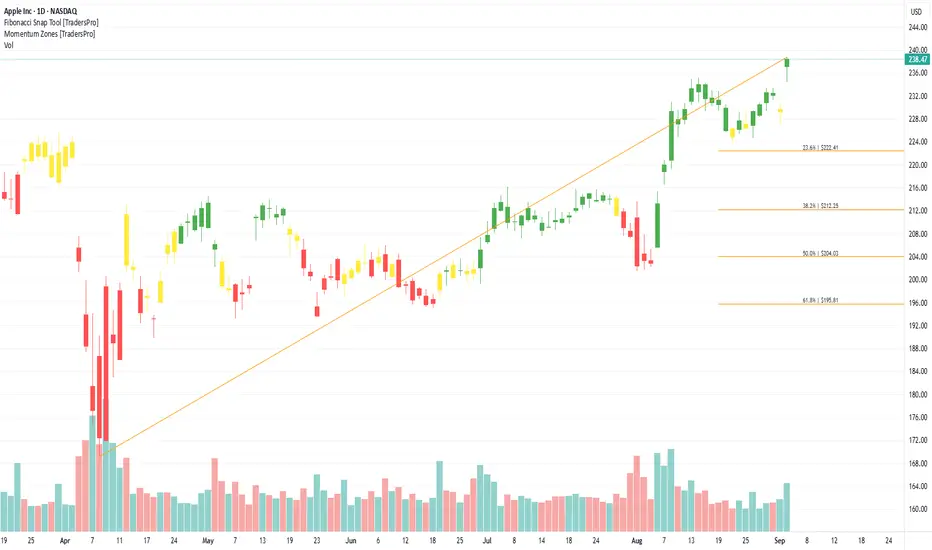
Apple Inc. (AAPL) Thrives on iPhone and Service SalesApple Inc. (AAPL) is one of the world’s most valuable technology companies, known for its iconic products like the iPhone, iPad, Mac, Apple Watch, and AirPods. The company also generates strong recurring revenue through services such as the App Store, Apple Music, and iCloud. Apple’s growth is fueled by constant product innovation, a loyal global customer base, and expanding services that complement its hardware ecosystem.
On the chart, a confirmation bar with rising volume shows bullish strength. The price has entered the momentum zone by moving above the .236 Fibonacci level. A trailing stop can be set just below this Fibonacci line using the Fibonacci snap tool, helping traders secure profits while allowing room for more upside potential.
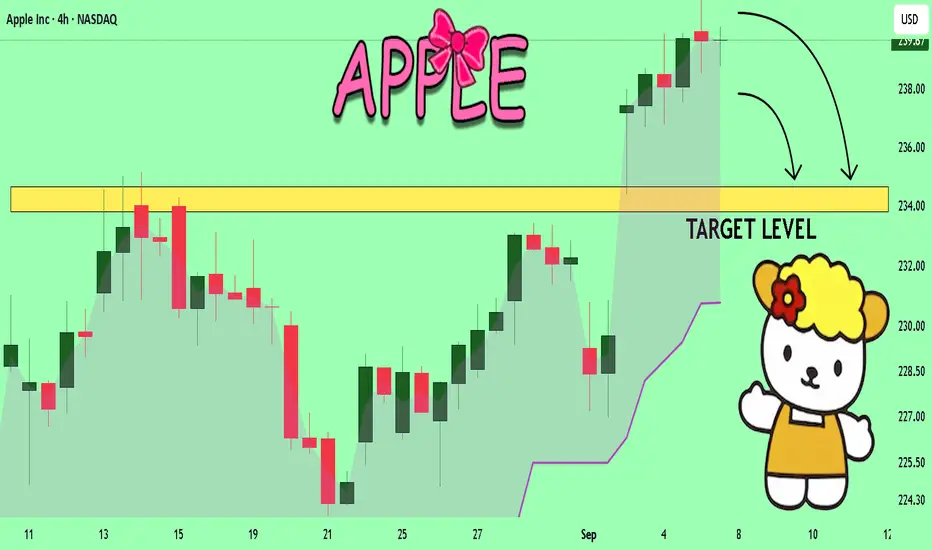
APPLE Massive Short! SELL!
My dear friends,
Please, find my technical outlook for APPLE below:
The price is coiling around a solid key level - 239.67
Bias - Bearish
Technical Indicators: Pivot Points High anticipates a potential price reversal.
Super trend shows a clear sell, giving a perfect indicators' convergence.
Goal - 234.66
About Used Indicators:
The pivot point itself is simply the average of the high, low and closing prices from the previous trading day.
Disclosure: I am part of Trade Nation's Influencer program and receive a monthly fee for using their TradingView charts in my analysis.
———————————
WISH YOU ALL LUCK
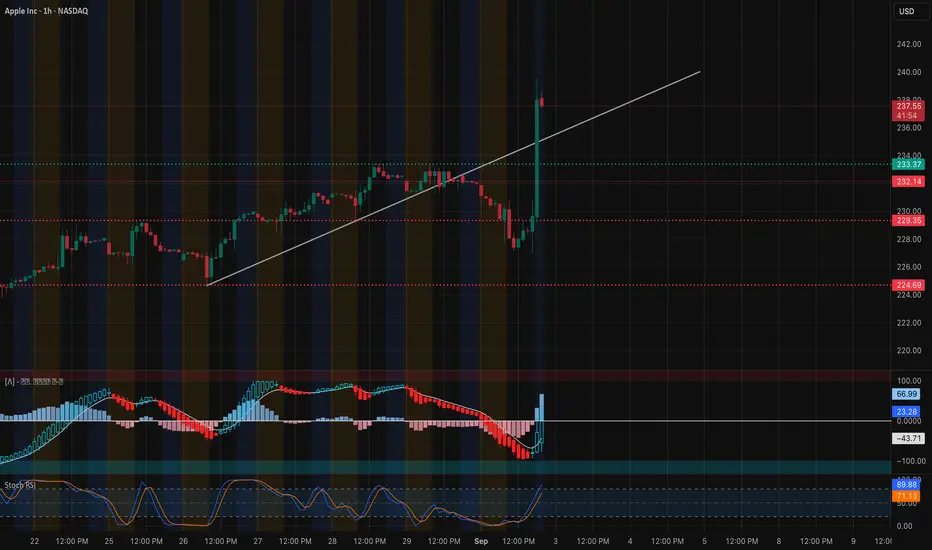
AAPL Technical Analysis-Sep. 3Apple exploded higher off the 227.5 – 228 support zone, staging a sharp rally that broke through short-term resistance and reclaimed momentum. The move was confirmed by a strong MACD bullish cross with expanding histogram, and Stoch RSI pushing deep into overbought, signaling strong momentum but also potential near-term exhaustion.
Price is now pressing into 237–238, a heavy resistance cluster from both prior supply and options positioning. This zone represents the immediate test for bulls. A clean breakout would open the path toward 240, and potentially 242.5, where the next resistance bands align.
On the downside, 232.5 – 233 is now first support. Below that, 230 and then 227.5 serve as key demand levels. Losing those would negate today’s breakout momentum and shift control back to sellers.
🔍 Options / GEX Confirmation
* Resistance:
* 237 (20% GEX concentration) → current rejection zone.
* 240 – 242.5 → stacked resistance confirmed by call positioning.
* Support:
* 233 – 232.5 (3rd call wall / structural support) → bulls must defend this to keep momentum.
* 230 → strong pivot zone.
* 227.5 → deep support and base of the breakout.
Options flow confirms exactly what the chart is showing: 237 is a key battleground, while 240–242.5 remains the ceiling until bulls prove control.
🎯 Trade Scenarios
* Bullish: Hold above 233 and break through 237 with volume → targets 240, then 242.5.
* Bearish: Failure at 237 and a drop back under 233 → downside targets 230 → 227.5.
Apple’s rebound was explosive, but the 237–238 zone is the real test. If buyers can push through, upside momentum extends toward 240–242.5. If not, watch for a pullback to 233 or even 230 before attempting higher.
AAPL LongBroader Market Structure (AAPL 1H):
The broader structure has shifted bullish after a strong recovery from the lows near $223.78, which marked the prior Change of Character (CHoCH) to the downside. Since then, price has reclaimed higher levels and printed a clear Break of Structure (BOS) above $241.32, confirming bullish continuation. This transition suggests sellers have lost control and the market is now favoring higher highs unless a key demand zone is broken.
Supply and Demand Analysis:
The demand zone between $237–239 is fresh, formed after buyers stepped in with strength and drove price impulsively higher. This makes it a strong candidate for a retest and bounce. The deeper demand around $228–230 remains significant since buyers created a clean rally from that base, but given that it has been tapped once already, it is somewhat weaker than the higher zone. On the supply side, there’s no immediate strong resistance overhead until new highs are formed, giving bulls open space to extend the move.
Price Action Within Marked Region:
At present, price is consolidating near the top after breaking higher, and the projection suggests a pullback into the $237–239 demand zone before resuming upside. The candles are showing reduced momentum after the breakout, hinting that a corrective retracement is likely before continuation.
Current Trade Bias & Outlook:
The bias is bullish, with the expectation that price will dip into demand before resuming higher toward $245–248. The invalidation level for this bullish outlook would be a break below $228, which would erase the recent BOS and tilt structure bearish again.
Momentum & Candlestick Behavior:
Momentum favors buyers, as seen in the impulsive move that cleared prior highs. However, current candles show signs of slowing, which supports the idea of a short-term pullback before buyers re-enter. No reversal patterns have formed yet at the highs, so the structure still supports continuation.

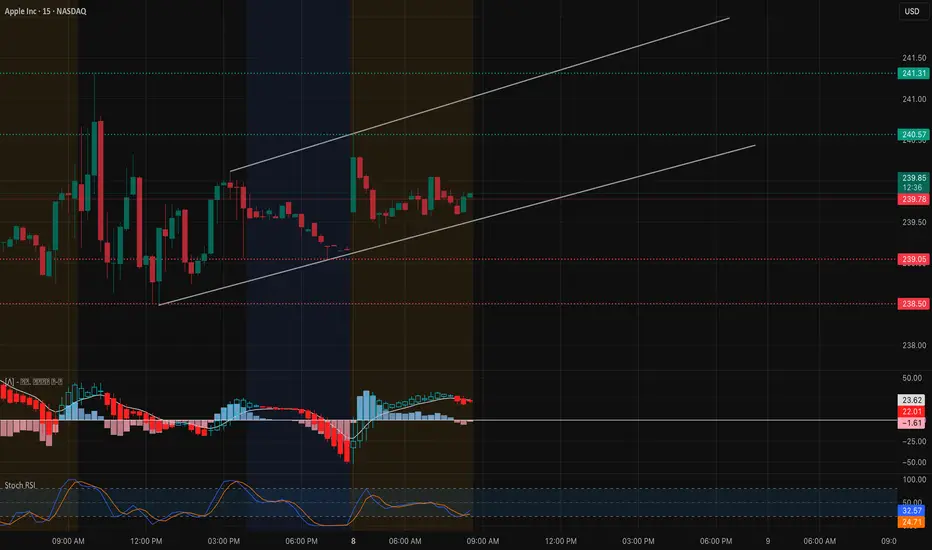
AAPL Market Preview for Monday, September 8Price Action & Market Structure
* AAPL is trading around 239.8, consolidating after multiple rejections near 240.5–241.3.
* Price is still within a rising channel, but short-term momentum is softening.
* Structure remains constructive as long as price holds 239–238.5 support.
Key Levels
* Resistance (Upside Caps):
* 240.6–241.3 → Immediate resistance.
* 245.0 → 2nd Call Wall resistance.
* 247.5–250 → Heavy Gamma resistance zone.
* Support (Downside Floors):
* 239.0 → Key intraday support.
* 238.0–238.5 → Secondary support buffer.
* 232.5–227.5 → HVL + Put Support anchor.
Options Sentiment (GEX & IV)
* GEX: Tilted slightly bullish, with Calls outweighing Puts.
* IVR: Low at 11.6, showing options are pricing muted moves.
* Gamma Walls:
* 245–250 = Strong upside cap.
* 232.5–227.5 = Strong downside support zone.
Indicators
* MACD (15m): Slight bearish momentum showing, indicating short-term consolidation.
* Stoch RSI: Resetting near oversold, which could allow another push higher if buyers step in.
Scenarios for Today
Bullish Case (if 239 holds):
* Hold above 239.0, push through 240.6–241.3.
* Targets → 243.0 → 245.0, with possible extension to 247.5–250 Gamma Wall.
Bearish Case (if 239 breaks):
* Lose 239.0, test 238.0–238.5.
* If weakness accelerates, deeper pullback toward 235.0 → 232.5 HVL zone.
Trading Thoughts
* Longs: Favor dip entries near 239.0–238.5 with bounce confirmation, targeting 241–243.
* Shorts: Fade rejection at 241–243, stops above 244.5.
* Stops:
* Longs → below 238.0.
* Shorts → above 244.5.
Summary
AAPL sits at a pivotal 239–240 zone. Holding this support opens upside to 243–245, with Gamma resistance capping higher at 247.5–250. If 239 fails, expect a quick dip into 238–235, with stronger support at 232.5–227.5. Low IVR suggests controlled moves, but GEX positioning favors mild bullish bias unless support breaks.
⚠️ This analysis is for educational purposes only and not financial advice. Always manage risk properly.
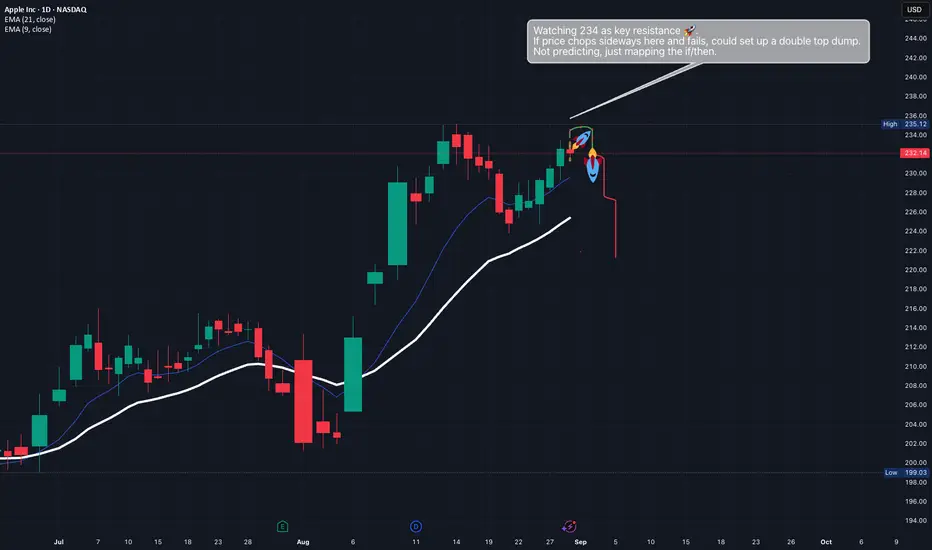
Apple September SetupSeptember hasn’t been Apple’s friend historically — average return is around –4.5% and over the last 5 years we’ve seen more red than green. Institutions usually use this month to rebalance into Q4, which can weigh on tech.
This year we’ve also got the Sept 9 “Awe Dropping” event (iPhone 17 lineup, Apple Watch updates, maybe AirPods). That’s a clear catalyst, but sometimes it’s “buy the rumor, sell the news.”
Here’s how I’m looking at it:
⬆Bull Scenario (Breakout)
If Apple clears 234 with volume and holds above, bulls could push it higher. Clean breakout = momentum continuation 🚀.
🔄 Sideways Scenario (Chop)
Apple tags 234, stalls, and just chops. No clear trend, just range trading while the market waits for a catalyst .
📉 Bear Scenario (Double Top / Puts)
Apple rejects at 234, goes sideways, then dumps. That would set up a **double top** and open downside risk back toward 219 .
For me → last week wasn’t great P\&L-wise, so I’m focusing on patience this month. Not trying to predict which path plays out, just mapping the if/then so I’m ready.
👉 What’s your bias going into September?
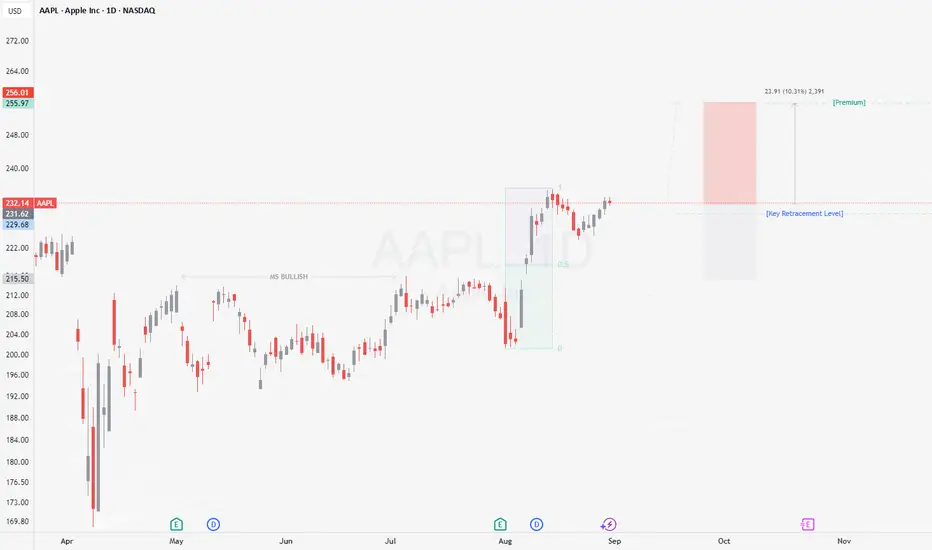
Apple's Bullish Setup: Why Market Weakness is an OpportunityHello, fellow traders. While the broader market is showing some signs of weakness, it's in these moments that the strongest opportunities can arise. Fear in the market can be a gift, offering a chance to enter a fundamentally sound company at a technically sound price. Today, we're looking at Apple ( NASDAQ:AAPL ).
The Fundamental Bedrock
Before we look at the chart, let's remember the 'why'. Apple remains a titan of industry with a fortress-like balance sheet. With the anticipation building for their next generation of products and the relentless, high-margin growth of their Services division (iCloud, App Store, Apple Music), the long-term fundamental picture remains incredibly strong. We are not just buying a ticker; we are looking to partner with a powerhouse.
The Technical Landscape: A Confluence of Signals
The daily chart for AAPL is painting a clear picture for a potential long entry on this pullback.
The Trend is Your Friend: The overall structure is firmly in a "Bull Regime." Our primary goal in such a trend is to find logical places to join it, not fight it.
The August 6th Breakout: Price action decisively broke the previous market structure to the upside on August 6th, signaling a new leg of bullish intent.
The Gap Magnet: This breakout left a small, unfilled price gap in the $215-$216 area. Gaps like this often act as magnets, drawing the price back to fill them before continuing the trend.
Resistance Becomes Support: This same ~$215 level was a prior resistance zone. A pullback to this level would be a classic test of this "polarity" principle, confirming the old ceiling as the new floor.
An Illustrative Trade Plan
Based on this confluence, here is a potential setup that offers a very favorable risk-to-reward ratio.
Style: Long / Buy on Pullback
Entry: Around $215.00
Stop Loss: Around $205.00
Target: Around $252.50, near the prior all-time highs.
Risk/Reward Ratio: Approximately 1 : 3.75
The #limitlessTrader's Perspective
This trade is the essence of patience. The FOMO-driven trader may have bought the top of the August 6th breakout. The disciplined trader waits for the inevitable exhale, allowing the price to come to them at a level where the risk is defined and the potential reward is significant. It is a perfect balance of a strong fundamental story with a patient, logical technical entry.
Disclaimer: This is not financial advice. It is for educational and informational purposes only. Please conduct your own research and manage your risk accordingly.

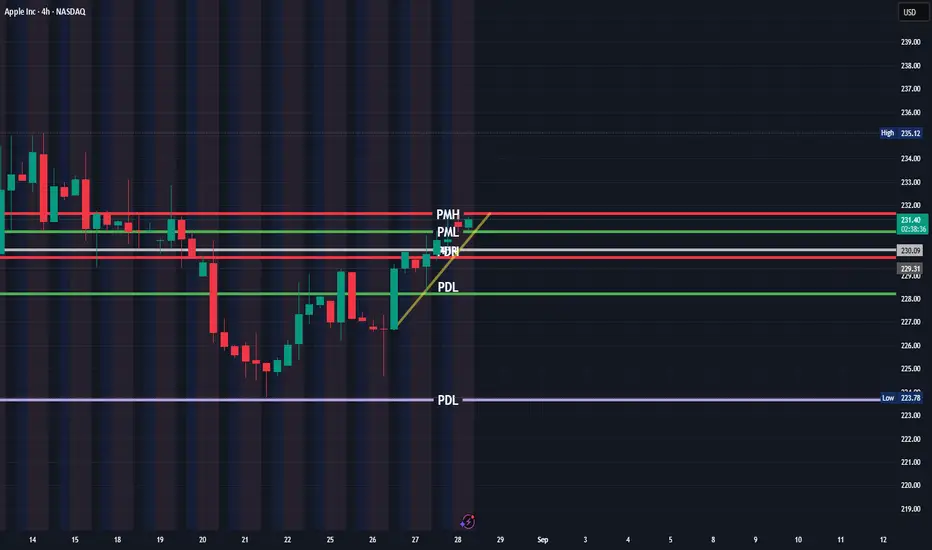
Apple Thoughts
Sellers tried to push it down to 223.81 (PDL) but couldn’t hold it. Buyers stepped in, and now price looks like it wants that 235 level.
On the 4H chart, it’s looking like a double bottom that turned into a bull flag. So far holding EMAs and riding trend clean.
If it breaks under 229 with momentum, I’ll probably chill. But as long as it holds here, I think the move isn’t done yet.
Not advice. Just how I see it today.
What do y’all think? Fakeout setup or clean continuation?
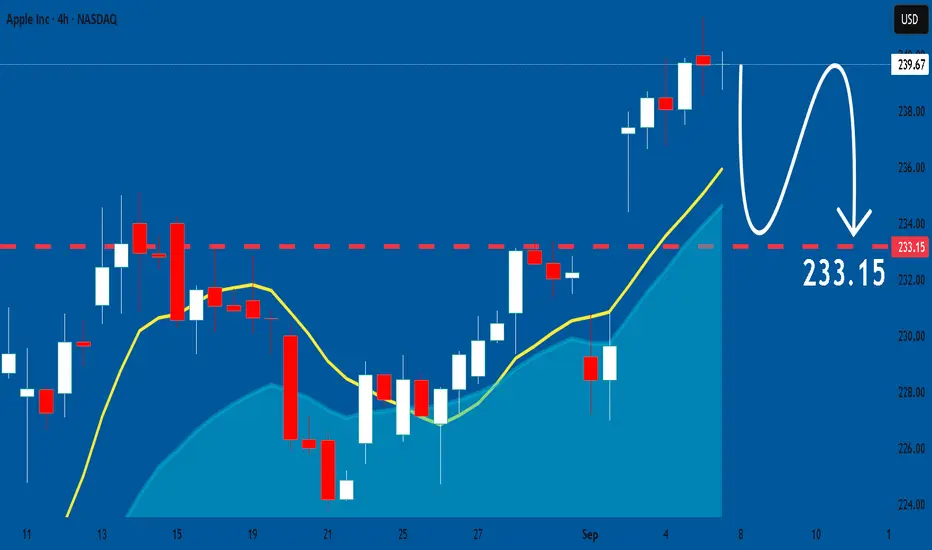
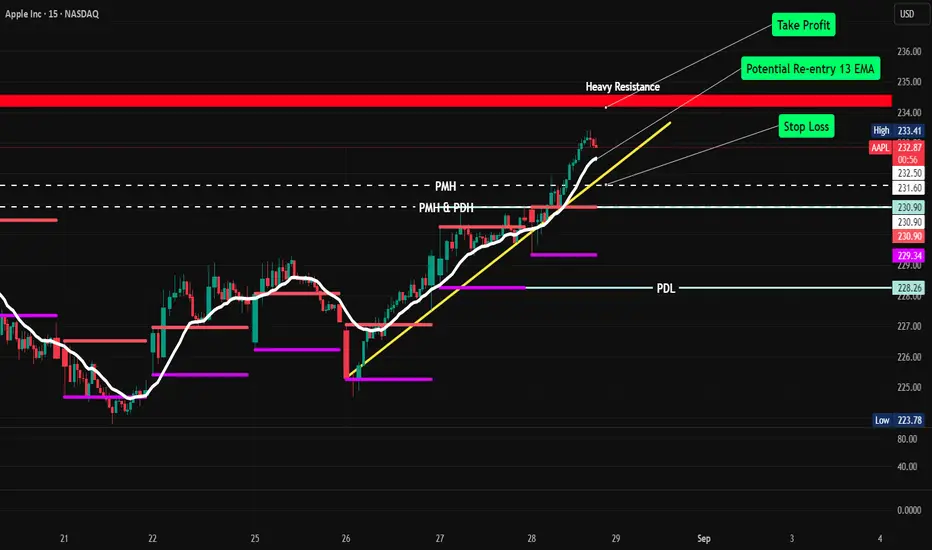
AAPL Re-entry PotentialAPPLE is pulling back to the 13 EMA, if it holds there around 232.51, could be a good Call entry to the heavy resistance area for a T/P around 234.21. Place S/L right underneath the EMA for a tight risk management or at 231.60 at PMH. APPLE has been respecting the 9 and 13 EMA.
AAPL Game Plan: September 8, 2025
Premarket Range:
* High: $240.34 (PMH estimate from chart)
* Low: $239.01(AHL)
* PDH: $241.32
* PDL: $238.49
* VWAP + 13EMA clustered around $239.75–239.85
🟢 BULLISH SCENARIO: Range Break + Squeeze Toward $241.32–243.00
Trigger:
* Strong open above \$240.34 (PMH)
* Price holds above AHH \$239.86
* SPY + NQ support the move
* VIX remains < 16
Setup:
* Long on reclaim of $240.34 or bounce off \$239.86 support flip
* Use tight stop below VWAP or \$239.
Targets:
* TP1: \$241.32 (PDH)
* TP2: \$243.00
* TP3 (Stretch): $248.00 (macro level from wedge top)
Risk:
* False breakout → snap back into range
NEUTRAL SCENARIO: Ping-Pong Between \$239.00 and \$240.34**
Trigger:
* Price stuck inside PM range
* No volume confirmation
* VIX drifting but not spiking
Setup:
* Fade extremes:
* Long near \$239.01–239.20 (AHL + EMA zone)
* Short near \$240.20–240.34 (PMH test)
* Avoid middle zone congestion (\$239.50–239.80)
Targets:
* TP1: \$239.85
* TP2: \$240.30
* TP3: \$238.70 if range breaks down
Risk:
* Breakout trap while fading levels
🔴 BEARISH SCENARIO: Breakdown to \$238.00–236.00
Trigger:
* Break below AHL $239.01 → then PDL \$238.49
* VIX rises > 16
* SPY breaks VWAP / tech turns red
Setup:
* Short on flush through \$238.49 with volume
* Can also short failed reclaim of $239.01 after break
* Keep stop tight above $239.50–239.60
Targets:
* TP1: $237.75
* TP2: $236.00 (major DP level)
* TP3 (Stretch): $228.00 (
AAPLE Inc. High Probale Plummet To Be TriggeredAAPL which has been on a quite an ecstacy in the past few weeks might have its Joy short-lived due to activities its did below. Activities being 'The change of character"
AAPL Sept 5th Playbook
On the 4H chart, Tuesday’s green candle is still holding — looks like a possible bull flag forming. On the 2H, AAPL is stacking green candles and trending up.
If price dips, it’s gotta fight through **238.17** and **238.06** before momentum breaks. If it holds and pushes pre-market highs, upside levels to watch are **241.96 → 250**.
3 Scenarios
🟢 Bullish:
* Hold above 238 → push through PMH → breakout attempt toward 241.96 then 250 test.
* Above 241.96 could open momentum for a stronger run.
Sideways:
* Chop zone between 238 – 241, consolidation before the next leg.
🔴 Bearish:
* Lose 238 → break below PDL → quick fade back to 236 / 234 zone.
Key Levels
* Support: 238.17 / 238.06 → 236
* Resistance: 241.96 → 250
* Bias: Bullish as long as 238 holds.
💡 My take → watching for a **consolidation bounce off 238** → possible breakout toward 241.96+.

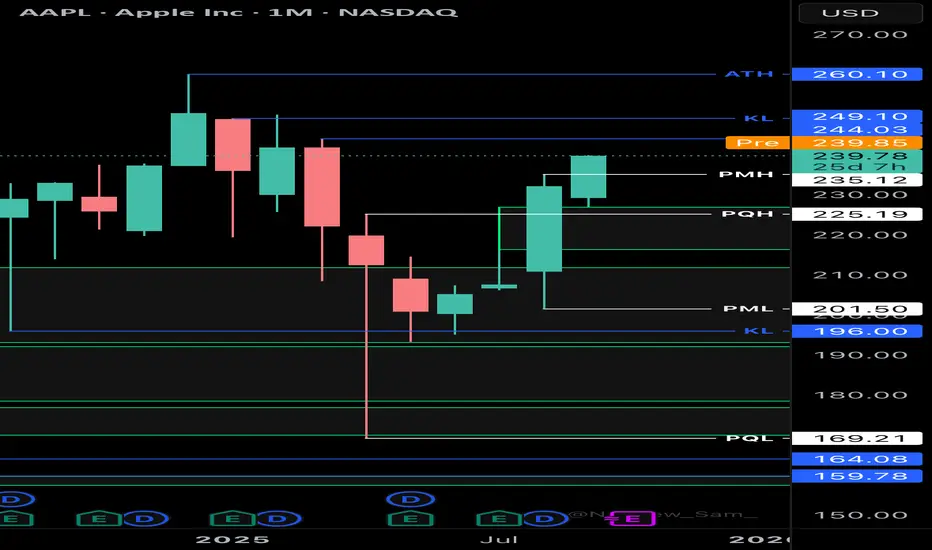
AAPL Clean HTF setup to ATHsAfter creation of another bullish fair value gap in the monthly timeframe, AAPL looks destined to get to and through the current all time high.
Low resistance draw on liquidity.
I think we get a blow off top.
Trap late bulls, then smart money will send us to Hades so they can reposition and get lower prices.