Shipping, Freight, and Logistics in World Trade1. The Importance of Shipping in Global Trade
Shipping is the lifeline of international trade. Around 90% of world trade by volume is transported by sea, making maritime transport the most cost-effective and energy-efficient mode for moving large quantities of goods over long distances. Without global shipping, the modern economy would collapse—no country could sustain its industries or consumer demand without importing raw materials, energy, and manufactured products.
The shipping industry supports the global supply chain, linking developing nations that supply raw materials with developed economies that manufacture and consume finished goods. For instance, crude oil from the Middle East is transported to refineries in Asia and Europe, while electronics from East Asia are shipped to markets in North America and Africa. This interdependence underscores shipping’s role as the engine of globalization.
2. Understanding Freight in International Trade
Freight refers to the transportation of goods in bulk by various modes—sea, air, rail, or road. Freight services determine how products move from one point to another and how efficiently they reach their destinations. Freight is typically divided into three main categories:
Sea Freight – Used for large and heavy shipments, ideal for commodities such as oil, coal, grain, machinery, and vehicles. Containerization has revolutionized sea freight, enabling efficient and secure movement.
Air Freight – Offers the fastest mode of delivery, mainly for perishable or high-value items like electronics, pharmaceuticals, and luxury goods.
Land Freight (Rail and Road) – Connects ports to inland cities and neighboring countries, playing a vital role in regional trade and last-mile delivery.
Freight costs significantly affect product pricing and competitiveness in the global market. Efficient freight management reduces transportation costs and delivery times, making products more affordable and accessible.
3. The Role of Logistics in World Trade
Logistics refers to the planning, coordination, and management of the movement and storage of goods throughout the supply chain—from production to the final customer. It is the strategic process that integrates shipping and freight into a seamless operation.
Key elements of logistics include:
Transportation Management – Selecting the best mode of transport and optimizing routes.
Warehousing – Storing goods safely before they are distributed or sold.
Inventory Management – Ensuring supply meets demand without overstocking.
Customs Clearance – Handling documentation and compliance with international trade regulations.
Last-Mile Delivery – Delivering goods from distribution centers to consumers.
Modern logistics rely heavily on technology, including GPS tracking, warehouse automation, and data analytics, which provide real-time visibility and improve decision-making.
4. Evolution of Global Shipping and Logistics
The modern logistics industry has come a long way since the days of wooden ships and manual cargo handling. The container revolution in the 1950s, introduced by Malcolm McLean, transformed global trade. Standardized containers allowed goods to be loaded, shipped, and unloaded efficiently across ships, trains, and trucks, drastically reducing costs and time.
The digital revolution of the 21st century further enhanced logistics efficiency. Artificial intelligence, blockchain, and Internet of Things (IoT) technologies now streamline supply chains, track shipments in real time, and reduce human error. E-commerce giants like Amazon and Alibaba have set new standards in global logistics, emphasizing speed, reliability, and transparency.
5. Major Global Shipping Routes
World trade depends on critical maritime routes that connect producers and consumers. Some of the most vital shipping routes include:
The Suez Canal (Egypt): Links Europe and Asia via the Mediterranean and Red Seas.
The Panama Canal (Central America): Connects the Atlantic and Pacific Oceans, crucial for trade between the Americas and Asia.
The Strait of Malacca (Southeast Asia): One of the busiest routes connecting the Indian and Pacific Oceans.
The English Channel and Gibraltar Strait: Important for European trade.
Disruptions in these routes—such as the Suez Canal blockage in 2021—can cause massive delays and losses across global supply chains, showing how fragile yet essential maritime networks are.
6. Key Players in Global Shipping and Logistics
Several major companies dominate international shipping and logistics:
Shipping Lines: Maersk, MSC, CMA CGM, and COSCO handle millions of containers annually.
Freight Forwarders: DHL, FedEx, and Kuehne+Nagel provide end-to-end logistics solutions.
Port Operators: DP World, PSA International, and Hutchison Ports manage the world’s busiest ports.
Ports such as Shanghai, Singapore, Rotterdam, and Dubai’s Jebel Ali are global trade hubs, facilitating the import and export of goods worldwide.
7. Challenges Facing the Shipping and Logistics Industry
Despite its importance, the global shipping and logistics industry faces several challenges:
Supply Chain Disruptions: Events like the COVID-19 pandemic, wars, or natural disasters expose vulnerabilities in global supply chains.
Rising Fuel Costs: Shipping is heavily dependent on oil, and fluctuations in fuel prices directly affect freight rates.
Environmental Regulations: Pressure to reduce carbon emissions has forced the industry to invest in cleaner fuels and green technologies.
Port Congestion: Overcrowded ports lead to delays and increased costs, especially during peak trade periods.
Geopolitical Tensions: Trade wars and sanctions can reroute or restrict global shipping flows.
8. Green and Sustainable Shipping
Sustainability has become a key priority for the maritime industry. The International Maritime Organization (IMO) has set targets to reduce carbon emissions by 50% by 2050. Innovations such as LNG-powered ships, wind-assisted propulsion, and electric container vessels are being developed. Companies are also investing in carbon offset programs and exploring hydrogen fuel as a cleaner alternative.
Green logistics also focus on reducing waste, optimizing routes, and using eco-friendly packaging materials, contributing to a more sustainable global trade ecosystem.
9. The Future of Global Logistics
The future of logistics lies in automation, digitalization, and resilience. Emerging technologies are reshaping the industry:
Artificial Intelligence (AI): Enhances demand forecasting and route optimization.
Blockchain: Provides secure and transparent documentation for international transactions.
Autonomous Ships and Drones: Expected to revolutionize cargo transport and delivery.
Smart Ports: Use IoT sensors and data analytics to streamline operations.
Moreover, the rise of regional trade agreements and nearshoring (relocating production closer to consumers) is redefining supply chains to reduce risks and costs.
10. Conclusion
Shipping, freight, and logistics are the invisible engines powering world trade. They connect nations, support industries, and ensure that goods flow seamlessly across borders. As globalization deepens and technology advances, the logistics sector continues to evolve, balancing efficiency, sustainability, and resilience.
However, the challenges of environmental impact, geopolitical instability, and supply chain vulnerabilities demand innovation and cooperation. The future of global trade depends on a smarter, greener, and more adaptive logistics network—one capable of sustaining the demands of an interconnected world while protecting the planet for generations to come.
Trade ideas

Long trade 📘 Trade Journal Entry
Symbol: AAPL (Apple Inc.)
Direction: Buy-Side Trade
Date: Fri 10 Oct 25
Time: 11:00 am
Session: LND to NY Session AM
Timeframe: 1 Hour
🔹 Trade Details
Metric Value
Entry 248.43
Profit Level (TP) 278.00 (+11.88%)
Stop Level (SL) 243.56 (–1.98%)
Risk–Reward (RR) 6.0 R
🔸 Technical Context
Structure:
Price broke out from an extended accumulation zone with confirmation from a BOS (Break of Structure) and Demand Zone Retest on the 15-minute and 1-hour timeframes.
The move aligns with a strong fair value gap fill and retest of the order block around 244–245, which acted as a springboard for the next impulsive leg.
Fibonacci Expansion:
1.618 projection → 261.30 (short-term target)
2.618 projection → 267.60 (intermediate)
3.618 projection → 274.00 (high-probability swing)
4.236 projection → 277.92 (extended TP)
Volume Confirmation:
Volume spikes visible at the breakout candle reinforce institutional participation, marking a clear transition from consolidation to markup phase.
🔹 Narrative & Bias
Apple continues to exhibit buyside momentum after consolidating above the September accumulation range. The breaker block re-entry at 245 aligned with fib 0.618 retracement and strong volume demand, confirming bullish continuation.
Current structure mirrors prior accumulation-distribution cycles seen before major upside runs.
Macro Context:
Tech sector rotation in line with AI & earnings optimism.
Broader equity market stability encouraging risk-on positioning in mega-cap tech names.
Projection:
Price expected to extend toward 267–278 levels before the next major consolidation phase, with potential for partial take-profits near the 1.618 extension.

AAPL | Money will Rotate into this MEGA CAP | LONGApple, Inc. engages in the design, manufacture, and sale of smartphones, personal computers, tablets, wearables and accessories, and other varieties of related services. It operates through the following geographical segments: Americas, Europe, Greater China, Japan, and Rest of Asia Pacific. The Americas segment includes North and South America. The Europe segment consists of European countries, as well as India, the Middle East, and Africa. The Greater China segment comprises China, Hong Kong, and Taiwan. The Rest of Asia Pacific segment includes Australia and Asian countries. Its products and services include iPhone, Mac, iPad, AirPods, Apple TV, Apple Watch, Beats products, AppleCare, iCloud, digital content stores, streaming, and licensing services. The company was founded by Steven Paul Jobs, Ronald Gerald Wayne, and Stephen G. Wozniak in April 1976 and is headquartered in Cupertino, CA.
AAPL Apple Options Ahead of EarningsIf you haven`t bought the dip on AAPL:
Now analyzing the options chain and the chart patterns of AAPL Apple prior to the earnings report this week,
I would consider purchasing the 255usd strike price Calls with
an expiration date of 2025-11-21,
for a premium of approximately $18.65.
If these options prove to be profitable prior to the earnings release, I would sell at least half of them.

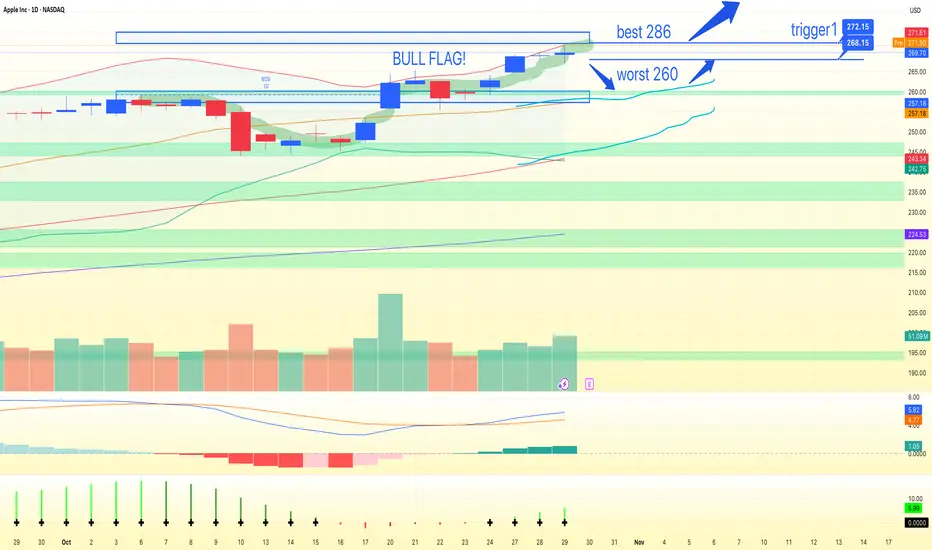
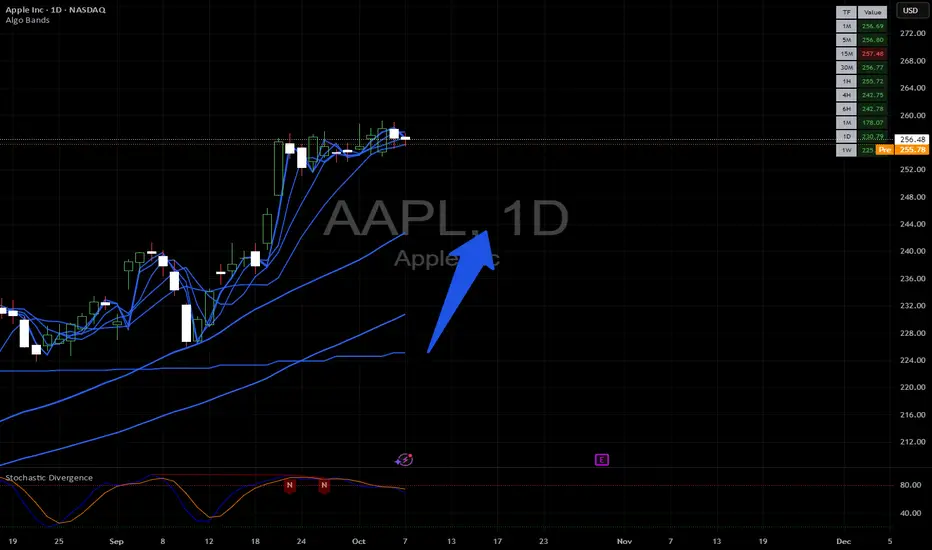
AAPL Bullish Breakout: Retest Buy Toward 282–286Apple (AAPL) is trending firmly higher on the 1D chart, with multiple break-of-structure pushes and price riding the upper Bollinger Band. The recent surge cleared resistance and printed a new high at 271.60, while the 20/60/120 MAs remain positively stacked and rising. Short-term momentum favors continuation, but a brief pause wouldn’t surprise given the extension.
My primary path is a buy-the-retest setup: a dip into the former ceiling turned demand at 260.00–264.00 holds, followed by a constructive bounce. If that plays out, I’m looking for a grind toward 278–280 first, then an extension into 282–286 as higher highs resume. Alternatively, strength through resistance is a momentum trigger— a daily close above 271.60 (aggressive >272.00) would validate a break-and-hold and open the same targets.
Invalidation is clean: a decisive daily close below 260.00 breaks the structure and risks a deeper pullback. Until then, the bias stays bullish; consider partial sizing on initial entries and add on confirmation to respect expanding volatility. Stops can sit just below 260.00 (around 258.00) for retest entries, or tucked under the breakout level if trading the close-above trigger.
This is a study, not financial advice. Manage risk and invalidations
AAPL Weekly Outlook (Oct 28–31)AAPL Weekly Outlook (Oct 28–31): “Apple’s Momentum Reboot — Eyes on $275 Breakout Zone!” 📱
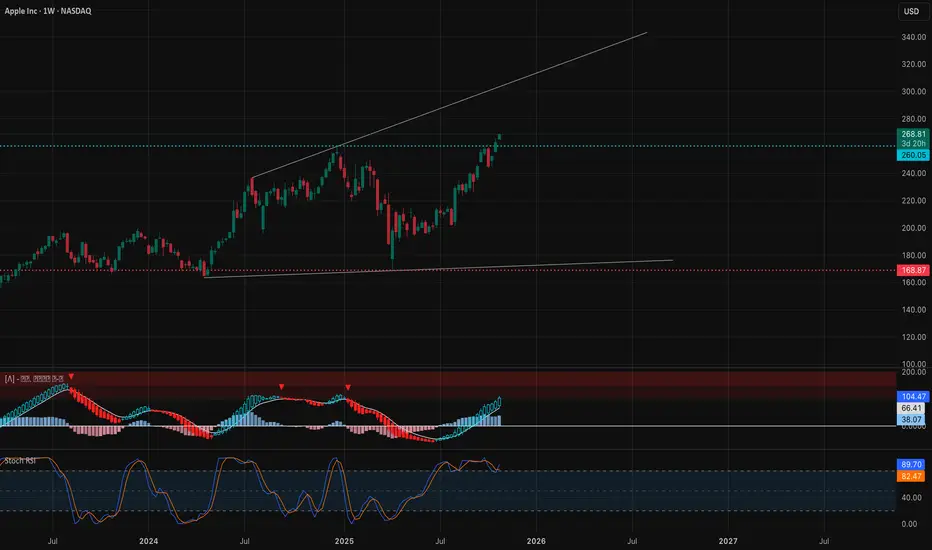
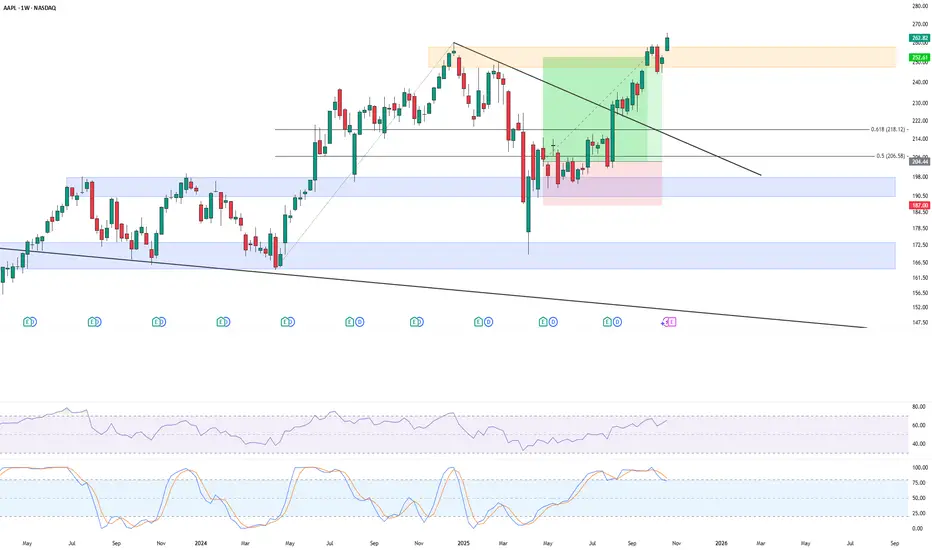
1. Weekly (1W) Structure – Macro Breakout Confirmation
Apple has officially shifted from recovery to expansion phase. The weekly chart shows a confirmed Change of Character (CHoCH) into Break of Structure (BOS) above $260, reclaiming a bullish trajectory. Price is pushing toward the upper channel trendline near $275–$280, showing clean continuation momentum with no immediate resistance until that level.
* Bias: Bullish continuation
* Support: $224 → $260
* Resistance: $275 → $280
* MACD: Strong bullish expansion; histogram widening upward.
* Stochastic RSI: Overbought but still trending — strength, not exhaustion yet.
💡 Weekly Thought:
Momentum is accelerating across the board, confirming institutional participation. Unless $260 breaks down, Apple remains a buy-on-dip candidate heading into November earnings.
2. Daily (1D) – Trend Acceleration
Daily structure is showing clean BOS sequences along an ascending parallel channel. After retesting the midline near $244–$250, Apple bounced strongly and reclaimed the $260 handle. This confirms buyers defending the demand base, now pushing price to challenge $268–$270 short-term resistance.
* Bias: Bullish continuation
* Support: $244 → $259
* Resistance: $270 → $275
* Indicators:
* MACD turning positive again after pullback reset.
* Stochastic RSI curled upward from midzone — signals renewed strength.
💭 Daily Suggestion:
Look for intraday retests around $262–$264 as a potential long entry. A clean daily close above $270 opens path to $275 and eventually $280 if macro remains supportive.
3. 1-Hour (1H) – Intraday Playbook
Intraday structure aligns perfectly with higher timeframes — multiple BOS and short consolidation ranges above $260 confirm sustained bullish control. Momentum is strong, but short-term traders should be cautious of profit-taking near $270–$272 zone before the next leg higher.
* Scalp Bias: Bullish above $262
* Support: $260 → $255
* Resistance: $270 → $275
* Setup Idea:
* Call scalp: Above $266 with target $272–$275.
* Put scalp: Only below $260 breakdown, targeting $255.
📈 1H Thought:
If AAPL consolidates tightly between $266–$269 early in the week, it may coil for a breakout toward $275 later this week.
4. GEX & Options Sentiment – Institutional Positioning
Gamma Exposure (GEX) data shows heavy call concentration aligning perfectly with price structure, reinforcing bullish continuation bias.
* Highest positive GEX / resistance: $269 → $275 → $280
* Support (put-dominated zones): $257 → $252
* Call ratio: 9.1% (moderate bullish exposure)
* IVR: 19.9 (low IV environment)
* IVx avg: 32.6 (slightly cooling)
Institutions are pinning price near $265–$270 with positive gamma bias. The $275–$280 zone acts as the next magnet if upward momentum persists.
5. Suggested Option Plays
* Bullish Setup (Preferred):
* Buy-to-open 270C–275C (1DTE/2DTE) if price reclaims $268 with strength.
* Target: $275–$280
* Stop: Below $260
* Reason: Gamma buildup supports continuation, clean technical breakout setup.
* Bearish Hedge (Cautious):
* Buy 255P (1DTE/2DTE) only if price breaks $260 with confirmed volume.
* Target: $252
* Stop: Above $266
Apple’s structure is aligned bullishly across all timeframes — a clear continuation from the mid-October breakout with strong call-side gamma buildup. The next move hinges on whether $270 flips to support; if so, the stock is primed for a potential $275–$280 test.
🎯 Primary Bias: Bullish toward $275–$280
⚠️ Watch For: Breakdown under $260 = short-term exhaustion signal.
This analysis is for educational purposes only and does not constitute financial advice. Always do your own research and manage your risk before trading.
Apple company will grow value next monthWhy I think AAPL stock would grow to cross $300 because
1.) Chart looks good.
2.) News is all good.
3.) China problems solved today. thank to Trump*.
seems like a no-brainer!
✅ Chart looks strong — Technical do show bullish momentum, especially if it’s breaking resistance near $240–$250.
✅ Positive news — Apple investing $600B in U.S. manufacturing and AI could boost long-term growth.
✅ China issue easing — Reduced geopolitical risk means better supply chain and investor confidence.
Counterarguments (for good discussion):
❌ Valuation already high — Some analysts think AAPL’s price-to-earnings ratio is stretched, limiting upside.
❌ iPhone sales slowing — Global phone demand could weaken even if supply chains improve.
❌ AI competition — Microsoft, Google, and others might outpace Apple in AI innovation.
So, crossing $300 is possible — but depends on whether earnings and innovation keep pace with the hype.
-Beau Robinson

APPLE: Price Action & Swing Analysis
The recent price action on the APPLE pair was keeping me on the fence, however, my bias is slowly but surely changing into the bearish one and I think we will see the price go down.
Disclosure: I am part of Trade Nation's Influencer program and receive a monthly fee for using their TradingView charts in my analysis.
❤️ Please, support our work with like & comment! ❤️

AAPL - Weekly chartSwing Trade Closed
#AAPL – Weekly Chart
Position closed last week.
Personal Swing Trading strategy. Custom indicator.
✅ Performance: +23%
✅ R:R: 2.76
Simple setup, clean execution.
APPLE INC SHIFTED TO BULLISH TREND STRUCTURE IN DAILY CHARTTechnical Analysis: Apple Inc. (AAPL) Shifts to Bullish Daily Trend
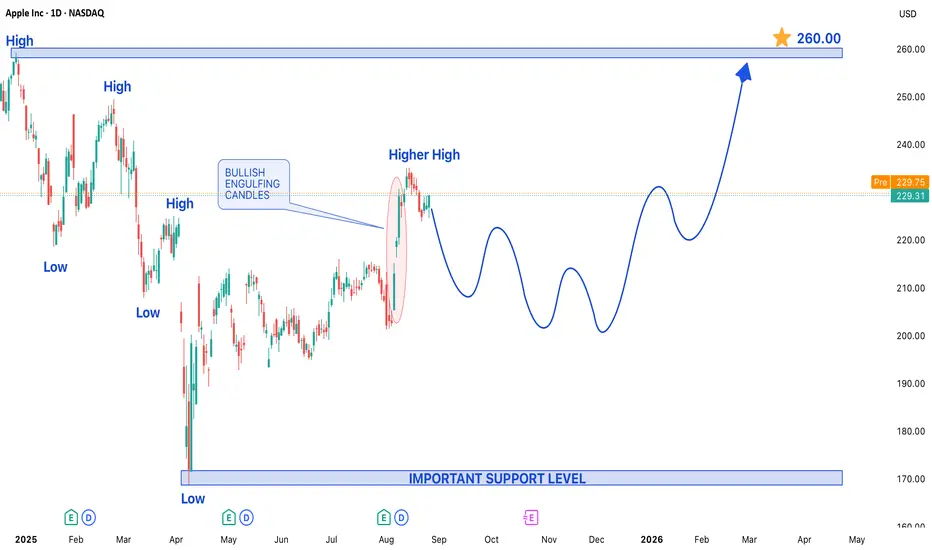
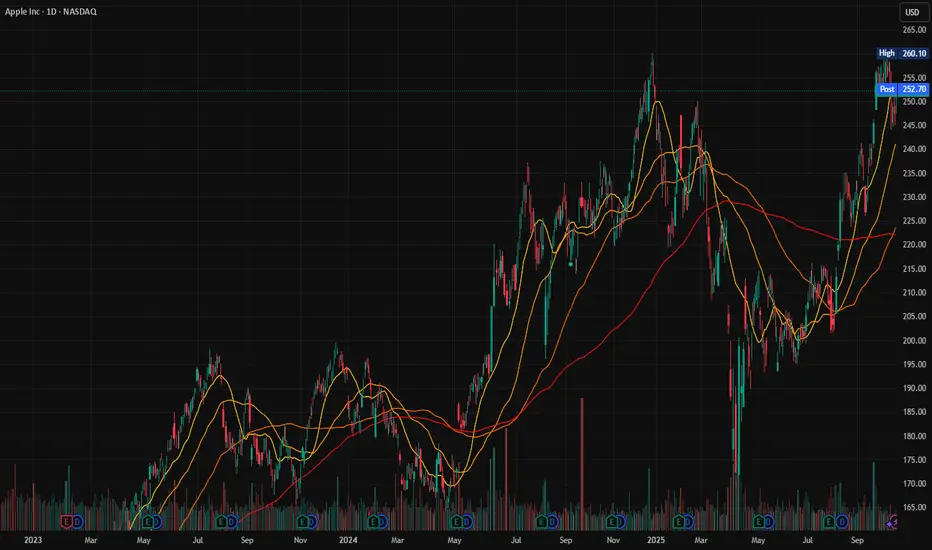
A significant technical development is underway for Apple Inc. (AAPL), as its daily chart has conclusively shifted into a bullish trend structure. This critical change in market posture indicates that buyer momentum has successfully overwhelmed previous selling pressure, setting the stage for a potential sustained upward move. The emergence of this new trend is characterized by a clear pattern of price action that signals growing confidence among buyers.
The primary evidence for this bullish shift is the formation of a higher high. This occurs when the price surpasses a previous significant peak, breaking the sequence of lower highs that defines a bearish or corrective phase. This achievement demonstrates that buyers are not only active but are also willing to bid up the price to new interim levels, establishing a new upward trajectory. This price-based evidence is powerfully confirmed by a key candlestick pattern: the **Bullish Engulfing candle. This pattern materializes when a large bullish candle completely "engulfs" the real body of the preceding bearish candle. It represents a decisive victory for the bulls within a single trading session, marking a clear shift in sentiment from selling to aggressive buying and providing strong confirmation of the underlying strength.
Given the confluence of this new bullish trend structure, the higher high formation, and the potent Bullish Engulfing candlestick pattern, the expectation is for AAPL's price to remain bullish in the upcoming trading sessions. The path of least resistance appears to be firmly to the upside, with momentum favoring the buyers.
Key Levels to Watch:
Upside Target: Based on this technical structure, the price is projected to aim for a target level of $260.00 on the higher side. This objective will likely serve as a key profit-taking zone and a significant psychological resistance level that the market will test.
Downside Support: While the outlook is bullish, it is prudent to identify key risk management levels. On any pullback, the support level of $170.00 is expected to act as a crucial floor. This level should hold to keep the newly established bullish structure intact. A decisive break below this support could invalidate the current bullish thesis and signal a return to a neutral or bearish consolidation phase.
In summary, the technical evidence for AAPL has turned convincingly positive. Traders and investors may look for opportunities on the long side, targeting the $260.00 level, while using any moves toward $170.00 as a potential value area, always with appropriate risk management strategies in place.
AAPL Testing Mid-Range Balance: (Oct. 24 Outlook)Can Bulls Reclaim $262 or Will It Slip Back to $252? 🍏
1. Market Structure (1H & 15M)
Apple’s recent price action shows a fragile equilibrium forming between supply and demand after a clean recovery from the $252 zone. On the 1-hour chart, we’ve got a CHoCH confirming short-term buyers stepping back in around $255, but price remains capped below a key mid-range resistance zone at $260–$262, where several prior breakdown candles originated.
The BOS from earlier in the week was followed by a retracement that created a local higher low structure, hinting at possible accumulation between $255–$258. However, the failure so far to push decisively through $262.50 shows hesitation — likely due to overhead liquidity and the GEX call wall there.
On the 15-minute chart,
Apple is consolidating inside a rising channel with small BOS/CHoCH rotations that reflect indecision. The latest CHoCH suggests short-term exhaustion, but as long as price respects $257–$258, bulls still have a chance to retake control into Friday.
2. Supply and Demand / Order Blocks
* Demand Zone (Support): $252.5–$255.5, aligning with a previous BOS level and high-volume accumulation area.
* Near-Term Demand: $257–$258 (15M fair value gap + local retest zone).
* Supply Zone (Resistance): $262–$265 — key order block cluster where sellers previously initiated the drop; breakout beyond this range could ignite a trend continuation toward $268+.
The chart shows clear liquidity resting above $262 and below $252 — suggesting that whichever side gets swept first will likely define Friday’s directional bias.
3. Indicator Confluence
* 9 EMA / 21 EMA: On the 15M, both EMAs are converging with a mild upward slope, indicating an early transition from consolidation to possible upside momentum. The 1H EMAs are flattening — a neutral but stabilizing signal.
* MACD: The 1-hour MACD is curling upward with histogram bars flipping positive, suggesting bulls are slowly regaining control. On the 15-minute, MACD shows mild bearish divergence but flattening momentum — setting up for a potential premarket expansion.
* RSI: 1-hour RSI is sitting near 68, close to bullish control but not yet overbought. 15M RSI oscillates between 52–60, ideal for a momentum reset phase.
* Volume: Volume picked up during the $252 bounce but has cooled — typical of compression before a possible breakout.
4. GEX (Gamma Exposure) & Options Sentiment
Friday’s GEX chart paints a tight battleground between the $252.5 HVL support and the $262–$265 gamma wall. The highest positive gamma lies right at $259–$260, meaning dealers may attempt to pin price near that zone through hedging.
Below that, the PUT support around $250 aligns perfectly with structural demand and previous BOS support — this is the line bulls must defend. Above, $265 represents the dominant call wall, making it the near-term ceiling unless a gamma squeeze takes hold.
The current IVR (20) and IVX avg (29.8) show low volatility, and call sentiment remains modest (7.1%), implying traders are cautious but not overly bearish. If momentum accelerates past $262, gamma positioning could flip and lead to a controlled squeeze toward $267–$270.
5. Trade Scenarios for Friday, Oct. 24
Bullish Setup 🟩
* Entry Zone: $258–$259 retest or breakout above $262.2
* Targets: $264 → $267 → $270
* Stop-Loss: Below $256.8
* Confirmation: Hold above 9 EMA on 15M + MACD histogram rising + RSI > 60
Bearish Setup 🟥
* Entry Zone: $261–$262.5 rejection or CHoCH under $257
* Targets: $255 → $252 → $248
* Stop-Loss: Above $263.5
* Confirmation: MACD crossdown + RSI divergence + BOS to downside
6. Closing Outlook for Oct. 24 (Friday)
Friday looks to be a compression breakout setup for Apple — momentum is tightening between $257 and $262. If bulls reclaim $262 with conviction, watch for a potential gamma-driven squeeze toward $267+. Conversely, a rejection there with fading volume could pull Apple back toward its $252–$255 accumulation base.
My personal view: AAPL remains neutral-to-bullish as long as $257 holds. Buyers have shown up at every dip this week, and Friday’s session might reveal whether that base was genuine accumulation or just short-term relief. Keep your eyes on $262 — that’s the key trigger level.
📊 Final Thought:
“AAPL is balancing between $257 and $262 — the calm before the breakout. If bulls crack $262, the gamma unwind could send it flying toward $270. If not, expect a cool-off back to the $255 zone.”
This analysis is for educational purposes only and not financial advice. Always do your own research and manage your risk before trading.
Apple: New All-Time High as Low Is Adjusted Apple has recently seen a period of heightened volatility, marked by sharp gains and notable pullbacks. In response to the latest price action, we’ve made a slight adjustment to our wave count and revised the low for magenta wave (4). We’re now allowing for magenta wave (5) to break above the $260.10 resistance level, which would complete green wave . Our alternative scenario, which carries a 34% probability, still calls for a new corrective low in blue wave alt.(IV). In this case, Apple would have just finished beige wave alt.b slightly above $260.10 and would next decline in wave alt.c, falling below support at $212.94. Even so, the alternative corrective low would remain above the $168 level.

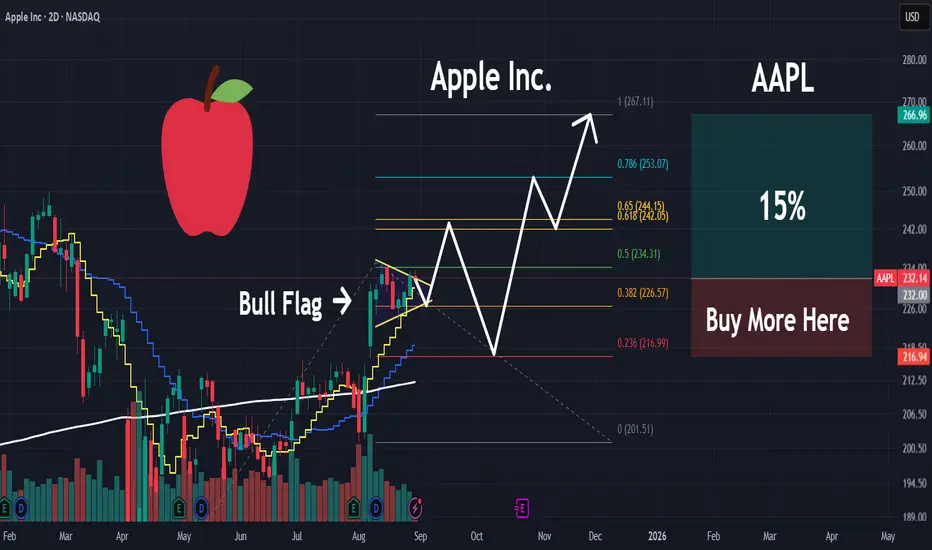
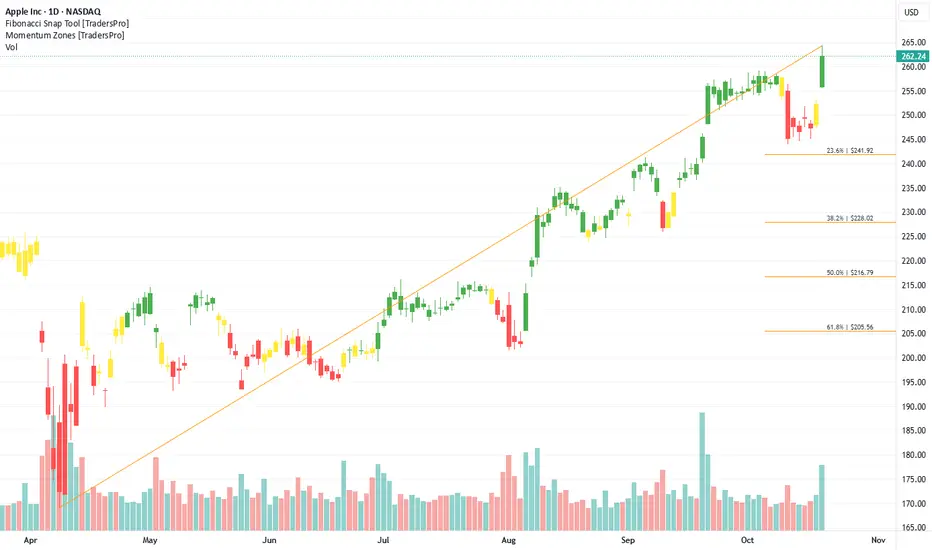
Apple Inc. (AAPL) Expands With AI-Powered DevicesApple Inc. (AAPL) is a global technology leader known for its iconic products — iPhone, Mac, iPad, and Apple Watch — as well as its fast-growing services segment, including Apple Music, iCloud, and Apple TV+. The company’s ecosystem continues to drive customer loyalty and recurring revenue. Apple’s growth is fueled by innovation in hardware and AI, expansion in digital services, and strong brand power that keeps it at the center of global consumer technology.
On the chart, a confirmation bar with rising volume highlights bullish momentum. The price has entered the momentum zone after climbing above the .236 Fibonacci level. A trailing stop can be placed just below this Fibonacci line using the Fibonacci snap tool, helping traders protect profits while leaving room for continued upside potential.
Long trade
📘 Trade Journal Entry
Pair: AAPL (Apple Inc)
Direction: Buyside Trade
Date: Fri 10th Oct 2025
Time: 11:30 AM
Session: London Session AM
Timeframe: 15 minutes
🔹 Trade Details
Entry: $258.49
Profit Level: $269.22 (+4.27%)
Stop Level: $243.69 (–1.96%)
Risk-Reward Ratio (RR): 2.16
🔹 Technical Context
The demand zone on the 15-minute timeframe (near $252–$255) held strongly following an earlier breaker block and order block reaction.
Price retraced to the 0.618–0.786 Fibonacci zone before resuming upward momentum.
Kaufman Adaptive Moving Average (KAMA) is trending upward, confirming directional bias alignment.
RSI recovered from mid-range, showing bullish divergence and improved momentum.
The 1.618 Fib extension aligns closely with the target zone (~$261–$262), confluencing with prior structural resistance.
🔹 Narrative
After a period of range compression within the 255–258 zone, Apple broke from its re-accumulation structure following a liquidity sweep below the 15-minute demand zone.
Institutional accumulation was evident, as reflected by high-volume candle expansion and a clear reclaim of structure at 257.
🔹 Market Sentiment Context
Broader NASDAQ composite strength aligns with post-earnings optimism and risk-on appetite.
USD weakness and moderating Treasury yields have improved tech-sector conditions.
The upcoming Q4 earnings cycle and expectations of a potential Fed rate cut sustain short-term bullish sentiment across mega-cap equities.

Apple’s Q4 Momentum Positions $252.29 Price for $260 Breakout Current Price: $252.29
Direction: LONG
Targets:
- T1 = $255.50
- T2 = $260.00
Stop Levels:
- S1 = $248.00
- S2 = $245.50
**Wisdom of Professional Traders:**
This analysis synthesizes insights from thousands of professional traders and market experts, leveraging the principle of crowd wisdom to analyze Apple. The stock recently gained attention due to strong quarterly results and solid guidance into 2025, highlighting its ability to outperform competitors even in a softer macroeconomic environment. Many market participants view Apple’s consistent demand for its flagship products, robust performance in services, and entry into new categories like augmented reality as critical factors driving growth potential. The collective sentiment around Apple suggests stable growth with high upside potential in the near term.
**Key Insights:**
Apple has continued to showcase resilience despite global macroeconomic uncertainties, primarily driven by stable iPhone demand and impressive growth in its services segment, including subscriptions and cloud services. In its most recent earnings report for Q3 2025, the company posted higher-than-expected revenue, driven by increased adoption in emerging markets such as India, which provides a multi-year growth runway.
Another key driver for Apple has been the successful rollout of its mixed-reality headset, Vision Pro, alongside new AI-powered features in its devices and platforms. Analysts highlight that Vision Pro sales could open up incremental high-margin revenue streams as Apple taps into tech enthusiasts and enterprise markets. Meanwhile, cost-management strategies have been effective, driving operational efficiencies and maintaining robust margins in a challenging environment, enabling Apple to guide confidently into the coming quarter.
**Recent Performance:**
Apple’s stock has demonstrated strong performance, recording a rebound above $250 following its Q3 2025 earnings announcement. The stock gained momentum, driven by market optimism about the upcoming holiday season, which often proves lucrative for Apple’s product lineup. Despite broader market concerns about rising interest rates, Apple’s ability to generate consistent cash flows amid market volatility has fortified investor sentiment. Year-to-date, Apple’s shares are up approximately 21.2%, outperforming the S&P 500.
**Expert Analysis:**
Technical indicators support a bullish outlook for Apple. The stock has broken above its 50-day moving average and formed a bullish ascending triangle pattern, signaling possible continuation toward higher levels. Furthermore, its Relative Strength Index (RSI) remains below overbought territory, providing ample room for additional price appreciation. Many experts note the stock’s historical seasonality tied to strong holiday sales performance, which aligns with the solid product lineup Apple brings into late 2025, including updated iPhone models and Vision Pro unit expansions globally.
A consensus of expert opinions indicates Apple is attracting investment due to its unparalleled brand loyalty and ability to innovate consistently, which positions the company well for sustained performance heading into 2026. Hedge funds and institutional players are reportedly accumulating positions in anticipation of further growth.
**News Impact:**
Recent news surrounding Apple's Vision Pro headset production ramp-up has sparked upbeat sentiment, suggesting management confidence in demand growth for the product. Additionally, emerging partnerships for its AI-driven technologies add significant value, further diversifying revenue streams in the services ecosystem. Stronger-than-expected Q3 earnings and forward guidance have countered concerns around weaker consumer spending. Combined, these developments reinforce the bullish thesis on Apple’s near-term performance.
**Trading Recommendation:**
Given the current technical setup and favorable fundamental drivers, a LONG position on Apple is recommended. The stock’s ability to exceed its recent quarterly forecast and strong demand outlook ahead of the holiday season point to bullish price action. With key resistance at $255.50 and $260 acting as critical targets, traders should monitor for sustained upward momentum. Stops are advisable below $248 and $245.50 to manage downside risks. Considering Apple’s market dominance, stable growth prospects, and innovative product developments, it presents a compelling opportunity for traders seeking upside exposure through Q4 2025.
Do you want to save hours every week? Register for the free weekly update in your language!

Relative Strength Tipped Off AAPL’s Rally Before Price DidAbove is a 5-minute chart of AAPL, and in the lower pane, I’ve plotted the ratio line of AAPL versus SPY. What really caught my attention this morning was what happened around 10:00 ET. While AAPL itself had only opened slightly higher, the ratio line had already broken out to a new high. That was the early clue, the relative strength line was quietly signaling that AAPL was outperforming the market before the actual price move confirmed it.
TheRelativeStrengthTrader

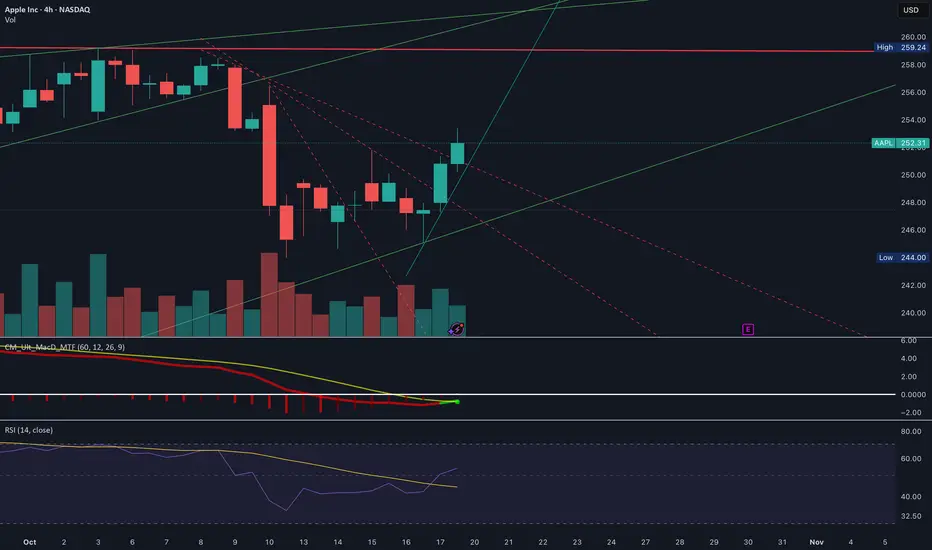
Apple (AAPL) – Potential Short-Term UpsideOn the 4-hour chart, Apple began a noticeable downward trend around October 8. That trend appears to have shifted around October 16, when the stock hit a low of $245. Since then, it has rebounded to approximately $252.
The strength of this bounce suggests the possibility of continued upward momentum in the short term, potentially lasting through the week leading up to earnings on October 30. Traders may want to watch for support near $245–$248 and resistance near $255–$257, which could indicate the next potential price moves.
AAPL Gamma Battle Zone - Oct 21–25AAPL Gamma Battle Zone – Bulls Testing the $255 Ceiling Ahead of Earnings 🔥
🟩 Daily Timeframe – Macro Market Structure
AAPL continues to ride within a clean ascending channel, maintaining higher highs and higher lows since the August reversal. The daily trend remains bullish overall, with price currently hovering near the upper midline of the channel.
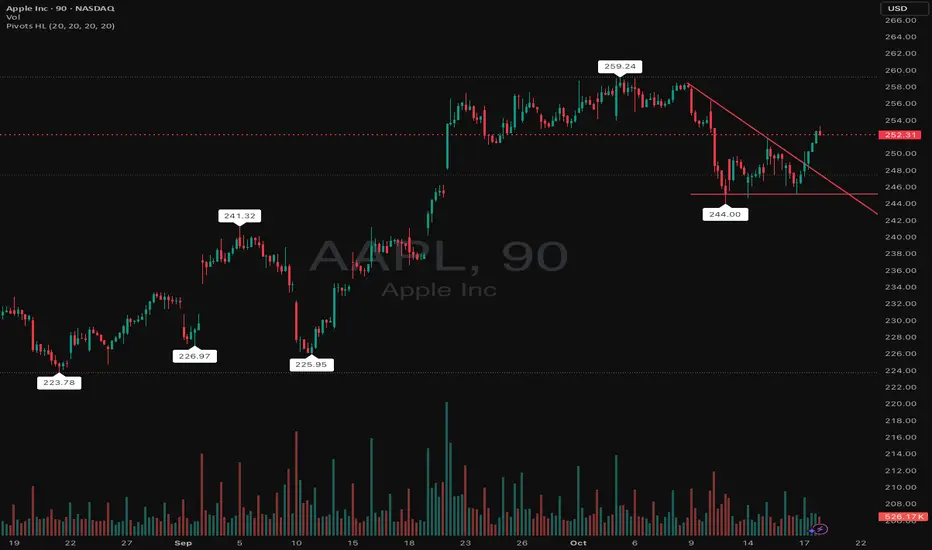
Last week’s rejection near $259–$260 showed short-term exhaustion, but the stock found solid support at $244–$247, a key demand area tested multiple times since September. This zone coincides with the previous CHoCH and liquidity sweep, where institutional buyers likely accumulated positions before the next leg up.
If AAPL can sustain above $252, bulls may attempt another push into the $258–$260 supply zone — a critical decision area where we could see either renewed breakout momentum or another round of distribution.
🟦 1-Hour Timeframe – Structure, Momentum, and Volume
The 1-hour chart shows a clear BOS (Break of Structure) following last week’s CHoCH near $247, confirming the transition back to a short-term bullish structure. The move from $247 → $252.5 came with increasing volume and clean EMA alignment, suggesting solid intraday demand.
Price is now coiling under $253–$255, the first major resistance level in this new leg. Expect some chop here as liquidity builds before the next impulsive move.
* 9 EMA crossed above 21 EMA and both are pointing upward — short-term bullish momentum intact.
* MACD histogram remains positive but flattening, showing early signs of momentum cooling.
* RSI sits around 60–65, leaving room for another push before overbought territory.
As long as AAPL stays above $250.5, the bias remains bullish. A break below that would weaken short-term structure and could trigger a retest of the $247 zone.
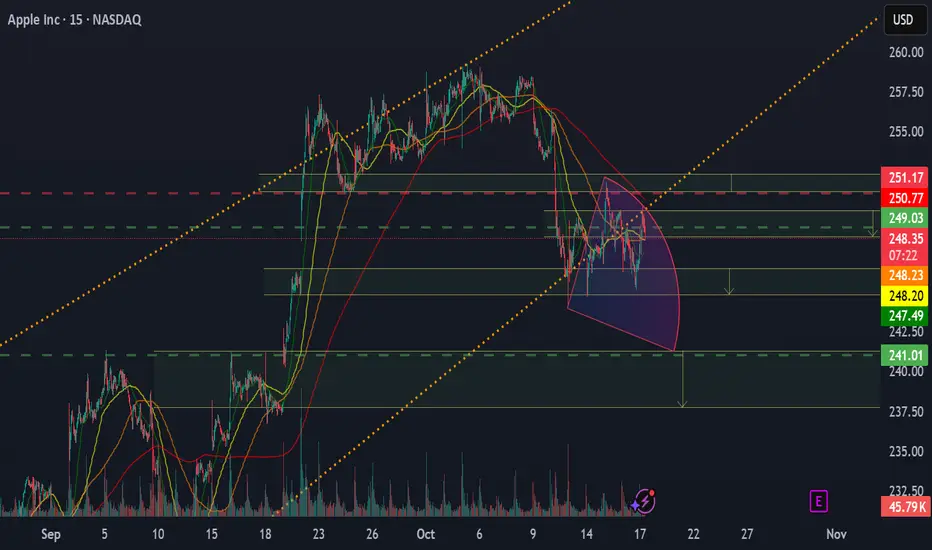
🟨 15-Minute Timeframe – Intraday Precision Zones
The 15-min structure gives the clearest roadmap for intraday traders. AAPL formed multiple BOS and CHoCH swings between $247–$253, with the latest impulse leg rejecting just below $254, a minor liquidity pocket inside the daily supply zone.
We’re now seeing consolidation just above $250–$251, an important area where micro-liquidity is stacking. This zone may serve as an intraday pivot — break below it, and bears can drag the price to $248.5–$247.5. Hold above it, and bulls could reload for another retest toward $255.
Momentum indicators show a cooling phase:
* MACD histogram has started to fade, hinting at short-term consolidation or pullback.
* Stoch RSI has cycled down from overbought but hasn’t yet reset fully — watch for crossovers near the lower band as early reentry signals.
Expect liquidity sweeps around $251–$252.5 early in the week before any meaningful direction confirms.
🟥 GEX (Gamma Exposure) & Options Sentiment – The Dealer Map
Gamma data paints a textbook pinning setup for the week:
* Highest positive GEX / Call resistance: around $255–$260 — heavy dealer hedging pressure could cap upside.
* Strong Put walls: $245–$242, directly aligning with the key daily demand.
* Max Pain: near $250, often acting as a gravitational anchor when volatility compresses.
* IVR 25.9, slightly under the 30-day mean, suggests option premiums are cooling, favoring range compression early week before a potential directional breakout.
Dealer positioning currently supports a neutral-to-slightly-bullish gamma environment, meaning dips may find hedging support, but large rallies will likely face dealer sell pressure near $255+.
Trade alignment thoughts:
* Scalpers: Favor quick long scalps above $251.5 with targets $254–$255, keeping tight stops.
* Directional traders: Watch for daily close over $259 to confirm breakout continuation.
* Options players: Debit spreads or neutral iron condors between $250–$255 align with current GEX pin zone.
🎯 Trade Scenarios
Bullish Setup 🟢
* Entry: Above $252.5–$253 after a confirmed candle close.
* Targets: $255, then $259.
* Stop-loss: Below $249.8.
* Bias confirmation: MACD expansion and RSI > 60 on both 15M and 1H.
Bearish Setup 🔴
* Entry: Rejection from $255–$257 or break below $250.5.
* Targets: $247 → $244.
* Stop-loss: Above $258.5.
* Bias confirmation: MACD bearish crossover + RSI < 45 with EMA slope turning down.
🧭 Closing Outlook – Week of Oct 21–25
AAPL starts the week near equilibrium between demand ($247) and supply ($255). Expect early-week compression as dealers pin around $250–$252, followed by a potential gamma-driven breakout later in the week.
If bulls defend $250, the structure favors another push toward $258–$260. Failure to hold that zone, however, could trigger a controlled pullback into the $247 support block.
I’ll be watching closely for liquidity traps near $251–$252 — if price sweeps that zone and reverses with volume, it could mark the next momentum ignition for bulls.
Disclaimer:
This analysis is for educational purposes only and does not constitute financial advice. Always perform your own due diligence and manage risk accordingly.

AAPL - A true breakout toward ER or BULL TRAPHappy Sunday.
On High Watch of this week is AAPL.
It has kinda formed a triple bottom here. The bounce from $244 forms a higher low, showing buyers stepping in. Breaking above the trendline resistance shifts the short-term structure to BULLISH. Next target if momentum continues is $256-$259 zone, which was the previous resistance cluster. However, if the price falls below $250 then this breakout is a bull trap. Below $244 then Bearish continue.
Trade Alert: $AAPL NOV 07 2025 $255 CALLS – 128% ROI Target inEnter: NASDAQ:AAPL NOV 07 2025 $255 CALLS
Buy in Price: $6.70 - $6.75
Take Profit: $15.28
Stop Bleeding: $5.90
ROI Potential: 128%
Exit Within: 2 Weeks
Apple short ideaApple looks overextended after the recent rally, showing signs of exhaustion near resistance. Price momentum is slowing, and volume confirms reduced buying pressure. I expect a short term correction as the market takes profits and sentiment cools down.
I am opening a short position with a target at 241. After that, I’ll review the situation and reassess the direction, but it’s very likely that we’ll correct deeper.
A break below the recent local lows could accelerate the move toward that level.
⚠️ Not financial advice.
$AAPL Buy levelUnlike NASDAQ:META , NASDAQ:AAPL is strong. If, however, NASDAQ:AAPL starts to come down, $225 offer a good level to go long off. $225 is also a level to sell puts against.
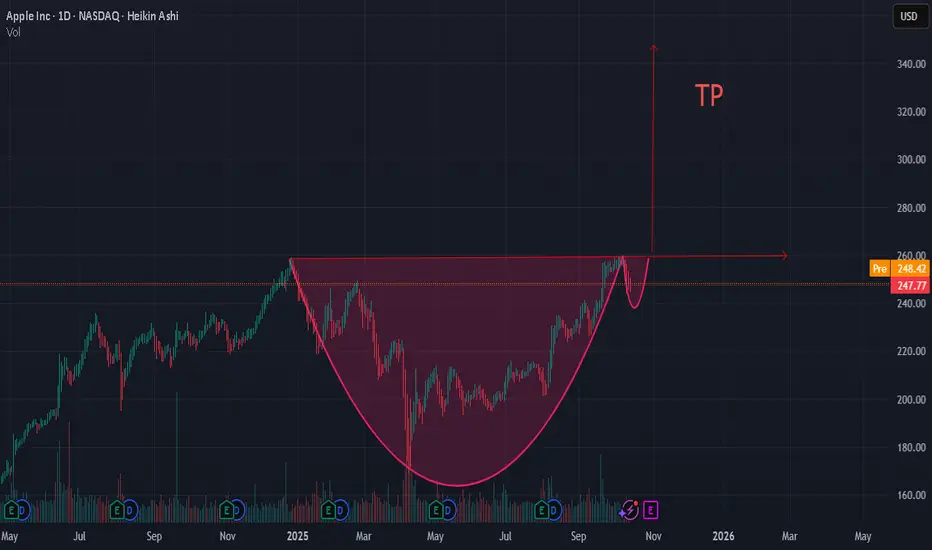
CUP AND HANDLE ON AAPL TP 340 LONGApple moves in a 10-15% range for years!
With lowering interest rates, and with quite low P/E ratio (32), compared to other companies in this industry, a new wave can begin!