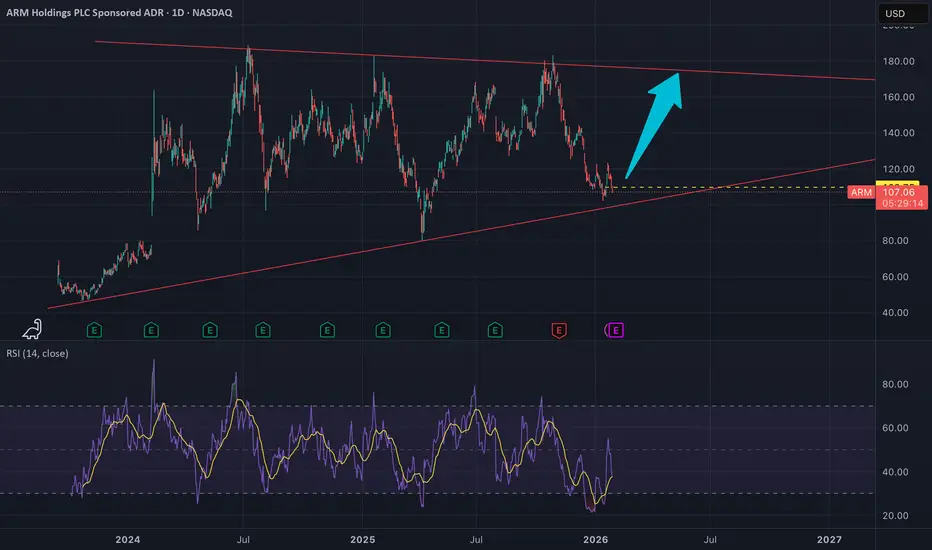
Bought some $ARM - 3 reasons for the entryBought some NASDAQ:ARM — shared this with members earlier today.
3 reasons for the entry 👇
• Low of the range
• Triple bottom
• Small base / block break
Together, these give a solid probability setup.
Target: $160 zone.
Stop: below the pink box.
Arm Holdings plc
No trades
Next report date
—
Report period
—
EPS estimate
—
Revenue estimate
—
0.76 USD
792.00 M USD
4.01 B USD
1.06 B
About Arm Holdings plc
Sector
Industry
CEO
Rene Anthony Andrada Haas
Website
Headquarters
Cambridge
Founded
1990
IPO date
Sep 14, 2023
Identifiers
3
ISIN US0420682058
Arm Holdings Plc engages in the licensing, marketing, research, and development of microprocessors, systems IP, graphics processing units, physical IP and associated systems IP, software, and tools. It operates through the following geographical segments: United Kingdom, United States, and Other Countries. The company was founded on November 12, 1990 and is headquartered in Cambridge, the United Kingdom.
Related stocks

ATHThe price has suffered a sharp sell‑off, bringing it back to the blue support level that has been holding since the IPO.
One thing is clear in the AI race: semiconductor manufacturers are among the winners — and ARM, with its low‑power processors, remains the undisputed leader.
A retest of the all

Investment Thesis: The Picks-and-Shovels Play for the AI DecadeArm Holdings is positioned not as a mere chipmaker, but as the fundamental architectural licensor for the global computing ecosystem. Its business model—collecting licensing fees and royalties on virtually every chip built on its designs—makes it a high-margin, scalable "picks-and-shovels" beneficia

Bull run confirmationWe would go over the beneficial perspective that we have over ARM holdings.
Strong Growth Momentum and Big-Picture Potential
Arm Holdings has been a standout story in the semiconductor and AI ecosystems. Despite typical market volatility, the company’s fundamental drivers continue to support an op

Arm - Positive outlook ahead of earnings - Value to collect?Hi guys we would be looking into our analysis for ARM Holdings before their earnings call!
ARM Holdings (ARM) – Positive Outlook Ahead of Earnings
ARM Holdings plc, a leading provider of semiconductor intellectual property, is poised to deliver a strong earnings report, driven by robust demand for

ARM Holdings Key Support Bounce Sets Up Weekly Upside:Current Price: 116.07 (Analysis was generated on Monday Morning)
Direction: LONG
Confidence level: 58%(Signals lean bullish, but trader commentary is light and X volume is thin, so I’m keeping targets tight for this week)
Targets
Target 1: 120.50
Target 2: 124.00
Stop Levels
Stop 1: 112.80
Stop

Wedge Breakout + Bullish Divergence + TTM Squeeze....on ARM!NASDAQ:ARM didn’t just break out — it’s stacking signals:
Falling Wedge: $143 high → $103 low → breakout above 120, now retesting 116 (old resistance = new support).
Daily Bullish Divergence: Price hits 103, RSI prints higher lows — momentum turning.
TTM Squeeze: Long red dots fi

ARM Breakout
ARM Breakout
1️⃣ Strong close above the long-term descending trendline, confirming breakout
2️⃣ Volume expansion supports the move, increasing breakout validity
3️⃣ Personal view: watching for an intraday / same-day pullback to add, based on price action
4️⃣ Key support: $100
Next resistance zon

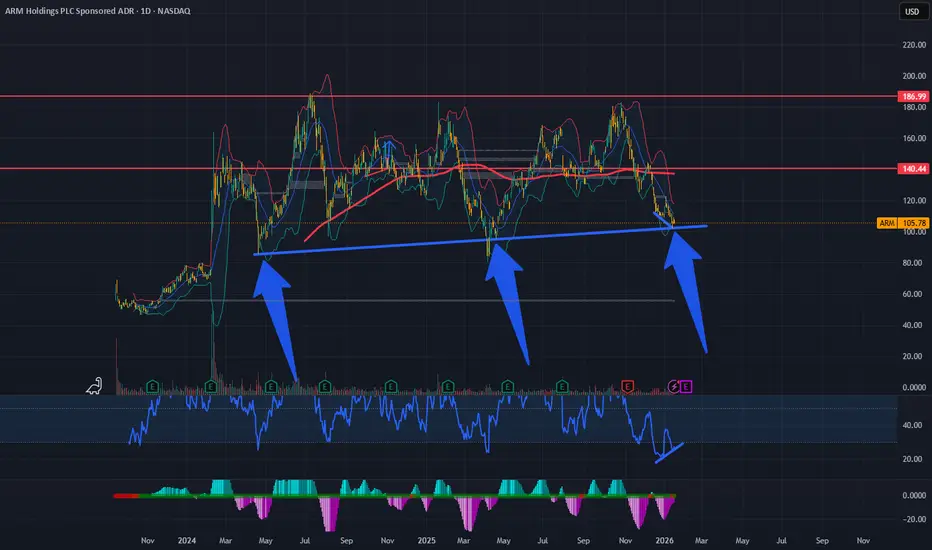
Triple Touch + Bullish Divergence on the 4H: Reversal Brewing?ARM Holdings ( NASDAQ:ARM ) is forming a strong triple touch of support on the daily chart around the $104–$105 zone — three clean bounces off the same horizontal level without breaking lower, signaling solid buyer defense and seller exhaustion.
Adding confluence: bullish divergence on the 4H time
See all ideas
Summarizing what the indicators are suggesting.
Neutral
SellBuy
Strong sellStrong buy
Strong sellSellNeutralBuyStrong buy
Neutral
SellBuy
Strong sellStrong buy
Strong sellSellNeutralBuyStrong buy
Neutral
SellBuy
Strong sellStrong buy
Strong sellSellNeutralBuyStrong buy
An aggregate view of professional's ratings.
Neutral
SellBuy
Strong sellStrong buy
Strong sellSellNeutralBuyStrong buy
Neutral
SellBuy
Strong sellStrong buy
Strong sellSellNeutralBuyStrong buy
Neutral
SellBuy
Strong sellStrong buy
Strong sellSellNeutralBuyStrong buy
Displays a symbol's price movements over previous years to identify recurring trends.