ARM Holdings : First Long AttemptWhen I asked ChatGPT what Arm does for someone who is not in the chip industry or an electronics engineer, chatgpt gave a very nice answer:
"“A linguist who designed the world’s operating language.”
We're very close to the earnings date. (5 november 2025)
A target price between 200 and 230 is reasonable, but a sharp rise or fall is possible on earnings day.
Whether 230 should be maintained initially or whether a downgrade to the 200 target price will be determined then.
Arm Holdings has subsidiaries in China, making it a giant affected by the US-China trade war.
Reasonable position sizing should be made with this in mind.
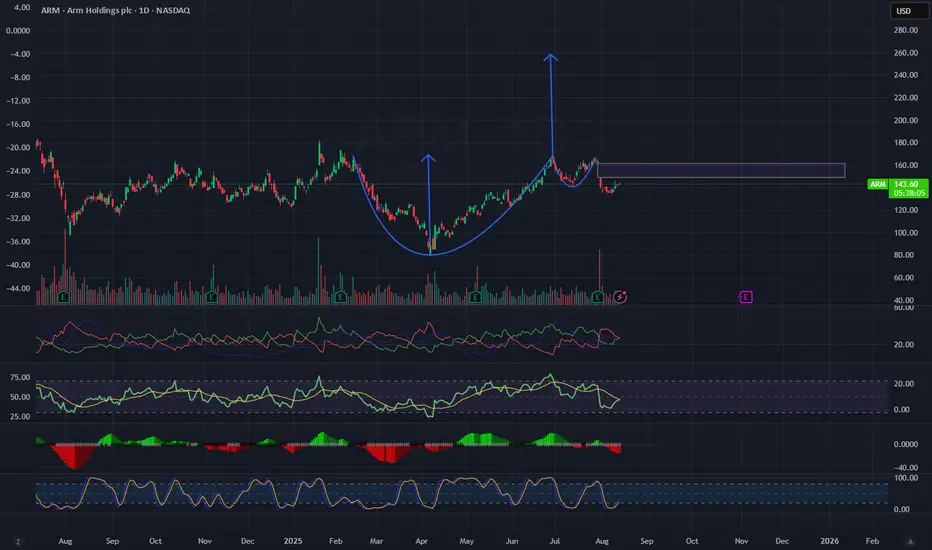
We're above the 200 moving average on the 4-hour chart.
ATR % shows that relatively decreasing volatility can experience sharp increases in a short time.
(Not price , volatility )
First, let's try a target of 230 based on a Risk/Reward ratio of 3.
Parameters:
Stop-Loss : 137.5 ( or close under 137.5 )
Risk/Reward Ratio : 3.00
Take-Profit Level : 230.00
As I mentioned above, earnings or other developments can trigger a rapid stop-loss. Therefore, a small position is ideal for this trade.
Regards.
Trade ideas

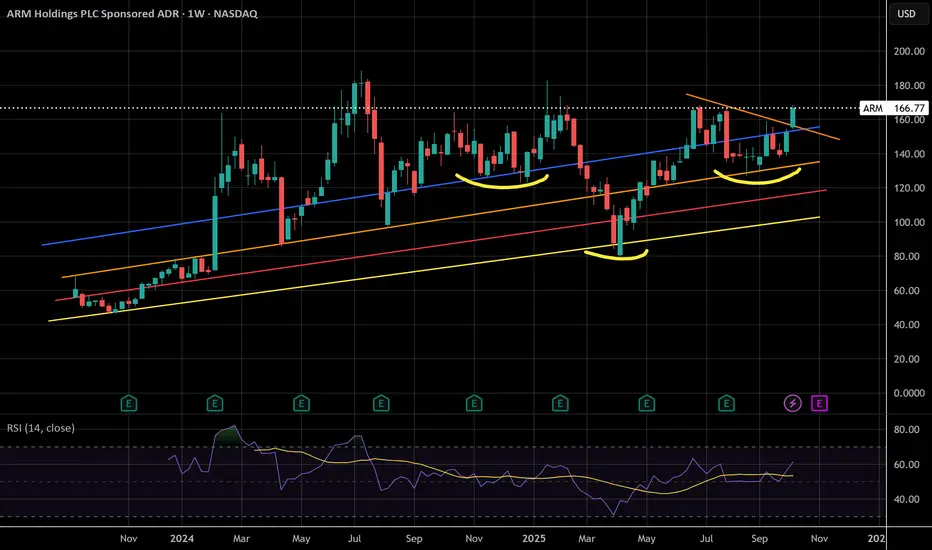
$ARM Bullish Scenario Looking at this chart. We can see that NASDAQ:ARM had a successful restest and bounced. We need volume to break new ATHs

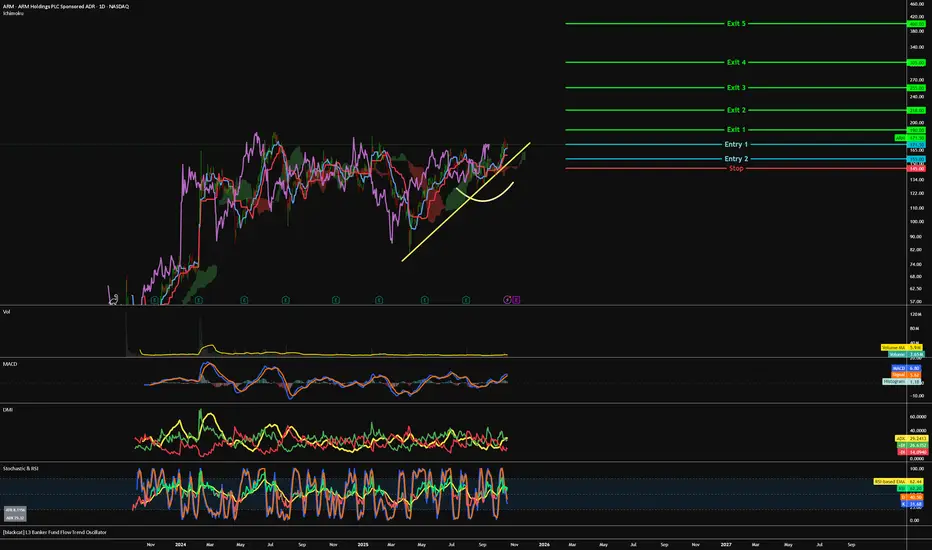
ARM - Potential Bullish Breakout Likely=======
Volume
=======
- neutral
==========
Price Action
==========
- Dips are supported on uptrend line
=================
Technical Indicators
=================
- Ichimoku
>>> price above cloud
>>> Green kumo expanding
>>> Tenken - Above clouds & pointing away
>>> Chiku - Above clouds
>>> Kijun - Above clouds & pointing away
=========
Oscillators
=========
- MACD still bullish
- DMI bullish
- StochRSI, still bullish
=========
Conclusion
=========
- short to long term breakout swing
- price may reverse at current level, to enter spot or wait for pullback at entry 2.
=========
Positions
=========
Entry 1 - $171.50
Entry 2 - $155
Stop - $145
Exit 1 - $190
Exit 2 - $218
Exit 3 - $255
Exit 4 - $305
Exit 5 - $400
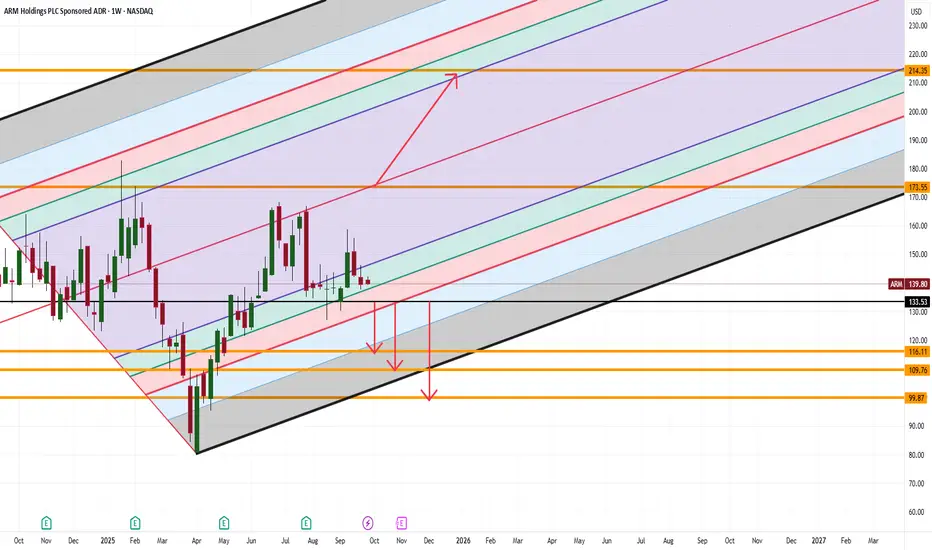
ARM Traders Won’t Like This SetupARM Holdings is sitting at a pivotal zone, and the next move could be brutal for one side of the market.
-If $133.53 breaks, momentum opens a slide toward $116, then $109, with $99 lurking as the deeper target.
-But if price can reclaim $173, the stage is set for a rally toward $213.
Here’s what makes this fascinating: most traders get tunnel vision on the current chop… while the real story is how violent ARM tends to move once it clears a range.
👉 The question isn’t if it moves, it’s which side gets trapped first.
How are you preparing for either outcome?
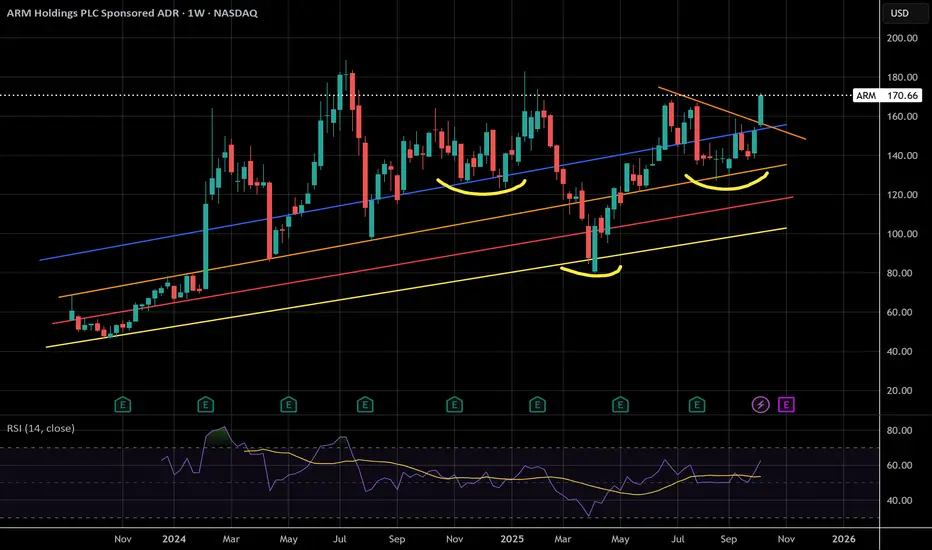
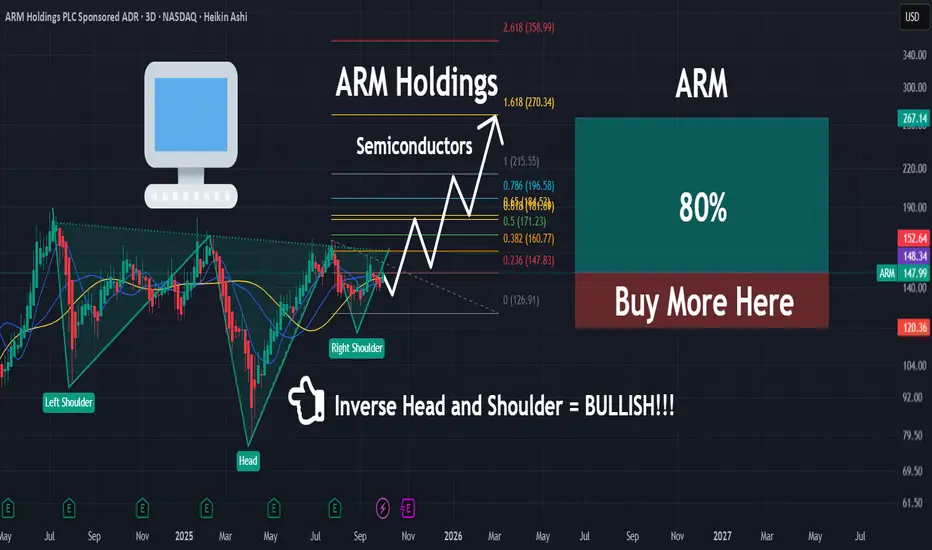
ARM Reverse H & SARM refuses to go down as tech stocks take a nose dive today, it's looking pretty good to complete this reverse head and shoulder setup
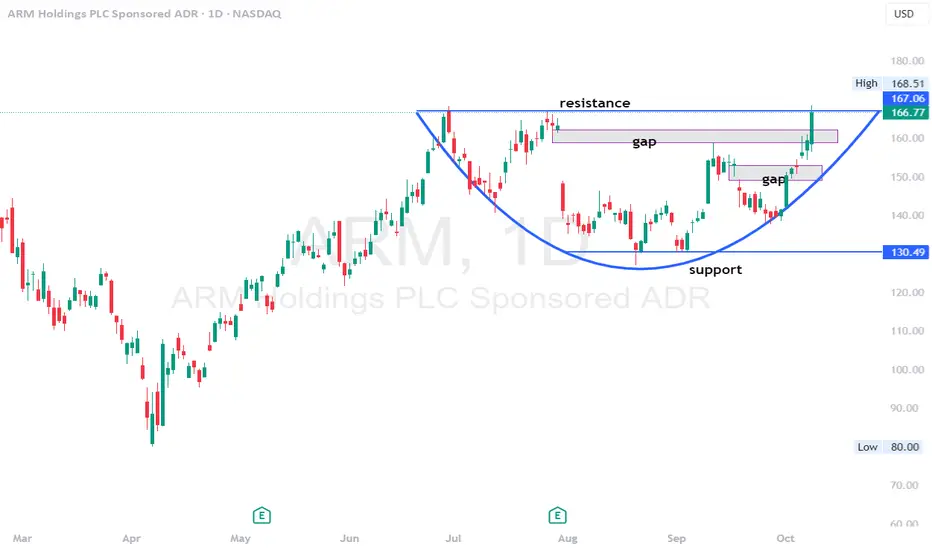
$ARM - $170 break for a move towards all time highsARM - top option play today. Stock filled both the gaps to the upside as posted last week.Stock rejecting and closing below $167 resistance level. Stock rejecting that level twice earlier. looking for a bigger move post that level breaks . Stock has all time highs around $188 . we could see that retest above $170 level break.
ARM Reverse H & S?ARM has broken the local trend line and is on it's way to contend with all time highs. If it makes a new high we could be in for some short squeeze activation in price discovery
Stay safe out there, I am trailing my stop losses for tech stocks personally. Because the market is so consistently upwards, they don't get triggered and my profits are secure
The question is: Will there be an FOMC announcement if the government is shut down? If anyone knows please tell me
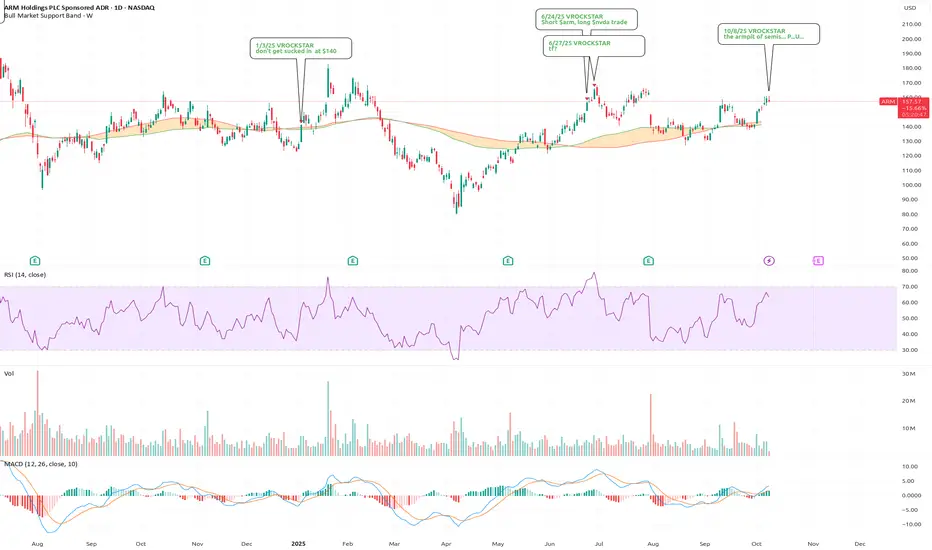
10/8/25 - $arm - the armpit of semis... P...U...10/8/25 :: VROCKSTAR :: NASDAQ:ARM
the armpit of semis... P...U...
- beyond a "hey we also #metoo signed a deal with openai"...
- what do you actually think you have here?
- you hold masa son's bag?
- you believed a hedge fund when they said it would 3x? (in bitcoin terms right? /sarc)
- this thing is >20x sales
- valuation 100% matters
- so insane that all i see these days is shorts
- it's hard to own anything, but if u do buy semis, i think it's clear that you just buy the winners nvda, tsm... as have written about a lot
- avoid this trash, leave it for someone else to fafo.
V
ARM | The Next Semi to Move Higher | LONGArm Holdings Plc engages in the licensing, marketing, research, and development of microprocessors, systems IP, graphics processing units, physical IP and associated systems IP, software, and tools. It operates through the following geographical segments: United Kingdom, United States, and Other Countries. The company was founded on November 12, 1990 and is headquartered in Cambridge, the United Kingdom.
ARM - base completed, read y for a new uptrendNASDAQ:ARM has spent the 2024-2025 period building a solid based after its IPO run. This consolidation phase looks complete, suggesting that the stock is ready to resume its upward trend.
I expect the price to break higher, with a potential target around $240.
A clean breakout from this structure could confirm renewed bullish momentum.
No financial advise.

Arm Holdings (ARM): Bullish Outlook on Structural Growth ThemesArm Holdings NASDAQ:ARM is a semiconductor IP powerhouse driving innovation across AI, mobile, data centers, and IoT. With its high-performance, low-power chip architectures, Arm remains foundational to next-gen computing infrastructure.
🔍 Key Fundamentals:
Market Dominance: Arm holds a leading position in semiconductor IP, backed by deep R&D investment and expanding licensing with top global chipmakers.
Revenue Momentum: Recent earnings show strong revenue growth, underpinned by rising global demand for Arm-based designs.
AI & Cloud Pivot: Major cloud providers are rapidly adopting Arm-based server architectures, reflecting Arm’s shift into AI and enterprise computing.
IoT & Automotive Expansion: With increasing compute needs in vehicles and smart devices, Arm’s low-power design edge is unlocking new growth verticals.
📈 Technical Perspective:
We're bullish above the $120.00–$122.00 zone, with an upside target of $270.00–$275.00 based on structural demand growth and strategic diversification.
#ARM #ArmHoldings #Semiconductors #AIStocks #TechStocks #IoT #CloudComputing #ChipStocks #NVIDIA #DataCenter #BullishBreakout

ARM Holdings — reversal pattern signals growth potentialOn the ARM chart an inverted head and shoulders pattern is taking shape with price approaching the neckline around 144–145 and a confirmed breakout above this level could trigger an upward move toward 220 with extended targets at 310–330. In case of a pullback the 128 zone remains key support to preserve the bullish structure. Fundamentally ARM continues to strengthen its role in chip architecture while growing demand in artificial intelligence and mobile technologies drives institutional interest. As long as the pattern holds the bullish scenario stays in play.

ARM longs Daily ILM confirmationILM is an inverted liquidity model. Sweep of lows and a displacing attempt at a V-shape recovery. It up to the buyers now to take us where we should go with Fridays bullish Powell momentum that we got at 10am.
Daily candle has inverted the bearish candle from last week and reclaimed the 200EMA
Easy stop loss defined for you on this one. Closures under $127 the bounce or just hold it long term. Up to you.
I'm holding shares around this average and just entered a few call options so I will play the options off how these daily candles close.
Take profits can be anywhere inside of the bearish gap, or simply hold for some higher numbers. This is one of the bigger tech companys so I don't see it as a bad investment or long term hold. It's stuck in a massive range here on the weekly chart in this consolidation it's sitting in.
Now obviously Nasdaq needs to continue its uptrend for this play to work which I believe we will come close to testing or breaking through all time highs this week on the QQQ.
We shall see.
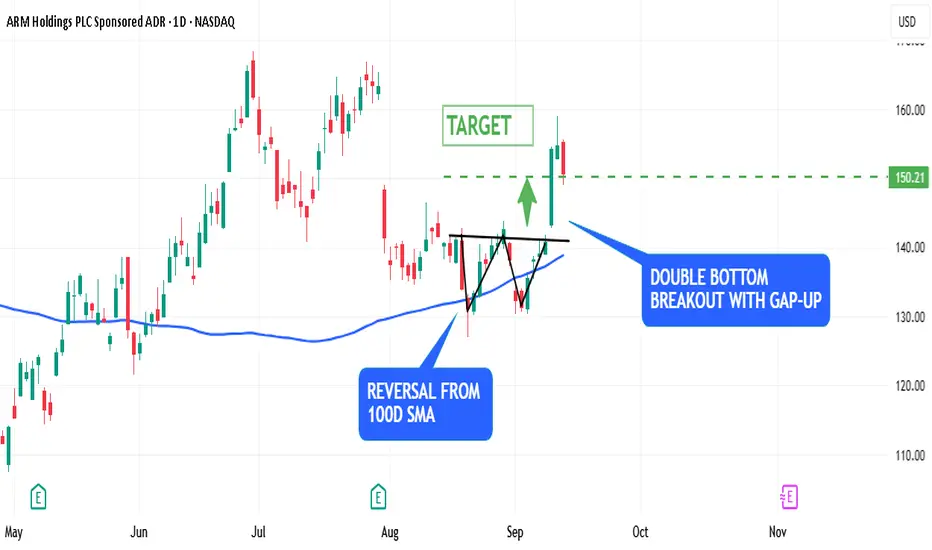
ARM Holdings – Gap-Up Double Bottom Breakout Hits 150ARM Holdings broke out of a double bottom with a big gap up and showed strong conviction. After the breakout, price reached 150 quickly and the target was validated.
Interestingly, the stock also reversed from the 100D SMA which acted as a support and added more strength to the upmove.
This combination of a bullish chart pattern, gap up and SMA support shows strong institutional participation and good technicals.
📊 Key Highlights:
Broke out of double bottom ✅
Gap up 📈
Target of 150 hit 🎯
100D SMA acted as support 🔑
Do you think ARM can continue to go up and hit new highs or is a short term pullback coming?
Super Performance Candidate NASDAQ:ARM , A.I market leadership with clients like NASDAQ:META and NASDAQ:GOOG driving demands, strong revenue growth, high margins and bountiful of institutional support, 187 hedge funds to be exact
At a RS Rating of 89,
I have reasons to believe this equity value could increase

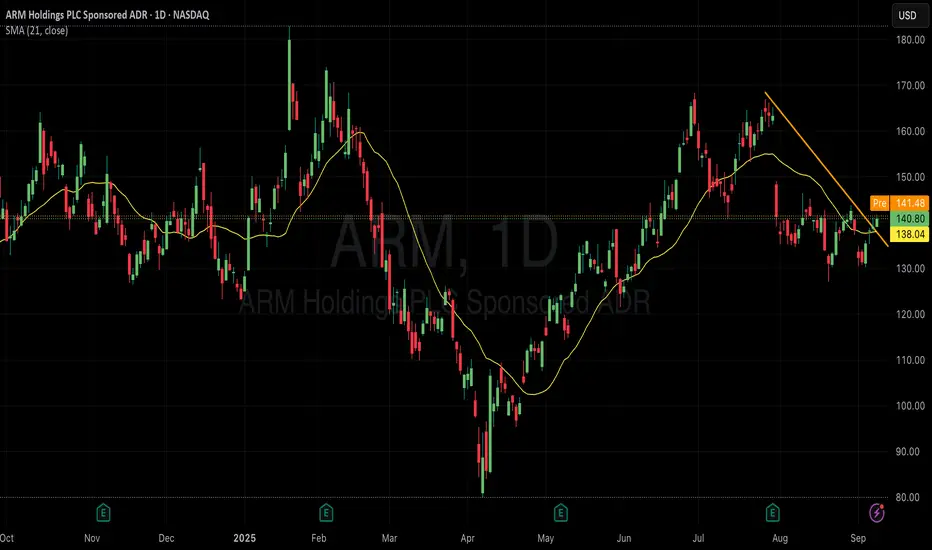
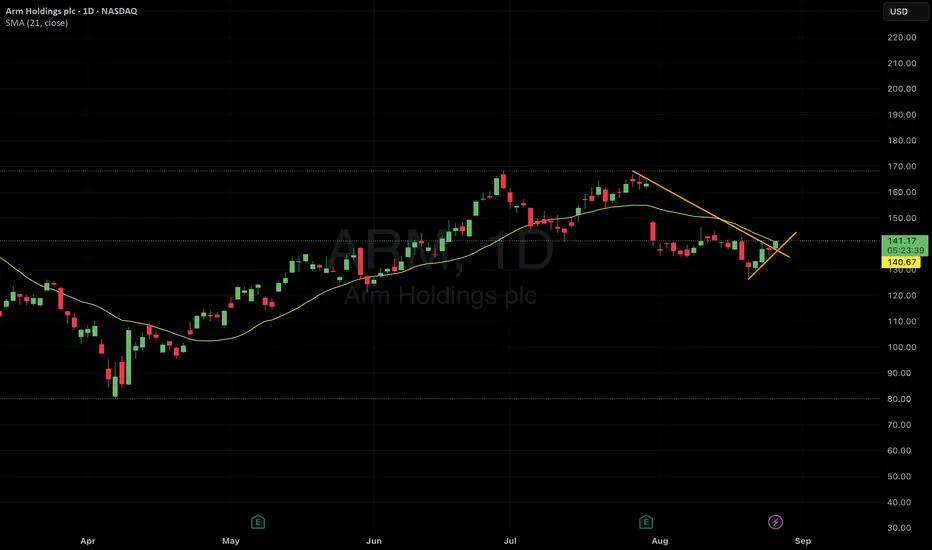
Keep an Eye on ARMKeep an eye on NASDAQ:ARM , breaking a downtrend, popped up over the 20SMA and starting to tick back up. Potential opportunity.
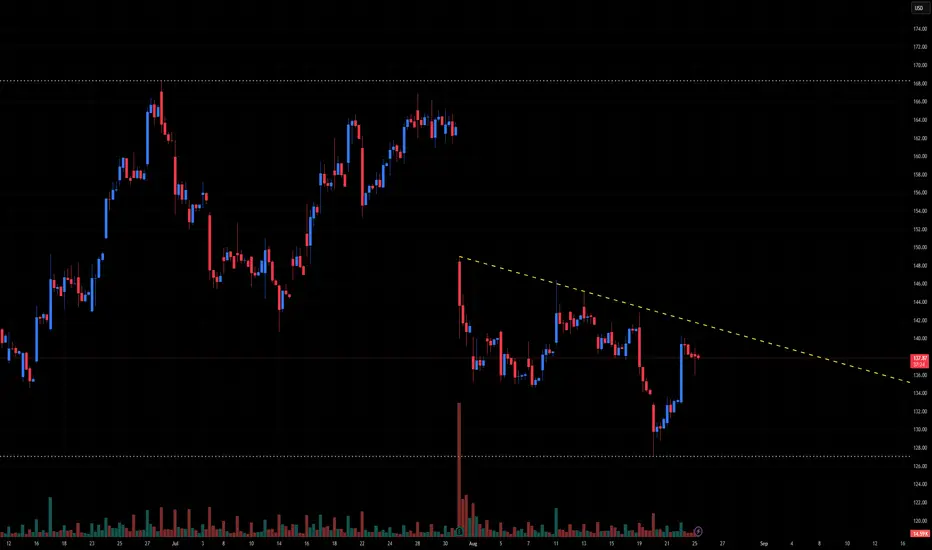
ARM Technical Outlook – Descending Trendline Pressure🖥️ ARM Technical Outlook – Descending Trendline Pressure
Ticker: ARM (Arm Holdings)
Timeframe: 30-minute candles
🔍 Current Setup
ARM is trading under a descending trendline that has capped rallies since late July. After a sharp drop from ~168, price has been consolidating between 128–144, with sellers consistently stepping in at lower highs.
Descending resistance: ~142 (falling trendline).
Support zone: ~128 (recent base).
Current price: ~138, caught in the middle of the range.
This structure signals ongoing downtrend pressure unless buyers can break above the descending resistance.
📊 Breakout Levels
🚀 Upside (Bullish Scenario)
Trigger: Break and close above 142 (descending trendline).
Intermediate Targets:
148–150 → First supply zone.
158–160 → Major resistance cluster.
Measured Move Target: ~168 (full reversal back to July breakdown).
🔻 Downside (Bearish Scenario)
Trigger: Rejection at resistance and close below 132, confirmation under 128.
Intermediate Supports:
130–128 → Key base support.
122–120 → Next demand area.
Measured Move Target: ~115 (projected from consolidation range).
📈 Volume Analysis
Volume spiked heavily on the July breakdown, confirming bearish momentum.
Current rallies are happening on lower volume, signaling weak buyer conviction.
A breakout above 142 with volume expansion would be required to shift momentum bullish.
⚖️ Probability Bias
Trend remains bearish under the descending trendline.
Bulls must reclaim 142 to flip momentum.
Otherwise, ARM risks another leg lower toward 128 → 120.
✅ Takeaway
ARM is under heavy trendline resistance and stuck in a range:
Bullish Break > 142: Targets 148 → 160 → 168
Bearish Failure < 132 / 128: Targets 122 → 115
Until a breakout occurs, expect continued sideways-to-down bias within the range.
ARM – Cup & Handle Pattern with Potential BreakoutOn ARM’s daily chart, we can see a clear Cup & Handle pattern – twice in a row – with strong upward moves following each completion.
The latest pattern completed around the $165 area, after which the stock pulled back into a healthy correction and is now consolidating in the $140–$150 range.
Technical Analysis:
Pattern: Cup & Handle with a small pullback, indicating potential re-accumulation.
Key Support: $140 (a breakdown below would weaken the setup).
Key Resistance: $150–$155 (a confirmed breakout above could trigger the next bullish leg).
Indicators:
RSI near 50 – neutral, room to move higher.
MACD in a correction phase but close to a potential bullish cross.
ADX showing temporary trend weakness but could strengthen after a breakout.
Stochastic slightly in overbought territory but not extreme.
Volume: Decreasing volume during the pullback – a healthy sign for a potential upward breakout.
Trade Plan:
Entry: On a confirmed breakout above $155 with higher-than-average volume.
Target 1: $165 (previous resistance).
Target 2: $180–$185 (depending on momentum strength).
Stop Loss: Daily close below $140.
Summary:
ARM is showing a classic bullish setup with a strong potential for another upward move. A breakout of the key resistance levels with strong volume could trigger a sharp rally, similar to the previous two bullish waves.
Arm Holdings plc Quote | Chart & Forecast SummaryKey Indicators On Trade Set Up In General
1. Push Set Up
2. Range Set Up
3. Break & Retest Set Up
Notes On Session
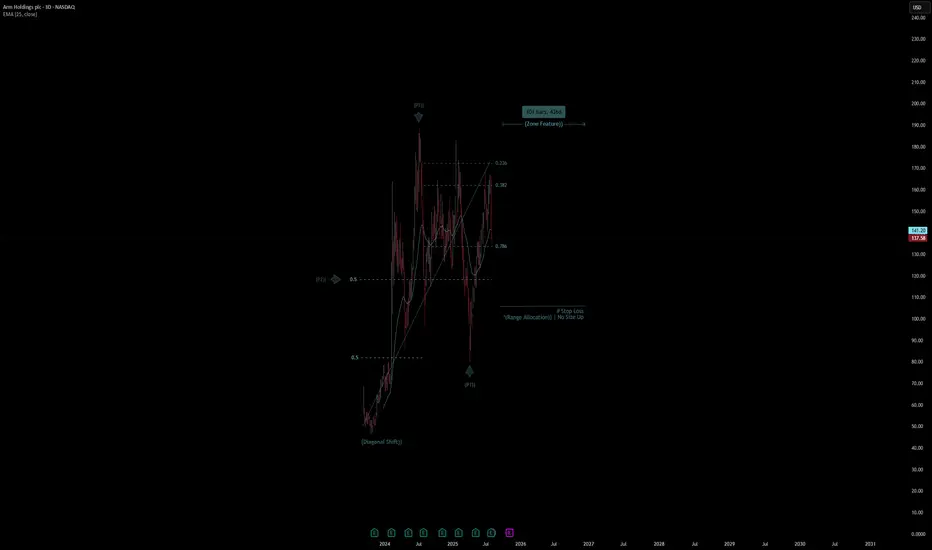
# Arm Holdings plc Quote
- Double Formation
* (Diagonal Shift)) At 50.00 USD| Subdivision 1
* (Zone Feature)) | Completed Survey
* 118 bars, 509d | Date Range Method - *(Downtrend Argument))
- Triple Formation
* (P1)) / (P2)) & (P3)) | Subdivision 2
* 3D Time Frame | Trend Settings Condition | Subdivision 3
- (Hypothesis On Entry Bias)) | Regular Settings
* Stop Loss Feature Varies Regarding To Main Entry And Can Occur Unevenly
- Position On A 1.5RR
* Stop Loss At 110.00 USD
* Entry At 138.00 USD
* Take Profit At 180.00 USD
* (Uptrend Argument)) & No Pattern Confirmation
- Continuation Pattern | Not Valid
- Reversal Pattern | Not Valid
* Ongoing Entry & (Neutral Area))
Active Sessions On Relevant Range & Elemented Probabilities;
European-Session(Upwards) - East Coast-Session(Downwards) - Asian-Session(Ranging)
Conclusion | Trade Plan Execution & Risk Management On Demand;
Overall Consensus | Buy
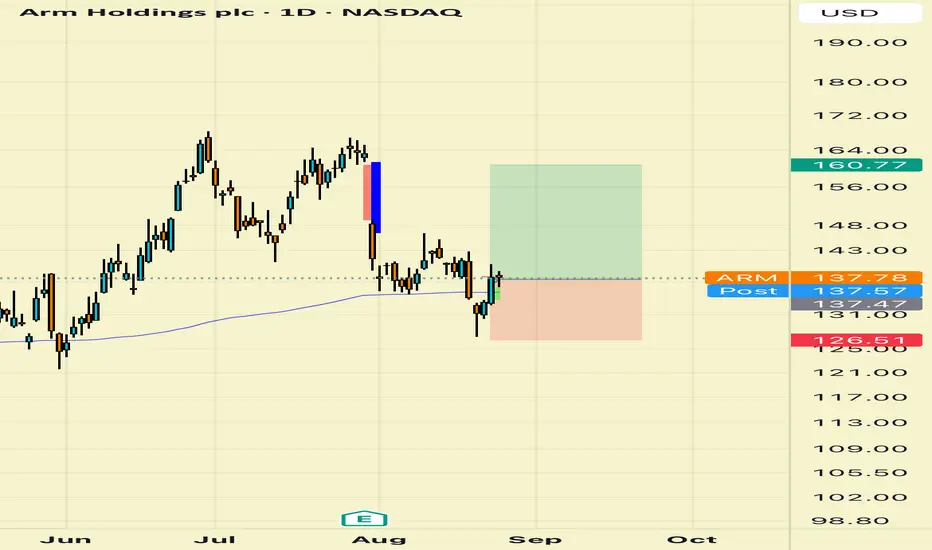
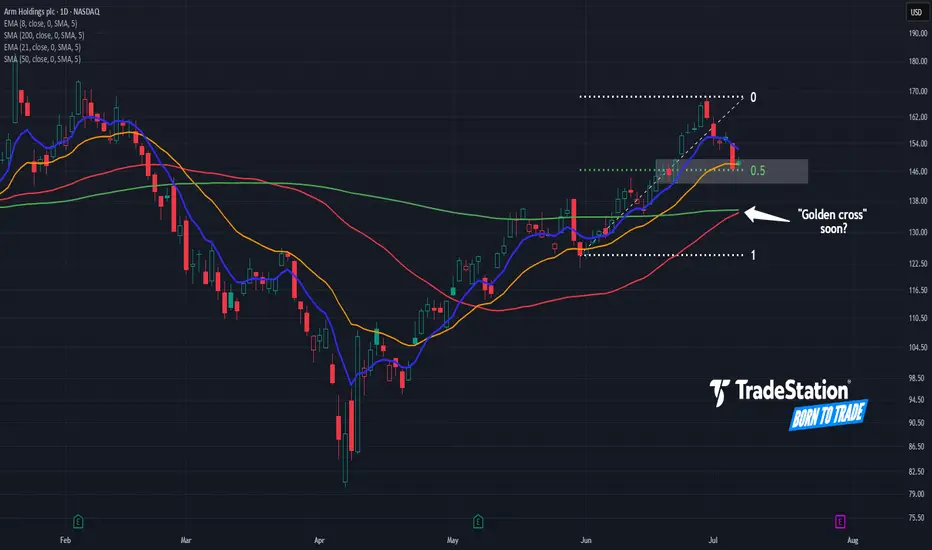
Arm Pulls BackArm Holdings rallied sharply last month, and now the AI chip stock has pulled back.
The first pattern on today’s chart is the advance from May 30 through June 30. ARM retraced half that move and is trying to bounce, which may confirm its upward direction.
Second, prices have retested their rising 21-day exponential moving average (EMA). The 8-day EMA is also above the 21-day EMA. Those signals may be consistent with short-term bullishness.
Third, the 50-day simple moving average (SMA) is nearing a potential “golden cross” above the 200-day SMA. That could reflect longer-term bullishness.
Finally, a four-session consolidation zone formed in late June between roughly $143 and $149. Will it now emerge as new support?
Check out TradingView's The Leap competition sponsored by TradeStation.
TradeStation has, for decades, advanced the trading industry, providing access to stocks, options and futures. If you're born to trade, we could be for you. See our Overview for more.
Past performance, whether actual or indicated by historical tests of strategies, is no guarantee of future performance or success. There is a possibility that you may sustain a loss equal to or greater than your entire investment regardless of which asset class you trade (equities, options or futures); therefore, you should not invest or risk money that you cannot afford to lose. Online trading is not suitable for all investors. View the document titled Characteristics and Risks of Standardized Options at www.TradeStation.com . Before trading any asset class, customers must read the relevant risk disclosure statements on www.TradeStation.com . System access and trade placement and execution may be delayed or fail due to market volatility and volume, quote delays, system and software errors, Internet traffic, outages and other factors.
Securities and futures trading is offered to self-directed customers by TradeStation Securities, Inc., a broker-dealer registered with the Securities and Exchange Commission and a futures commission merchant licensed with the Commodity Futures Trading Commission). TradeStation Securities is a member of the Financial Industry Regulatory Authority, the National Futures Association, and a number of exchanges.
TradeStation Securities, Inc. and TradeStation Technologies, Inc. are each wholly owned subsidiaries of TradeStation Group, Inc., both operating, and providing products and services, under the TradeStation brand and trademark. When applying for, or purchasing, accounts, subscriptions, products and services, it is important that you know which company you will be dealing with. Visit www.TradeStation.com for further important information explaining what this means.
ARM looking weakARM is way overvalued and the technicals don't look great.
Not the cleanest head and shoulders pattern but I see one is forming and it should be confirmed, UNLESS we bounce at the golden pocket.
I don't like the bearish diverences on the RSI, so I suspect we will continue to see this fall.
Not a whole lot more to say here, be careful with this stock. It's a great company but it's mostly owned by Softbank and when they decide to sell it will cause a massive drop in price.

6/27/25 - $arm - tf?6/27/25 :: VROCKSTAR :: NASDAQ:ARM
tf?
- narrative follows price, not the other way around
- you don't get away with billion dollar SBC (stock comp) when you hardly will pull down 2 bn in fcf in '26 (on optimistic numbers but for now - let's dream). but let's just assume 2 b is just that. a lick above 1% fcf yield.
- but V, they power the future of the world?
- lol yeah, and nvda does too and already won in their (much larger B2B vertical) and does 3+% fcf yield and grows faster and has better mgns
- so while stupid can persist as long as the casino remains open (you been to a casino lately? that's a real trip to Hades on earth.)
- so if u own this, you might want to make sure you have an edge, because if you are just drawing lines on a chart... and like 90% of other ppl on trading view that do just that i'll be polite and warn you "you don't have an edge".
- i'm a fundamentals guy. so yeah. i'm in btc, gamb and nxt. big cash. and i find hedges here in this environment.
- have a great weekend everyone.
V
