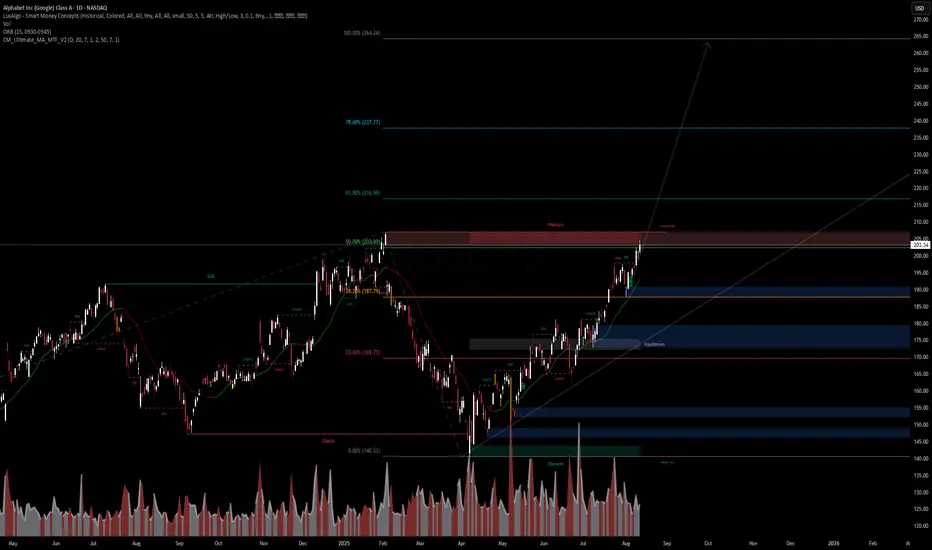
GOOGL – VolanX WatchlistPrice is pressing into a key resistance zone near the 50% retracement level, aligning with prior supply. If we see a decisive breakout and hold above this “strong map” zone, the setup starts to resemble a long-term double bottom structure—often a precursor to multi-quarter upside trends.
Volume is healthy, structure remains bullish, and the higher timeframe fib targets point toward 217, 237, and potentially 265 if momentum persists. Risk remains in the short-term if sellers defend the premium zone, but as of now, trend bias is still to the upside.
Key levels to watch:
Support: 187.7 / 175 (equilibrium)
Resistance: 206.3 (break & hold could trigger trend acceleration)
Fib extensions: 217, 237, 265
📊 VolanX Trend Rating: Bullish until proven otherwise
Disclaimer: This is not financial advice. Markets carry risk—manage accordingly.
GOOGL trade ideas
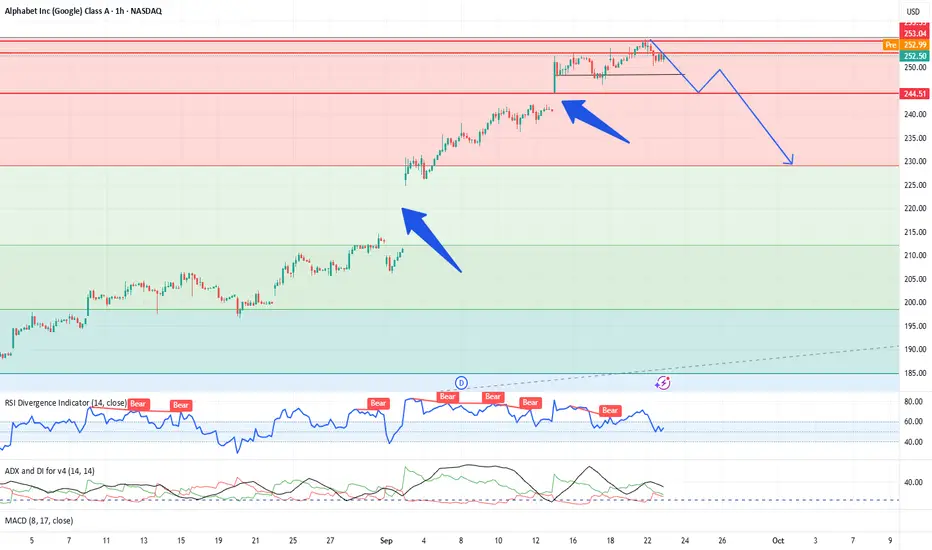
Has Google formed the TOP?Google has created two big windows on its way up to forming the all-time high (ATH). Some initial signs of profit booking have been visible on the hourly time frame. Even in the daily time frame, the low of previous day candle has been broken. Once it goes below $250 levels, weakness will creep in, and it will do down to fill the gaps with interim targets of 240 and 230 in the short term. The position short targets are around 220 levels where the initial big window was created. (For educational purposes only)
Googl bearish case- I’m feeling lucky Bearish Drivers
1. Overheating valuation – Alphabet hit $3T market cap, up ~70% since April. AI hype + regulatory relief leave it vulnerable if execution slips.
2. Heavy AI/Cloud capex – Spending up to $75B this year with cloud growth lagging, raising margin pressure concerns.
3. Reliability & security risks – June 2025 multi-product outage and rising cloud security threats highlight operational fragility.
4. Regulatory overhang – FTC probing AI chatbots; risk of forced Chrome divestiture (~35% of search rev). Antitrust scrutiny remains despite recent legal win.
5. Fragile sentiment – Rally driven by AI optimism and easing legal fears; any earnings miss or weak Gemini update could trigger sharp reversal.
Short GOOGL at $252–260, target $228–235 (with potential extension to $200–210). Bear case rests on over-optimistic sentiment, intense AI/cloud capex, reliability and security risks, and lingering regulatory/legal threats.

GOOGL Basing for Next Move – Sept 18 Trade Setup 🔍 Here’s my trader’s desk note for Alphabet (GOOGL) into Wednesday’s session, based on the 1-hour chart and GEX options data.
1️⃣ Price Action & Structure
* Tight coil: After last week’s rally to $257, GOOGL pulled back and is now pivoting near $251.5. The price is pressing against a short descending trendline—watch for a clean break.
* Upside trigger: A decisive hourly close over $252.9–254.8 sets up a retest of $257 and possibly $260.
* Support shelf: First line at $249–247, with stronger backing around $242–238.
2️⃣ GEX (Options Flow) Check
* Call magnets: Heavy gamma and call wall sit at $252.5 (≈86% call concentration), then $257.5 and $260. These can act as price magnets on strength.
* Put support: Major put zones rest at $242.5 and $237.5, keeping downside risk contained unless the market breaks lower.
* Flow profile: Calls account for about 35% of flow with IVR around 24.8, giving moderate premium costs.
3️⃣ Trading Thoughts
* Bullish scenario: Go long on an hourly close above $253. Targets $257–260, stop under $249.
* Bearish scenario: If price fails to break and slips under $247, expect a slide toward $242–238.
4️⃣ Option Angles
* Upside spread: 252.5/260 call spreads balance cost and upside potential.
* Neutral hedge: Selling puts at or below $240 is a way to collect premium if you trust the broader uptrend.
5️⃣ My View
GOOGL is quietly building energy after a strong run. A break over $253 with volume could invite a fast move to the upper-$250s. Until then, watch for a range between $247 and $253.
Disclaimer: This analysis is for educational discussion only and is not financial advice. Always do your own research and manage risk before trading.
GOOGL: Watching 250 Support for Next Leg-Swing & Scalp Sep 171-Hour Chart Technical View
Alphabet’s 1-hour chart shows a strong early-September rally followed by a controlled pullback. Price reached the $256 area and is now consolidating around $251. MACD has cooled sharply from overbought and Stoch RSI is at low levels, suggesting a near-term reset inside an intact rising channel.
* Immediate Support: $250–$251 (current consolidation floor)
* Major Support: $245 and $241.9 (previous demand zone)
* Upside Zone: $255–$257.5, with $260 as an extended target if momentum returns
The 9 EMA is still above the 21 EMA, but the gap is narrowing—watch for either a bullish bounce off $250 or a bearish cross if weakness persists.
GEX & Options Flow
Options data continues to lean constructive:
* Call Walls: $255 (2nd call wall), $257.5 (3rd call wall), and $260 (outer target).
* Put Support: $245 (largest near-term put hedge) and $242.5.
* GEX Bias: Call gamma stands near 37.2% with IVR at 28.2 (IVx ~36.3), indicating healthy option activity and moderate premium levels.
Dealers remain positioned to dampen sharp drops, supporting a buy-the-dip bias if $250 holds.
Trade Thoughts & Suggestions
* Swing Idea: Accumulate near $250–$251 with a stop below $245, targeting $255–$260 as the next upside zone.
* Scalp Idea: Use $250 as a quick dip-buy level or scalp a breakout on a decisive close above $255 with expanding volume.
* Bearish Scenario: A break below $245 would shift bias to the $241.9 and $233.4 supports.
Quick Take
GOOGL is in a healthy consolidation after a strong rally. For Sept 17, holding the $250 floor keeps the path open for a push back toward $255–$260.
Disclaimer: This analysis is for educational purposes only and does not constitute financial advice. Always do your own research and manage risk before trading.
Google Likely On SupportGOOGL is likely finding support on $174. It's following the panic trend right now as almost everything Computer/Tech has been sold deep into support bids. GOOGL finding support here along with AMZN at $214 leads to my theory IXIC is ready to break resistance.
If it fails to hold $174, then the major support at $148 should lift it back up towards it's final target (or next major support) of $252.
Good luck!

$GOOGL Tradespoon – Long Entry $240.37Tradespoon model generated long signal for NASDAQ:GOOGL . Predicted range: $240.37–$248.79. Trend: +1.82%. NASDAQ:GOOGL

GOOGL 3Hour Time frameGOOGL 3-Hour Snapshot
Current Price: $239.63
Change: +2.38% from the previous close
Market Cap: $2.13 trillion
P/E Ratio: 18.44
EPS (TTM): $9.56
Beta: 0.96
🔎 Key Levels
Resistance:
R1: $240.26 (recent high)
R2: $242.00 (next resistance zone)
Support:
S1: $236.40 (immediate support)
S2: $234.15 (next support level)
📈 Technical Indicators
RSI (14): 82.95 — Overbought, potential pullback
MACD: 9.99 — Positive momentum, but watch for divergence
Moving Averages:
5-period SMA: $228.51 — Buy signal
10-period SMA: $218.92 — Buy signal
20-period SMA: $210.54 — Buy signal
50-period SMA: $196.04 — Buy signal
📌 Market Sentiment
Recent Catalyst: U.S. judge's decision not to break up Alphabet, leading to a surge of over 6% in its shares, potentially adding more than $160 billion to its market value.
Reuters
Sector Performance: Positive momentum following recent gains and analyst upgrades.
Options Activity: Significant trading in call options at $240 strike price, indicating bullish sentiment.
📅 Outlook
Bullish Scenario: A breakout above $240.26 could lead to a push toward $242.00 and higher.
Bearish Scenario: A drop below $236.40 may test support around $234.15.
Overall Bias: Moderately bullish, with positive momentum but facing near-term resistance.

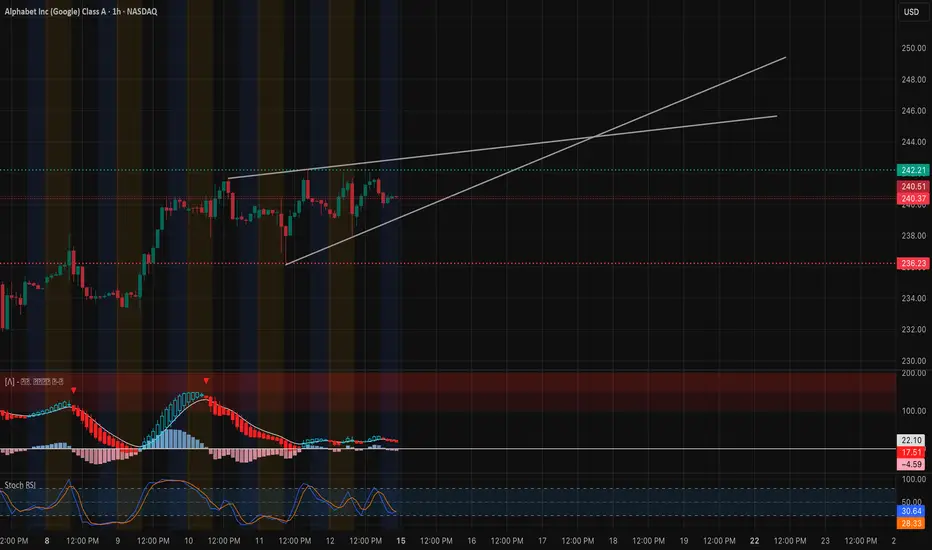
GOOGL Near Key Wedge Break — Levels to Watch for September 15
* Macro backdrop: U.S. futures are flat after a strong tech week. Traders are waiting on mid-week economic data, keeping intraday moves contained early Monday.
* Sector tone: Mega-cap tech remains resilient; Alphabet continues to draw steady option interest.
Technical Analysis – GOOGL
Trend & Structure (1-Hour Chart)
* Price is consolidating in a rising wedge between $236 and $242.
* Price action shows higher lows but frequent upper-wick rejections, hinting at indecision.
Key Levels
* Resistance: $242.2 (highest positive NETGEX / Gamma Wall), $245–247.5 (next Call/GEX zones).
* Support: $236.2 (trendline + strong put support), $233.5, $227.5 (2nd Put Wall).
Momentum & Indicators
* MACD is neutral, flattening after a brief bullish push.
* Stoch RSI is low, suggesting room to rebound if buyers return.
* Volume remains moderate, confirming a coil.
Options/GEX Insight
* Options market shows Call walls around $242–245, matching chart resistance.
* IVR 16.8 and IVx avg 30.8 indicate stable volatility and potential for a sharp move if wedge breaks.
Trade Scenarios for Sept 15
* Bullish Plan:
* Entry: Break and hold above $242.2.
* Targets: $245 → $247.5.
* Stop: Below $236.2.
* Bearish/defensive (if wedge breaks down):
* Entry: Break below $236.2.
* Targets: $233.5 → $227.5.
* Stop: Above $242.2.
Summary
Alphabet starts Monday inside a rising wedge. A decisive move above $242.2 can invite a quick run to $245–247.5, while a loss of $236.2 opens a slide toward the low $230s.
Disclaimer: This analysis is for educational purposes only and does not constitute financial advice. Always do your own research and manage risk before trading.
GOOGL 1H + GEX Game Plan for Tue, Sep 16GOOGL Riding a Steep Channel — Next Stop 255 or Cool-Off? 🚀
Market Structure (1-Hour View)
* Strong uptrend: Clean staircase move from 240 breakout to current 252–253 zone.
* Channel support: Rising base near 245–246; trendline resistance rising through 255+.
* Momentum: MACD remains bullish with expanding histogram, but Stoch RSI is near overbought (≈100)—a sign to watch for a short-term pause.
Key Levels to Watch
* Resistance: 253.0–253.5 (current lid), 255.0, then 257.5 (next major GEX wall).
* Support: 248.0–247.5, 245.0 (Gamma magnet), deeper supports at 240.8–242.1 and 237.9.
GEX Read (Sep 16)
* Highest positive NETGEX / Gamma magnet: 245.0
* 2nd Call Wall: 253.0 (~92% call concentration).
* 3rd Call Wall: 257.5 (~34% call concentration).
* Put walls / downside magnets: 235 and 232.5.
* Options sentiment: Calls ~40%, IVR ~29, IVx ~36 → Premiums moderate; options pricing fair for debit spreads.
Implication:
* Dealers may aim to pin price between 245 and 253 if flow is neutral.
* A decisive break >253 can quickly invite hedging toward 255–257.5.
* Lose 245 and price can air-pocket toward 240–235.
Trade Scenarios
1) Bullish Continuation
* Trigger: Hourly close >253.5 with volume pickup.
* Entry: 253.5–254.0 on hold/retest.
* Targets: 255.0 → 257.5.
* Stop: Below 251.5.
* Options: 255/257.5 call debit spread expiring this week.
2) Range Fade
* Trigger: Failure to hold above 253.0 with rejection wick.
* Entry: 252.8–253.2 on failed retest.
* Targets: 249.5 → 245.0 (gamma magnet).
* Stop: Above 254.5.
* Options: 253P or 252.5/245 put spread for quick move.
3) Deeper Pullback
* Trigger: Break and 1H close <245.
* Entry: 244.5–245.0 on failed retest.
* Targets: 242.1 → 237.9 (put wall).
* Stop: Back above 246.5.
* Options: 245/240 put spread for swing toward 235 if momentum accelerates.
Scalping & Swing Notes
* Early in session, expect chop around 252–253; fade or scalp only if trend confirms.
* If we gap up above 253, watch for a quick pullback to 252 for VWAP/EMA retest entry.
* Holding 245–247 keeps swing structure intact for the week.
Risk & Management
* Keep position size small near top of channel; protect profits if chasing higher.
* For options, scale out at first target and trail stops; avoid letting winners round-trip if IV collapses.
This analysis is for educational purposes only and does not constitute financial advice. Trade with a plan and manage your risk.

Google Stock Surpasses $250Alphabet’s stock has started the week with a strong bullish bias, posting a gain of more than 4% in the short term. Buying pressure has remained solid as the company surpassed $3 trillion in market capitalization for the first time and delivered strong performance in its cloud services in recent months. Both factors have reinforced investor confidence, suggesting that demand could continue to play a relevant role in the coming sessions.
Aggressive Trend
Although Alphabet had already been sustaining an uptrend for much of the year, since late June the movement has become more aggressive, allowing the price to break above the $250 mark. For now, there are no signs of a trend reversal or bearish corrections that would challenge the main structure, which remains clearly bullish. However, the recent acceleration in price action could open the door to technical pullbacks, typical in scenarios of excessive buying pressure.
Technical Indicators
RSI: The RSI currently sits well above the overbought zone (70), highlighting a market imbalance. The excess of buying momentum could lead to short-term corrections, necessary to restore balance.
TRIX: The TRIX line continues to climb above the neutral 0 level, confirming that the broader picture remains bullish. This reduces the likelihood that eventual pullbacks will result in a trend reversal, reinforcing the dominance of buying pressure.
Key Levels to Watch:
$260 – Psychological Resistance: A round number level and the next objective in the absence of historical references. A sustained breakout above this point could encourage the trend to maintain its aggressive short-term pace.
$226 – Nearby Support: The area of recent lows, serving as the first line of defense against potential short-term corrections.
$204 – Main Support: Level aligned with the Ichimoku cloud. A drop back to this area would put the current bullish structure at risk and could trigger stronger selling pressure on Alphabet’s stock.
Written by Julian Pineda, CFA – Market Analyst

I am bullish on GOOGLE stockI am bullish on GOOGLE stock
Following last week's pullback, I see a positive ride back to the all-time high (ATH) around $209 or beyond.
Trade with care.
I look forward to connecting with you.
Please share your thoughts in the comment section, share, like and follow

Alphabet Is Up Some 15% This Month. What Does Its Chart Show?Readers have likely noticed the early September breakout clocked by Google parent Alphabet NASDAQ:GOOGL , which hit an all-time intraday high this week. Can the stock's nearly 15% run so far this month continue? Let's see what technical and fundamental analysis says.
Alphabet's Fundamental Analysis
GOOGL has risen 13.9% over September's first eight sessions to hit a $242.25 intraday record high on Thursday.
Most of Alphabet's September gains came on Sept. 3, when the stock popped 9.1% after a federal judge overseeing the U.S. government's antitrust case against Alphabet NASDAQ:GOOG ruled that the firm doesn't have to sell off the Google search engine.
The court also said Google and Apple can retain a contract under which AAPL pre-loads Google's search engine onto iPhones in exchange for big payments from Alphabet.
GOOGL has risen another roughly 5% since then even though the company is still some six weeks out from its next earnings release.
Of the 45 sell-side analysts that I know of that cover the stock, 36 have revised their earnings estimates higher since the quarter began, while three have lowered their numbers. (The other six have so far left their earnings estimates unchanged.)
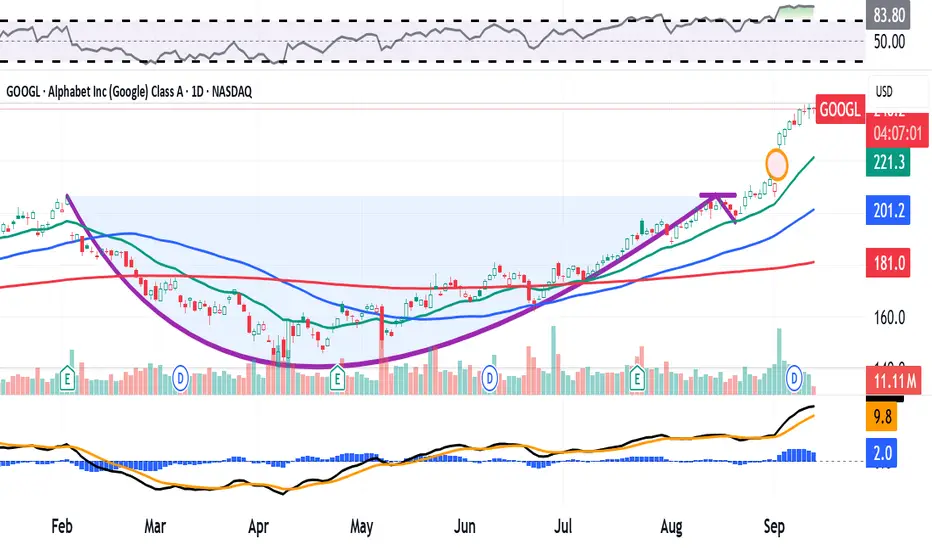
Alphabet's Technical Analysis
Now let's get down to business and take a look at GOOGL's technical breakout, as shown here in the stock's year-to-date chart through midday Tuesday:
Readers will see that from late January into August, GOOGL developed a bullish "cup-with-handle" pattern that looks like it came out of a textbook.
Marked with a purple curving line in the chart above, this pattern has a $206 pivot.
For those new to technical analysis, a cup pattern's pivot is the apex of the cup's left side. Once a handle is added, that pivot moves across to the right-side peak.
While I think that GOOGL could in theory move higher from here, I do have some concerns that are starting to nag at me.
For starters, the stock created a still-unfilled gap on the morning of Sept. 3, as denoted by the orange circle at the chart's right above. Such unfilled gaps don't have to be filled, but they often are.
That said, Alphabet's bullish technical set-up remains in place in the chart above. However, it does look like the stock's recent price surge was starting to top off in the high $230s and low $240s as I wrote this Thursday afternoon.
Meanwhile, GOOGL's Relative Strength Index (the gray line at the chart's top) is beyond merely extended. While that's a good problem for Alphabet bulls to have, it's the result of the stock's recent parabolic move and reflects a technically overbought condition.
Similarly, readers will see that Alphabet's daily Moving Average Convergence Divergence indicator (or "MACD," marked with black and gold lines and blue bars at the chart's bottom) is postured in a seemingly bullish way.
The histogram of the stock's 9-day EMA (the blue bars) is now significantly positive and has been for a number of days.
Alphabet's 12-day EMA (black line) is also well into positive territory and has crossed well above the 26-day EMA (gold line). That's also typically a bullish technical signal.
All in, GOOGL was trading at a roughly 20% premium to its 50-day Simple Moving Average (or "SMA," marked with a blue line above) and a whopping 31% premium to its 200-day SMA (the red line) as of Thursday afternoon. That's all somewhat concerning technically.
An Options Option
How might someone try to protect themselves if they're long the stock?
Consider purchasing a "protected collar."
First, buy puts that expire later than Alphabet's next expected earnings date -- say, a contract with an Oct. 24 expiration date.
The person would pay for those puts (or at least subsidize their purchase) by selling an equal-sized covered call against their long position.
Such a set-up would create a possible escape for an investor for a reduced cost through the sale of some potential excess gains.
(Moomoo Technologies Inc. Markets Commentator Stephen “Sarge” Guilfoyle was long GOOGL at the time of writing this column.)
This article discusses technical analysis, other approaches, including fundamental analysis, may offer very different views. The examples provided are for illustrative purposes only and are not intended to be reflective of the results you can expect to achieve. Specific security charts used are for illustrative purposes only and are not a recommendation, offer to sell, or a solicitation of an offer to buy any security. Past investment performance does not indicate or guarantee future success. Returns will vary, and all investments carry risks, including loss of principal. This content is also not a research report and is not intended to serve as the basis for any investment decision. The information contained in this article does not purport to be a complete description of the securities, markets, or developments referred to in this material. Moomoo and its affiliates make no representation or warranty as to the article's adequacy, completeness, accuracy or timeliness for any particular purpose of the above content. Furthermore, there is no guarantee that any statements, estimates, price targets, opinions or forecasts provided herein will prove to be correct.
Options trading is risky and not appropriate for everyone. Read the Options Disclosure Document ( j.moomoo.com ) before trading. Options are complex and you may quickly lose the entire investment. Supporting docs for any claims will be furnished upon request.
Moomoo is a financial information and trading app offered by Moomoo Technologies Inc. In the U.S., investment products and services on Moomoo are offered by Moomoo Financial Inc., Member FINRA/SIPC.
TradingView is an independent third party not affiliated with Moomoo Financial Inc., Moomoo Technologies Inc., or its affiliates. Moomoo Financial Inc. and its affiliates do not endorse, represent or warrant the completeness and accuracy of the data and information available on the TradingView platform and are not responsible for any services provided by the third-party platform.

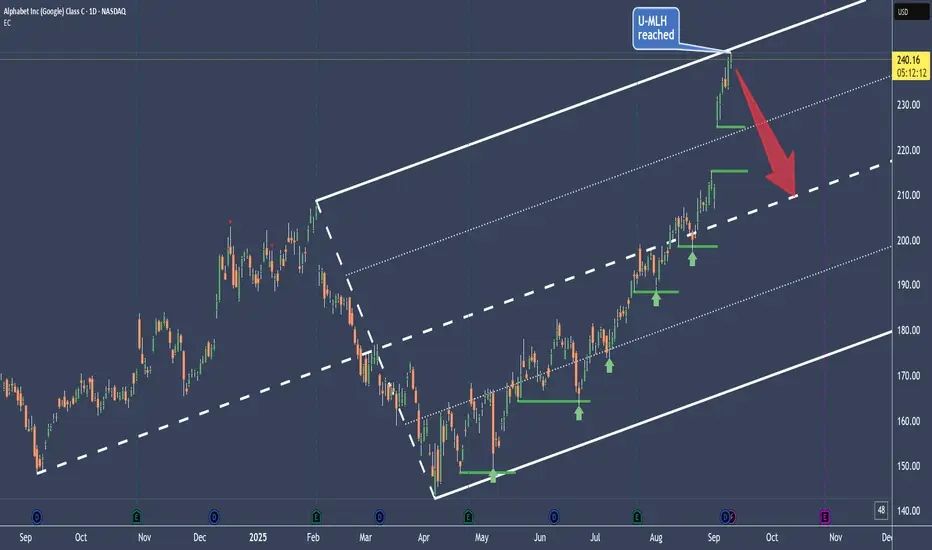
Google has reached it's stretch level👉 The rubber band is stretched 📉💥🐍
👉 Euphoria is at it's top 🚀💸🌕
👉 Greed eats brain 💰🤑👐
So, why not taking a casual short?
Let's say, with some ITM Put Options, just to define the risk?
Because if I short the UL, there's still a chance that greed and euphoria goes nuts and gaps way above the U-MLH.
So, let's give it time to mature, like a good old Whiskey §8-)
Cheers 🥃
$GOOG Momentum is slowing and the indicators presenting some overheated price action. positions may be held but better not to open new position here.

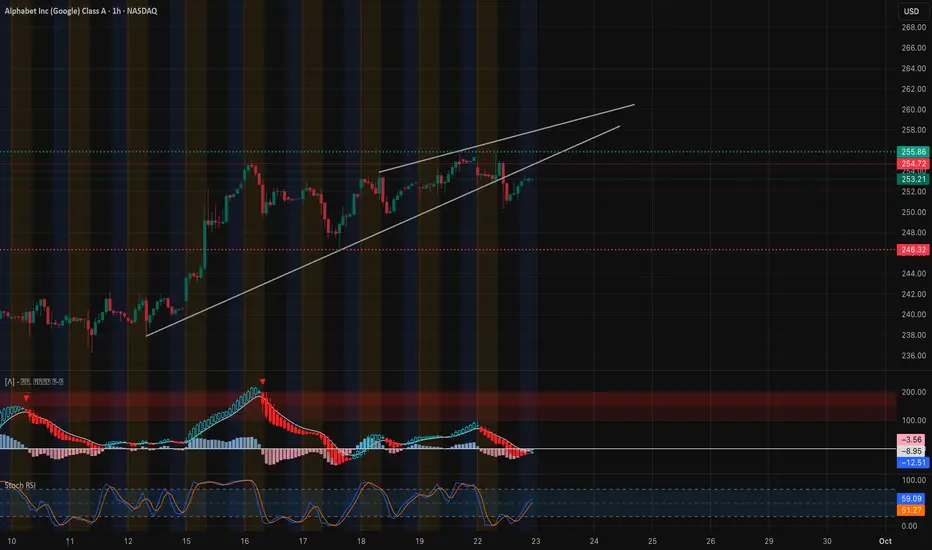
GOOGL Sep 23 – Watching 255 Break for Fresh Upside Price Action & Setup (1-Hour Chart)
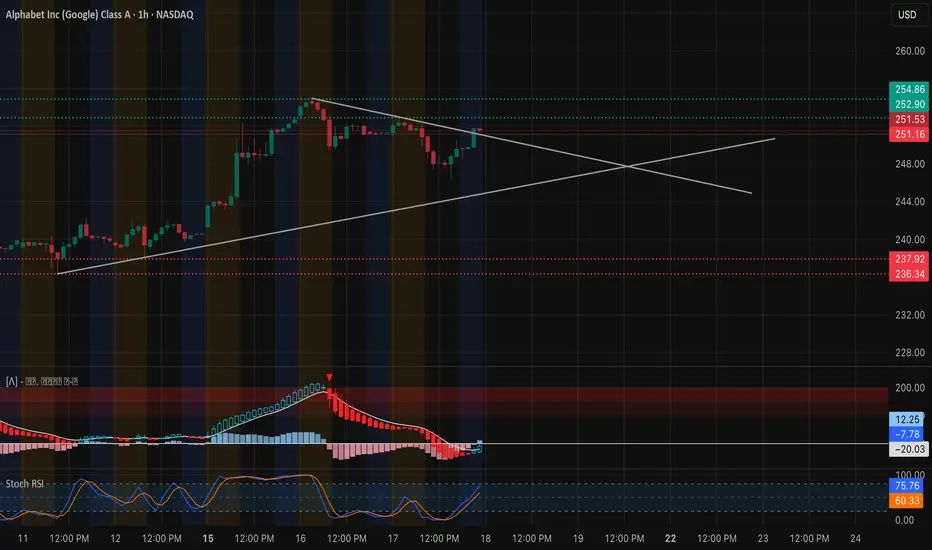
Alphabet is carving a rising wedge pattern and just bounced from the lower trendline near 250. Price is hovering around 253 and testing the mid-zone. A decisive hourly close above 255 would put the upper wedge trendline and the 257.5–260 zone in play. Support sits at 250, then 247.5, where a hard drop could quickly bring 245 into focus.
Momentum Read
MACD is recovering from a pullback and approaching a fresh crossover—constructive if confirmed. Stoch RSI is moving out of mid-range, suggesting room for a push before overbought territory.
GEX (Options Flow) Confluence
Options positioning is leaning constructive:
* Highest positive GEX / Call resistance: near 255
* 2nd Call Wall: 257.5 with 89% call concentration
* 3rd Call Wall: 262.5
* Key Put Supports: 247.5 and 245
Holding over 253 and punching through 255 would force market makers to hedge higher, creating gamma fuel toward 257.5 and 262.5.
Trading Plan
* Bullish setup: Buy a confirmed 255 break with volume. Target 257.5–262.5. Stop around 252.
* Retest entry: Bounce from 250 support with confirmation can be a conservative add.
* Bearish setup: A break below 247.5 opens room for 245 and potentially 240.
Option Angle
Short-dated calls in the 255–260 range are interesting if the 255 level flips to support. Bears can consider puts near 245 if breakdown plays out.
Bottom Line
The 255 zone is the key pivot. A breakout there can spark momentum toward 257.5–262.5. Losing 247.5 would negate the bullish setup.
Disclaimer: This is for educational discussion only and not financial advice. Always do your own research and manage risk.
$GOOG is getting expensiveNASDAQ:GOOG is trading at high earnings multiple while technicals are extended, not a combination that is appealing for entering a new position for me.

Take a bullish position on Google as price action shows momentumCurrent Price: $254.72
Direction: LONG
Targets:
- T1 = $261.00
- T2 = $267.50
Stop Levels:
- S1 = $246.50
- S2 = $241.00
**Wisdom of Professional Traders:**
This analysis synthesizes insights from thousands of market experts and professional traders who have consistently relied on momentum indicators and critical support/resistance levels to predict price movements. Leveraging the collective intelligence of traders, Google's trading setup reflects a consensus bullish outlook due to favorable technical patterns and fundamental growth drivers. As Google continues to benefit from structural tailwinds like the rise of AI and cloud-based innovations, traders see opportunities to capture upside potential despite broader macroeconomic uncertainties.
**Key Insights:**
Google's share price currently reflects both strong market positioning and optimistic sentiment surrounding its strategic growth initiatives. Analysts have flagged its continuing dominance in digital advertising and search engine markets, paired with its expanding footprint in artificial intelligence applications like Bard and generative AI tools integrated across its platforms. Major institutional players are bullish on the long-term prospects of Google's innovation pipeline, citing its impressive balance sheet and significant investment in cloud infrastructure.
From a technical standpoint, Google's price is trending above its 50- and 200-day moving averages, signaling broader market confidence and underlying strength. RSI levels suggest the stock is approaching—but not yet in—overbought territory, indicating room for further gains rather than immediate profit-taking. Combined with recent breakout patterns, traders are viewing its current price as a launchpad for higher highs.
**Recent Performance:**
Google's recent share price momentum has recovered sharply following the release of Q2 2025 earnings that outperformed market expectations. The company recorded robust year-on-year revenue growth driven by heightened demand for its cloud services, digital ads during major global events, and ongoing user engagement across Google properties. Over the past 30 days, its stock has gained approximately 5%, supported by strong volume and improving macro conditions in the tech sector.
**Expert Analysis:**
Market experts remain optimistic about Google's trajectory for the remainder of 2025. Goldman Sachs' latest rating reiterated a "Buy" stance with an updated price target north of $270, citing strong cash flow generation and strategic acquisitions solidifying its AI portfolio. Moreover, technical analysts point to recent volume upticks and breakout confirmation above resistance at $250 as a precursor to sustained upside if market sentiment continues to align favorably. While short-term volatility may arise from external macro factors like rising interest rates, Google's fundamentals remain a compelling anchor for long-term investment.
**News Impact:**
Recent announcements regarding Google's continued advances in AI have significantly bolstered its stock sentiment. The unveiling of fresh AI-driven advertising tools to counterbalance competitive pressures from Amazon and Meta have demonstrated its leadership in innovation. Furthermore, positive regulatory developments in key markets, such as its approval to expand cloud operations in Southeast Asia, are setting the stage for increased revenue diversification and growth into 2026.
**Trading Recommendation:**
Google's robust fundamentals and technical breakout patterns make it an attractive long position at its current price of $254.72. With critical support levels in place and upside price targets aligning with consensus trader optimism, investors should consider taking advantage of this momentum-driven movement. A stop-loss strategy at $246.50 minimizes downside risk, while challenges from macro factors remain manageable given Google's sustained revenue diversification. Watch for further confirmation of strength near $261 prior to breaking toward higher resistance at $267.50.
Do you want to save hours every week? Register for the free weekly update in your language!

GOOGL Sep 22 TA – “Knocking on 256: Breakout or Fakeout?”1️⃣ Big Picture on the 1-Hour Chart
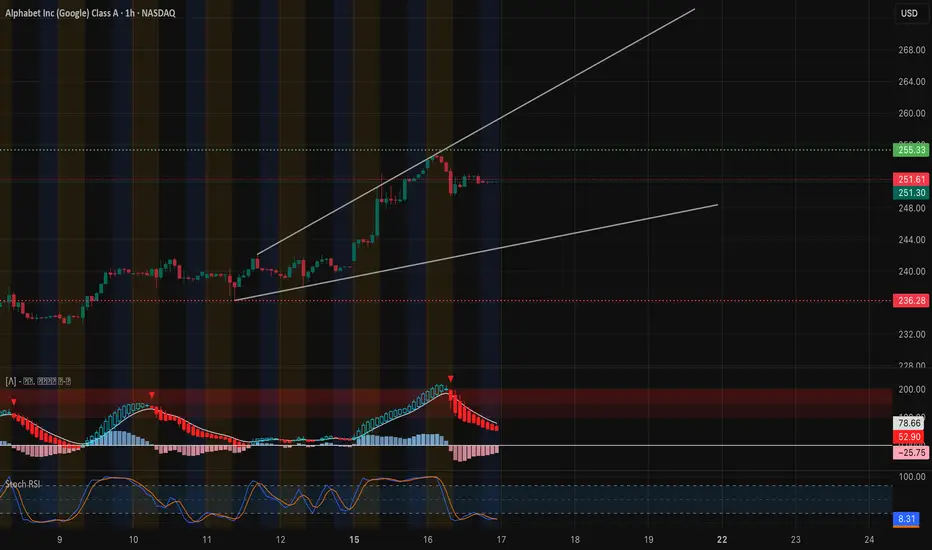
* Price action: Alphabet closed around 255.35, steadily grinding higher along a rising trendline. The stock is testing the upper end of its ascending channel and pressing against fresh resistance.
* Key levels:
* Resistance: 256–257.5 (current high and call wall)
* Support: 253.8 → 252 (recent breakout zone)
* Indicators:
* MACD is positive and still trending up, confirming steady bullish momentum.
* Stoch RSI is elevated near 90, which can hint at a short-term pullback or sideways action.
Trend remains bullish, but with momentum stretched, traders should watch for a brief cooling before another leg higher.
2️⃣ GEX / Options Flow
* Major call walls cluster at 257.5, 262, and 265, with strong gamma support near 253.8.
* Notable put support sits around 245–247.5, plus an HVL around 247.5 that could attract price if sellers take control.
* IVR is around 22, indicating moderate implied volatility and decent liquidity for options traders.
This options setup suggests market makers may try to keep GOOGL in the 252–257.5 range early in the week, with a break over 257.5 potentially unleashing momentum toward 260 and beyond.
3️⃣ Trading Thoughts & Suggestions
* Scalp / day trade: Look for a clean break and hold above 256–257.5 with strong volume. If confirmed, quick upside targets are 260 → 262.
* Support bounce: A pullback to 253.8–252 that holds can offer a low-risk entry for another run at 256+.
* Fade setup: A hard rejection at 257.5 could send price back toward 253.8 and possibly 252.
4️⃣ Bottom Line
GOOGL is pressing on major resistance with solid momentum. A decisive move above 257.5 opens the door to 260+, while failure there could lead to a healthy retest of the 253–252 area.
Disclaimer: This is just market opinion for educational discussion. It’s not financial advice. Always manage your own risk before trading.

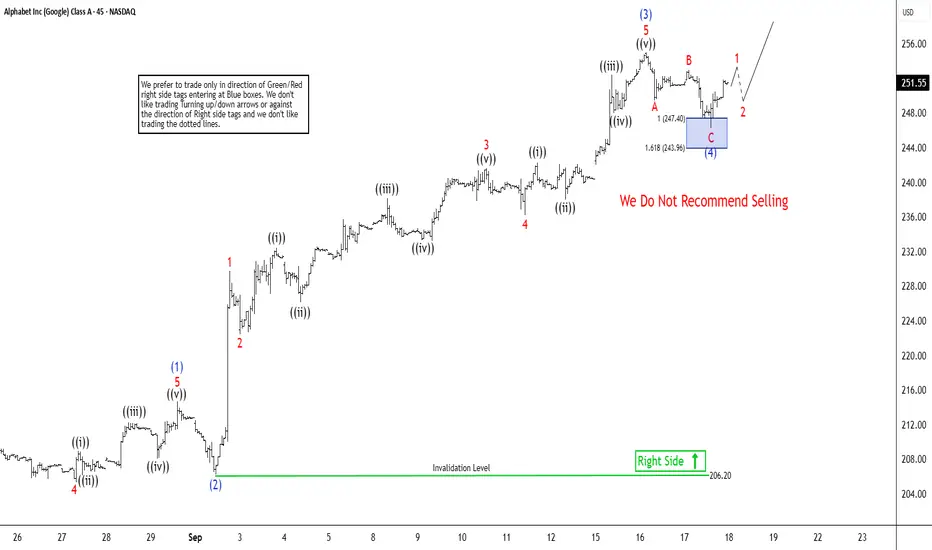
Elliott Wave Analysis: Google (GOOGL) Targets Wave (5) at $257The short-term Elliott Wave analysis for Alphabet Inc. (GOOGL) indicates that the cycle starting from the August 20, 2025 low is unfolding as a five-wave impulse. From that low, wave (1) concluded at $214.65, followed by a pullback in wave (2) that ended at $206.19. The subsequent wave (3) advanced in a five-wave impulse structure on a smaller scale. From wave (2), wave 1 peaked at $229.75, and wave 2 retraced to $222.44. The stock then surged in wave 3 to $241.66, with wave 4 correcting to $236.25.
The final leg, wave 5, reached $255, completing wave (3) on a higher degree. A pullback in wave (4) likely concluded at $246.28, structured as a zigzag. From wave (3), wave A declined to $249.47, wave B rallied to $253, and wave C fell to $246.28, finalizing wave (4). The stock has since resumed its upward trajectory in wave (5). However, it must break above the wave (3) high of $255 to eliminate the possibility of a double correction. In the near term, as long as the pivot at $206.19 holds, any pullback should find support in a 3, 7, or 11-swing sequence, setting the stage for further upside.
Alphabet (GOOGL) BUYAlphabet (GOOGL), parent of Google, owns DeepMind and Bard, two of the most advanced AI research arms in the world. With its dominant search business under threat from AI chatbots, Google has doubled down, pushing AI into advertising, cloud services, and enterprise tools.

$GOOGL .... LETS GET LOUD!!!Within the last month, we have watched NASDAQ:GOOGL get absolutely crushed, most of which has to do with a generally weak earnings report in early February. However, skepticism of this price action and investor sentiment is the only thing that should be on anyone's mind right now. One thing we know for a fact is that Google isn't going anywhere especially considering all the data they collect on their users. So why not apply this reasoning into buying the dip? To answer that, we should Look First/Then Leap ...
Here is the 4 Hour chart refencing back into September of 2024.
Let's start with the circle. The reason I have the area marked is because of the key factors in play that indicate we may possibly be bottoming out on this timeframe. Firstly, there are two lines to keep an eye on, a diagonal trendline and a horizontal price-level line. NASDAQ:GOOGL 's price action seems to obey these two levels (for whatever reason), which are coincidentally in the same area at the same time. Secondly, NASDAQ:GOOGL has just shown a rebound from the 400 EMA which also falls within this area giving a sort of "stars aligning" situation here. But the price action doesn't have to be the only thing we examine to analyze $GOOGL.
This is the MACD indicator on the 4 Hour timeframe referencing back to September of 2024.
This MACD chart shows the comparison between the last regional low for the MACD compared to the recent regional lows. Between these lows there is an interval of 76 to 78 calendar days (just over 2 and a half months) if I am not mistaken, which should strike some traders as very odd considering their similarity in distance. Amazingly, that's not even the weirdest part...
This is the combination of both charts.
How about that? Not only are the lengths between regional MACD lows similar, but NASDAQ:GOOGL 's returns between these periods are only roughly 2/3% in difference to each other. This just shows that there is more that what meets the eye when it comes to charting. Always look where others don't because that's where some keys are found.
In conclusion, I will be taking a long position on NASDAQ:GOOGL for the reasons stated above. When stars align like this, we are given no option but to act upon our rationality instead of our emotions...
