Should You Buy the Dip or Wait for the Dust to Settle?Or buy the dip of the dip?
When a pair of basketball sneakers drops 20%, we call it a bargain. When Alphabet stock NASDAQ:GOOGL drops 20%, we immediately wonder what terrible thing everyone else knows. Markets have an interesting way of changing our relationship with prices.
That's the dilemma behind one of trading's most famous pieces of advice: buy the dip.
Sometimes it works beautifully. Strong assets temporarily sell off, patient buyers step in and the long-term trend resumes. Other ti
In-depth trading ideas
GOOGL: The $363 Decision PointAlphabet (GOOGL) has spent roughly two months compressing on the 4-hour chart. It last printed 346.56, with pre-market at 348.60. The range is tight but sits well above the March low, and a large catalyst is only weeks away. The compression looks like positioning ahead of an event, not exhaustion.
The catalyst
The next major catalyst is the Q3 2026 earnings report, which is projected for late October (about October 28, unconfirmed). That is why the chart shows an earnings marker just past the
Will Google's Nuclear Bet Control Our AI Future?The Macroeconomic and Economic Realities
Alphabet recently signed a landmark 3.6 gigawatt power deal. Google partnered with Constellation Energy on October 6, 2026. The core of this transaction is a 20-year nuclear power purchase agreement. It secures 890 megawatts of new capacity from upgraded reactors on the PJM grid. Constellation will invest more than $4.3 billion to modernize 11 nuclear units across six sites. This massive capital injection stimulates the broader macroeconomy significantly
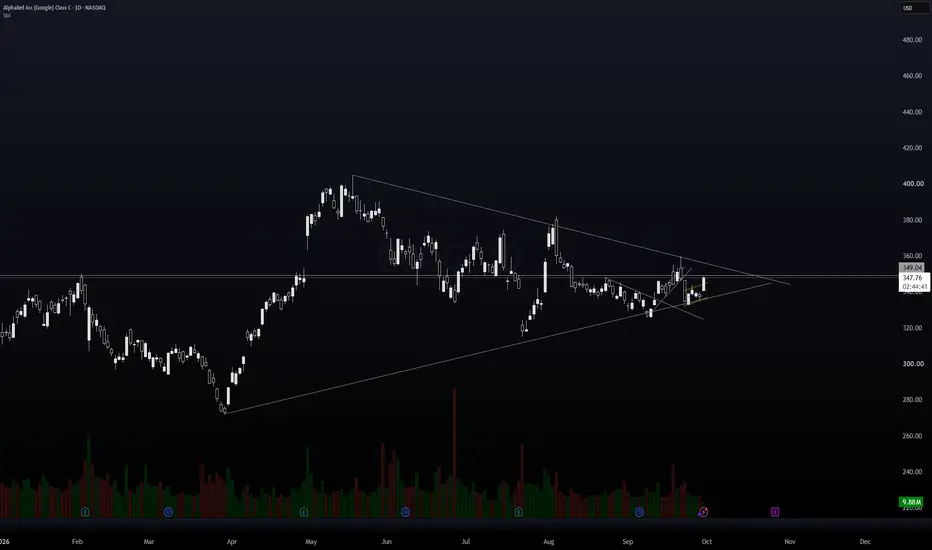
GOOGL Nearing a Triangle BreakoutNASDAQ:GOOG Price is compressing inside a large symmetrical triangle as buyers and sellers become increasingly balanced ahead of a potential directional move.
Current Price Action
-------------------------
GOOGL has spent the past several months carving out a series of lower highs and higher lows, creating a tightening structure after a strong advance earlier in the year. The recent rebound from the lower trendline shows buyers are still defending support, while repeated rejections from the de
GOOGL to $460 by end of yearGoogle should release a series of frontier models competitive with other frontier AI labs. If Meta can catch up to OpenAI and Anthropic so can Google as they control more data and resources than any company in the world.
The trendline from bottom of March 2025 tariffs scare is still intact and the price is at the bottom of the Fibonacci channel. If GOOGL goes to the same 1.0 channel high then the price will hit $460 the same price target as Wells Fargo and other analysts.
Stop price at $336 f
Alphabet (GOOGL) — Monday and Tuesday Trading Outlook | 10-12MARKET OUTLOOK: A RECOVERY APPROACHING DAILY RESISTANCE
GOOGL has rebuilt a constructive intraday trend, but the rebound is approaching the daily adaptive-average resistance cluster around $352–$353.
The preferred opportunity is a fresh, accepted recovery through $353 and that actual resistance cluster, followed by a defended retest.
A failed recovery below the local trend support offers a separate short scenario.
Positioning matters. Buying lower support without clearing the nearest daily
Cross-before-print: META +1.05% and GOOGL +1.3% off TRENDTwo names, one setup, same morning.
META ripped +1.05% in 8 minutes off the 09:30 TREND print at 730.50, running to 749.68. The 0DTE 747.5 call spiked +139% in 6 minutes.
GOOGL printed at 09:30 near 352.00 and ran to 356.50 (+1.3%) by ~09:50, topping on the 1m bear divergence. The 0DTE 355 call ran +112% in 6 minutes.
Both shared the same sequencing: the 5m SMI golden cross completed 1–2 minutes BEFORE the TREND print. The cross led, the print confirmed — same on MSFT and AAPL,
Alphabet Holds Key Support — Can Buyers Reclaim the Momentum?Market Structure
Alphabet is currently trading in a short-term consolidation on the 4-hour chart after several weeks of increased volatility. Price has repeatedly respected the lower support area while struggling to establish a sustained move above nearby resistance. The broader trend remains neutral to slightly bullish, with buyers attempting to defend higher lows but still lacking a decisive breakout.
Market Sentiment - Neutral to Moderately Bullish
Market sentiment is neutral to moderat
Alphabet (GOOGL) – Buy Signal AlertGOOGL is pulling back into a key support area after rejecting from the upper trendline. I’m watching for this correction to finish around the lower end of the channel before the next move higher.
Entry Zone: $330.75–$319.60
Stop Loss: Below $319.60
🎯 Targets
Take Half: $345.35
Final Target: $378.00
Once price reaches $345.35, I’d move the stop to breakeven and let the rest run toward the final target. There’s a chance the low is already forming, but I’m leaving room for one more move down in
GOOGLE testing its 1W MA50. Massive drop to $275 if it breaks.Google (GOOG) has been grinding on its 1W MA50 (blue trend-line) since the July 20 2026 Low, hitting it yet again last week. So far it is holding, which is a sign of strong demand there.
The 1W RSI is exhibiting however a Lower Highs Bearish Divergence against the market's Higher Highs. Every time this happened historically, Google broke its 1W MA50. Out of the 7 times the stock closed a 1W candle below its 1W MA50, 5 times it dropped more and hit at least its 1W MA100 (green trend-line). Every
Alphabet (GOOGL) — CPI-Day Decision Map | 10-14MARKET OUTLOOK: A CONSTRUCTIVE RECOVERY WITH COOLING LOCAL MOMENTUM
GOOGL retains a constructive 4H recovery and remains above its daily KAMAs, but Tuesday’s late-session trading rotated lower from $358.58. The assessment placed price inside the auction middle, where immediate entries offered less attractive positioning.
The preferred location to watch is a fresh defense near $352. Its illustrated reward only narrowly survives the cost test. No newly verified entry sequence made this an eligi
GOOGL: Can the Value Area High Hold as a Floor Until Earnings?Alphabet (GOOGL), daily chart. Fixed-range Volume Profile anchored at 2026-08-11. Levels read from the chart, approximate:
VAH ~ $348.81
POC ~ $343.81
VAL ~ $337.94
Last close: $351.66 on 2026-10-09
1. What has already happened
On 9/24 and 10/1 the daily close touched VAL and sellers could not push it lower. Both times the low of the value area held.
From there price rotated up through the value area and is now trading above VAH. The last close ($351.66) sits 0.8% above VAH and 1.5% below
Alphabet Holds Key Support — Is the Recovery Ready to Continue?Market Structure
Alphabet (GOOGL) is showing signs of rebuilding bullish momentum on the 4-hour chart after recovering from its September lows. Price has gradually shifted into a series of higher lows while approaching a key resistance zone. Although buyers have regained some control, the recent rally is now testing an important supply area where sellers have previously stepped in.
Market Sentiment - Moderately Bullish
Market sentiment is moderately bullish. Buying momentum has improved ov
GOOG: is set to continue higher.GOOG is set to continue higher ladies and gentlemen.
Weekly still Bullish and Daily ready to re-take its uptrend move.
Lets see how it closes this Weekly candle.
We want to see price above its Zero Line to start gaining momentum.
Play it right.....................Play it safe...................Play it The Numberfive Way.
Boost.....................Follow.................Share.................Comment.
Can google hit 480 by year end?With the SpaceX launch of there satellite AI test on the 1st October, and if the test is successful, then 20 more will be launched to create the first AI datacenter in space.
Surely, this will create HYPE as it is a first, and in past years, this stock usually moves in the last quarter and the Xmas Santa rally.
Alphabet Rebounds From Key Support — Can Buyers Regain Control?Market Structure
Alphabet remains in a broad range on the 4-hour chart after failing to sustain its previous breakout attempt. The recent rebound from the 336 area has improved short-term momentum, but price is still trading below the major swing highs. The market is currently transitioning from recovery to a potential trend reversal, making the next resistance zone especially important.
Market Sentiment – Neutral to Slightly Bullish
Sentiment has improved following the recent recovery, bu
GOOGL: Fibonacci Support Reclaim📊 Structural & Technical Analysis (GOOGL)
Alphabet Inc. (GOOGL) is displaying a highly constructive trend-continuation layout on the daily chart. Following a temporary corrective phase, the price action has successfully found a solid dynamic floor and is currently stabilizing, signaling that selling pressure has dried up at key structural levels. The asset is building a clear higher-low configuration, shifting the immediate bias back toward expansion.
Looking strictly at the precise Fibonacc
GOOGL – Potential Pennant Breakout SetupIt appears that GOOGL has formed a complete Pennant pattern. Price may have already broken out. However, the current price is sitting at the confluence of multiple support/resistance levels, including both the MA50 and MA200, while volume has not yet shown sufficient strength for a clean breakout. There is also Gap 1 at $333.23 in this same price zone. Therefore, there is a high probability that GOOGL will pull back to fill the gap at $333.23 before continuing the uptrend.
Entry is planned at th
Alphabet (GOOGL) Shares Slide 3.4% as Meta’s Muse MomentumShares of online advertising giant Alphabet (NASDAQ: GOOGL) fell 3.4% during the afternoon session as sentiment weakened ahead of rival Meta Platforms’ Connect conference and amid growing competitive pressure from peers Anthropic and OpenAI, both of which released cheaper frontier models.
The pullback followed early adoption of Meta’s Muse AI assistant, which surpassed 2.8 million downloads in its first 12 days, according to Apptopia data reported by Reuters. That level of early traction matter