HIMX 1D - eyes back on the screen?Himax Technologies is shaping a strong setup: after breaking above the downtrend line, the stock is now retesting the $8.70–$9.00 support zone, aligning perfectly with previous resistance and short-term EMAs. It’s a textbook breakout + retest situation.
All moving averages (MA/EMA/SMA) are below the price, confirming that buyers are in control. The bullish targets are set at $10.41 and $12.49. As long as the $8.70 level holds, the uptrend scenario stays valid.
On the fundamental side, Himax remains a key player in display driver ICs, particularly for AR/VR and automotive applications. With the growing adoption of smart displays and head-up tech, the stock could light up again.
Tactical plan: watch $8.7–9.0 carefully. If buyers hold the line - it’s showtime. If not - let the chip cool down before the next rally.
Trade ideas

HIMX | Launch This Semiconductor | LONGHimax Technologies, Inc. is a semiconductor solution provider dedicated to display imaging processing technologies. It operates through the Driver Integrated Circuit and Non-Driver Products segments. The company's products include display drivers, timing controllers, wafer level optics, video and display technology solutions, liquid crystal over silicon silicon, complementary metal-oxide semiconductor image sensor, and power integrated circuit. Its products used in TVs, laptops, monitors, mobile phones, tablets, digital cameras, car navigation, virtual reality (VR) devices and many other consumer electronics devices. Himax Technologies was founded by Biing Seng Wu and Jordan Wu on June 12, 2001 and is headquartered in Tainan, Taiwan.

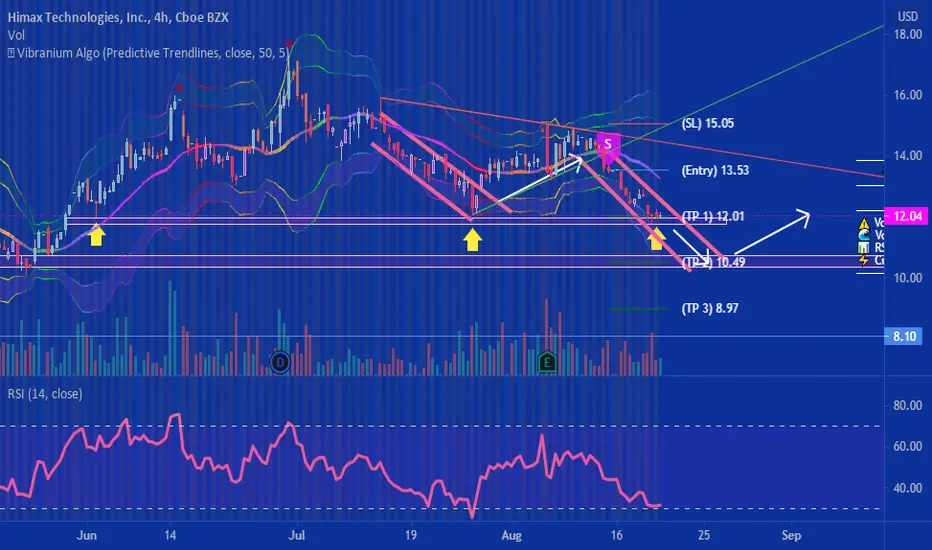
A Penny Stock, HIMX, Long setupHello Traders,
Here is a penny stock from our system to share with you.
Please see the stop loss and buy zone on chart. Free target or at Fib. levels above.
Penny Stock is highly risky, please do your own research before investing.
The purpose of this post is for education only.
If you like our post, you are welcome to share it with your friends.
Enjoy!

HIMX RunningIn looking at HIMX, and seeing the overall market is trending as well as the Technology Sector is been trending long for the past 3 months and then finding this stock that has been trending for the past quarter all aligns with the idea that HIMX could be able to continue the bullish trend. In looking back at the past we are crossing into previous support and resistance zones. There is some strong VWAP in the $6.76 area and in the $10.72 area. I have marked each of these on the chart. If it breaks through the $7.60 support and resistance line, then it will most likely make it to the targets above that point. If it breaks below the $6.35 target it could continue to fall to the $4.90 range.

The semiconductor company approaching demand3.4-3.5 will be my area of interest. And will target 18 and 28.

HIMX Harmonic: Monthly Bat PatternHimax Technologies, Inc. is a semiconductor solution provider dedicated to image display processing technologies. Himax has a moderate quantitative fundamental score (Greater than 5) with good analyst prospects (Buy and Hold ratings). Furthermore, Himax has a decent dividend pay out @ 1.24 per share/year (18.8%). Therefore, this Himax long play has deep-value at this price-level (6.61).
In this idea, we have a bat-pattern reversing on low-volume and two price targets. I set the stop-loss for 3.33%; however, I'd consider averaging into a position on this trade, if price goes below the stop (I don't expect it to). Once the 0.382 target is acquired, I will sell half of my position and set the stop-loss to trail the position by the 'Average True Range'. Once price has reached the 0.618 target, I will sell the other half of my position. The first target nets 48.3% and the second target nets 95%. Averaging these percentage gains out and adding for the dividend (I expect to hold this for at least one year), one would profit approximately 90.45% of their original investment.
Good luck and trade safely!


HIMX Buy on a U shaped recovery with 2.46 risk/reward ratioOn the 29th of July, $HIMX gapped down after lowering its guidance and paying a dividend. I entered a long at $7 a share yesterday and am targetting a trade to fill the gap. $HIMX has just broken above its pivot area around 6 - 7, making it a strong level of support, and has shown a flat and wide U-shaped recovery, which is very bullish as it shows strong buying power is coming in, which was confirmed on the 13th of July when large volume caused a 6.4% increase in the stock's price, showing that volume has shifted to being more bull sided.
The nearest pivot point on the upside is around 8.75, giving this trade a high risk/reward ratio of 2.46. I am targetting a profit of 24.5%, with a stop loss at 10%.

HIMAX Technologies Long - 8 Jul 2022HIMAX Technologies Long
Entry: 6.65
Take profit: 12.19
Stop loss: 4.98
Risk/reward: 3.32

Himax Macro looks Incredibly Bullish. +100% TargetsUsing Elliot wave and fib retracements.
Himex is definitely in a bull run having drastically growing earnings and in the booming semi conductor industry. I think this one will perform well all 2022 with technicals pointed out on the chart.


HIMX LongTrendline Break
At Support Zone
11/4 earning
Entry 10.5
Stop 9.5
Target 16.3
Risk management is much more important than a good entry point.
The max Risk of each plan should be less than 1% of an account.
I am not a PRO trader. I trade option to test my trading plan with small cost.

HIMX BreakoutHIMX - Nice laggard in the semi sector
Entry - 11.20
Stop - 10.40
Profit target - 12.64 2:1 risk to reward
Profit target - 14.63 4:1 risk to reward.

QuickTradeStop at 9.85
I will accept some consolidation for few candles.
Higher highs but even a previous "strong" lower low, which makes it few risky.

HIMX swing tradeEdited for price targets. My last chart didn't have them identified clearly.
Please see the colored trend lines.
Stop loss for me is going to be $9.75.
If it falls below $9.90 or so then the next support wouldn't show up until $6 or $7. That's where there was last buying volume.
Cheers.

HIMX swing ideaI decided to take another look at HIMX on the technical level because fundamentally, this a great company and it offers some fantastic price action, plus I saw a few bullish sweep alerts, you can see the volume coming in on those further dated strikes. The volume is also high when compared to the open interest, again only on certain strikes/expiry. NASDAQ:HIMX
This is a simple swing trade.
My stop loss is $9.75.
Lot's of 20-30% moves in a short period of time.
The price has been respecting this channel it trades in, a high of around $14.00 - $16.00 and a low of where we are about now. I plan to swing it back to the $12.00/$13.00/$14.00 range.
I really like this company so I will probably exercise one or two of those contracts, they pay a dividend and my thoughts are that HIMX will trade in sympathy with the china tech and e-commerce, even though it's Taiwanese, it get's the kind of the reg-fear and volatility you see with the former. They also pay a dividend at a rate of 2.57% and a PE of 5.42 is almost free compared to most stocks.
Compare MCHP at 89 P/E and MX trading at only 12x. By the way MX chart looks like a very similar price fade in a similar way HIMX did. If semi conductors are strong the rest of the week I think we'll see HIMX start making it's move up the top of the channel.
Please share your thoughts, I'm more than obliged to hear them.


Khan's Handelskontor - KW 39 - Swing Trade Idea 3 - $HIMXPlayed this before with a lot of success.
Recent beat down alongside other semi-conductor companies – I am still very bullish and see this as a good entry. Wait if it can hold the support/seeing buying pressure

$HIMX Bottom Fishing - Support @ 200 Day MA?I've had my eye on the Semiconductor name for awhile now. I decided to do a little bottom fishing with what I think is a very low risk entry. This bounced off the 200 DMA today and I'm looking for it to hold and continue to bounce. If not I'm out on a close below LOD which would also be under the rising 200DMA. This is a very small position as it is " bottom fishing." Who knows where the bottom may be?
This has also been basing for about 206 days now or almost 7 months. As the old saying goes: (paraphrasing) the longer the sideways move the bigger the breakout / breakdown move. Ideas, not investing / trading advice.

HIMX big make it or break areaHIMX at a big support area! if we break below this important support at 11.80 look for a quick move down to 10-10.5. then we could look for a bounce off support. A break of the tight trendline its currently in will send us higher. im neutral until 1, the trendline breaks (bullish) support breaks
(beairsh) goodluck :)

HIMX is moving into the upper end of a large base.HIMX is moving into the upper range of a 6-month base. The bigger the base the higher in space...or words to that effect. Also, it's post-earnings which is nice.
