Netflix future moves on one hour frame based on my analysis on geometry trading here is how I see Netflix will do in the near future on one hour time frame
thanks
NFLX trade ideas

New Setup : NFLXThe current pullback should be over after the most recend crossover.
We are ready to catch both actions, but right now the bullish scenario is more plausible.
Ready !

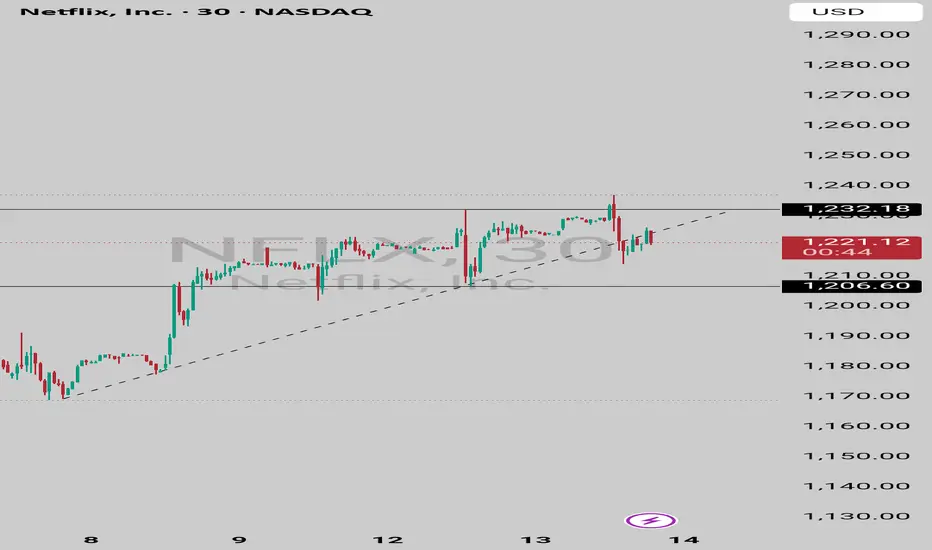
(Netflix, Inc. – 2H timeframe, NASDAQ)(Netflix, Inc. – 2H timeframe, NASDAQ),
Current price: ~1245 USD
Breakout zone: 1240–1245 USD (holding above support now)
First target: ~1292 USD
Second target: ~1340 USD
📈 So, my chart suggests:
Immediate target: 1290–1295 USD
Extended target: 1340 USD if momentum continues

NFLX is coasting right into the earnings drop zoneI'm taking a chill pill and watching to see what price will do at this area. This is where the post earning drop happened. Are we strengthening to ride higher or nah?
Neutral eye looking for bearish setups myself. What about you?

NFLXNot looking good in my opinion its already breakdown the trendline. Also we have support below this trendline maybe it gonna retest it and bounce again.
Netflix Bullish StanceBreaking above the $1,200 psychological level
Strong earnings growth (47% YoY for Q2)
Technical indicators supporting the bullish stance (Alligator, Stochastic crossover, pSAR)
Key Fibonacci levels providing support and resistance targets
Positive volume pattern suggesting accumulation

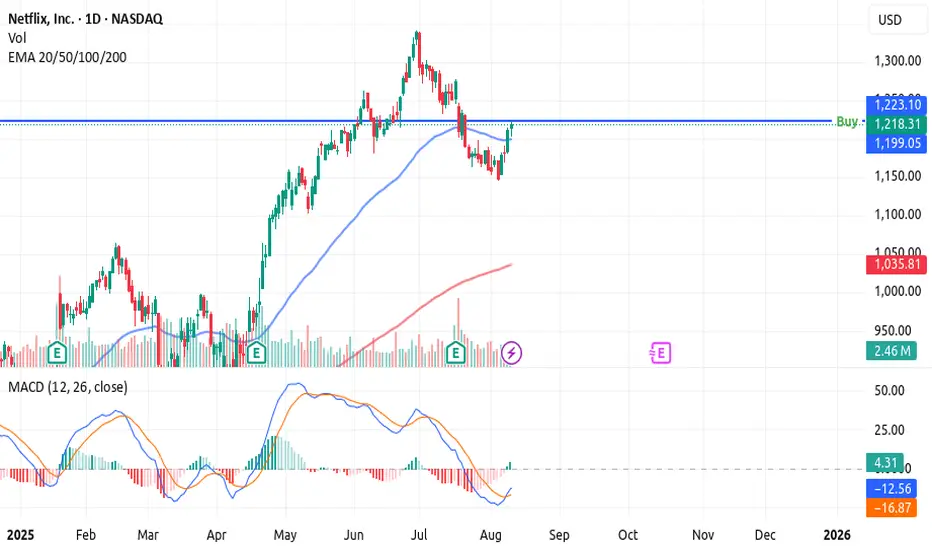
This is A 3 Month Move Using This 3-Step StrategyThis is a 3 month move that you need to prepare for.
But you have to remember something.
Volatility is a must.
Even if you try to be as accurate as possible.
Yes i know you want to make money the safe way which is okay.
But you have to account for risk.
This is why risk management is very important when it
comes to trading the financial markets.
In this chart you will notice the MACD indicator.
This indicator is used for long term trading.
How? By using the rocket booster strategy
which has the following steps:
1-The price has to be above the 50 EMA
2-The price has to be above the 200 EMA
3-The price should have a catalyst
In this case the catalyst is the earnings report
which is due in about 3months from this entry.
This means that this is a 3 month trading strategy.
In order to learn more rocket boost this content right now.
Disclaimer:Trading is risky please learn risk management
and profit taking strategies.Also feel free to use a simulation
trading account before you trade with real money.
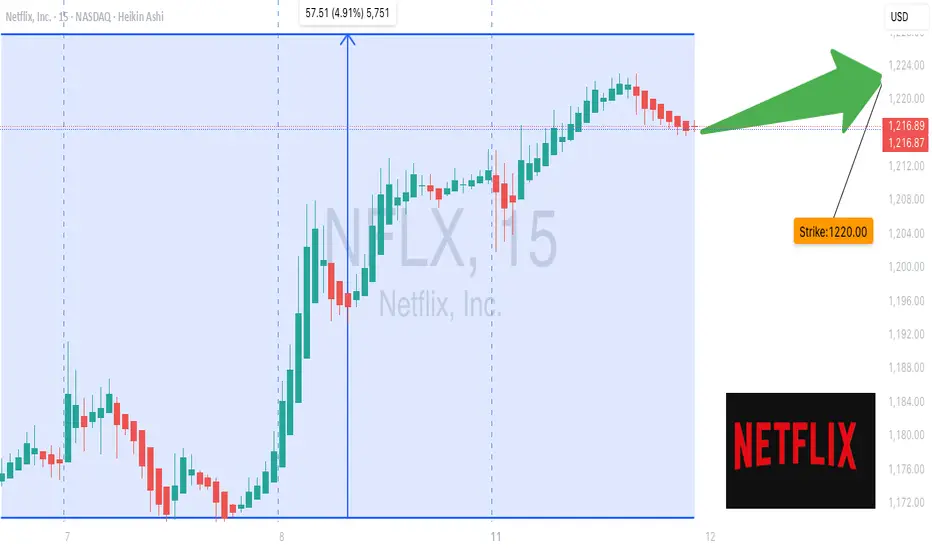
NFLX Weekly Bullish Play – $1220 Calls Poised for a 50% Pop!
🚀 **NFLX WEEKLY TRADE IDEA – AUG 11, 2025** 🚀
**Sentiment:** 📈 *Moderate Weekly Bullish* – Rising Daily & Weekly RSI + Favorable VIX setup.
**Caution:** Weak institutional volume → Watch for false breakouts.
💡 **Trade Setup**:
* **Direction:** CALL (Long)
* **Strike:** \$1220
* **Expiry:** Aug 15, 2025
* **Entry:** \$12.50 or better
* **Profit Target:** \$18.75 (+50%)
* **Stop Loss:** \$6.25 (-50%)
* **Confidence:** 70%
* **Reason:** Multiple AI models agree on upside momentum despite volume weakness.
⚠️ **Risks**:
* 4DTE → High theta decay risk.
* Low volume may slow momentum.
📊 **All 5 Models Agree:**
* RSI climbing on daily & weekly.
* Favorable volatility conditions.
* Call option plays dominate.
---
🔥 *Plan your entries, respect your stops.*
📌 **#NFLX #OptionsTrading #SwingTrade #StockMarket**
NFLX LongBroader Market Structure (NFLX 15M):
NFLX transitioned from a clear downtrend marked by consistent lower highs and lower lows into a bullish structure after a Change of Character (CHoCH) at $1168.81. This shift was reinforced by a strong rally producing consecutive higher highs and higher lows, confirming that buyers have taken control. The recent structural breaks point toward continuation to the upside unless the most recent higher low is taken out.
Supply and Demand Analysis:
The supply zone between $1232–1240 has previously caused a sharp sell-off, showing that sellers were aggressive here, making it a strong resistance to watch. The demand zone around $1192–1200 is fresh and untested, formed after buyers stepped in with strength during the latest rally, suggesting it could serve as a solid support if retested. Lower demand levels between $1155–1165 and $1144–1148 were key springboard zones during the reversal and remain secondary supports if deeper retracements occur.
Price Action Within Marked Region:
Price is currently pushing toward the supply zone, showing strong bullish candles with minimal wicks, suggesting momentum is with buyers. The projection on the chart indicates a possible pullback into $1192–1200 before attempting a break into the $1232–1240 supply. This aligns with healthy bullish structure behavior—retracing to demand before continuation.
Current Trade Bias & Outlook:
The bias is bullish, with an expected short-term pullback followed by a continuation toward the upper supply zone. The invalidation level for this outlook would be a break and close below $1190, which would compromise the most recent higher low and weaken bullish conviction.
Momentum & Candlestick Behavior:
Momentum clearly favors buyers, with impulsive upward moves and shallow pullbacks. No signs of exhaustion or major reversal patterns have formed yet, supporting the continuation scenario.

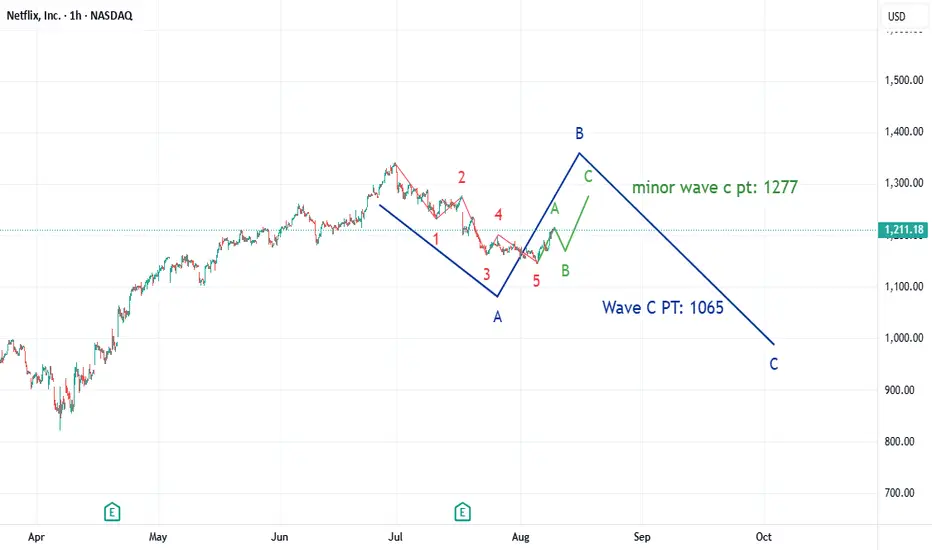
NFLX: ABC CorrectionNFLX is forming an abc corrective wave into a larger Wave B structure. Expecting a retracement to as low as $1170 for minor wave b, then a launch up to $1277 for a gap fill. From there, we should see 5 waves down to Feb 18 high of $1065
NFLX CRACK!!Classic breakdown move from a rising F flag!
Massive Head and shoulders formed, that head test followed through, taking out stops, and now failing off the top of the channel.
Screaming CAUTION to the bulls!
Nice simple short setup for bears.
Click boost, follow, and subscribe. Let's get to 5,000 followers. ))

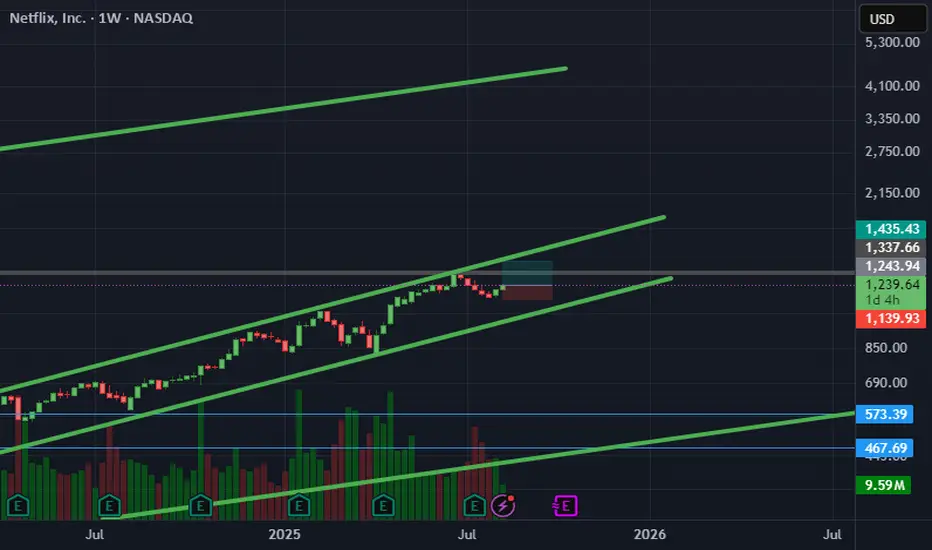
NFLX Correction setting the stage for a bigger moveNFLX is still in a correction, but the long-term uptrend remains intact. There are two scenarios for how this pullback could end: either it stabilizes around 1150 and starts to turn higher from here, or it dips closer to the stronger support near 1050 before reversing. In both cases, the uptrend toward 1500 stays in play as long as price holds above 1000.

On Watch NetflixThe hourly sees a new bullish ATR Break, while attempting to create a bullish crossover.
On The daily, while the scenario is still bearish on the very short term, the ema 9 is testing the 50d.

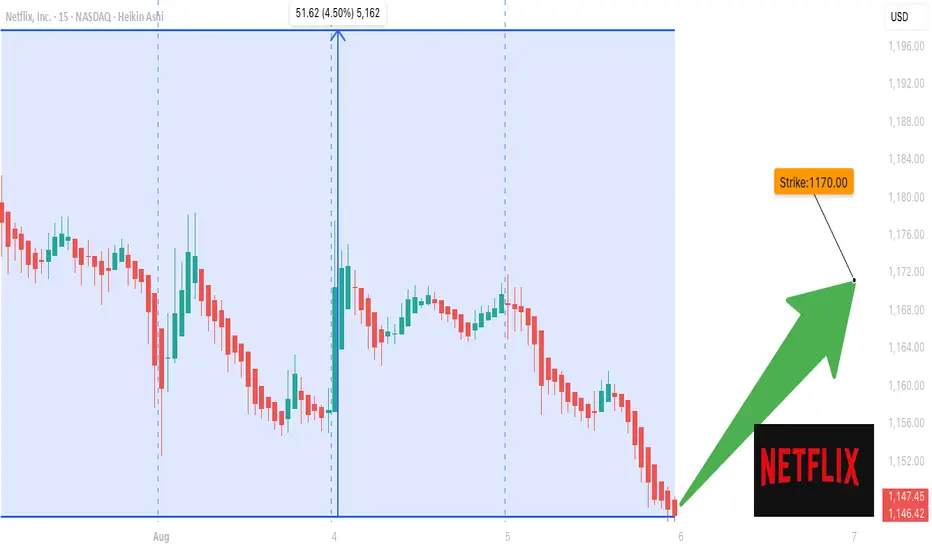
Netflix Options Flash Green – $1170 Target in Sight?
## 🚨 NFLX Options Alert: Quiet Volume, Loud Calls 🚨
**Earnings Loom, Institutions Lean Bullish** 💥
🔹 **Models Align:** 4 out of 5 models flash *Moderate Bullish*
🔹 **RSI**: Daily (35.6) cooling off, Weekly (56.1) still rising
🔹 **Call/Put Ratio**: 1.47 → Bullish positioning building
🔹 **VIX**: At 17.9, IV environment favors options buyers
🔹 **Volume Weakness**: Institution hesitation = key risk
### 📈 TRADE IDEA:
🎯 **NFLX \$1170 Call**
💵 Entry: \$11.80 | 🎯 Target: \$17.70 | 🛑 Stop: \$4.70
📆 Expiry: 2025-08-08 | ⚖️ Confidence: 65%
💡 *Enter at market open. Position size small. Event risk high.*
> “Volume is low, but flow is glowing.”
> Could this be *the* earnings week breakout?
---
### 🏷 Hashtags for Viral Reach:
`#NFLX #OptionsFlow #EarningsTrade #TechStocks #UnusualOptionsActivity #Netflix #TradingSignals #CallOptions #WeeklySetup #TradingViewIdeas`
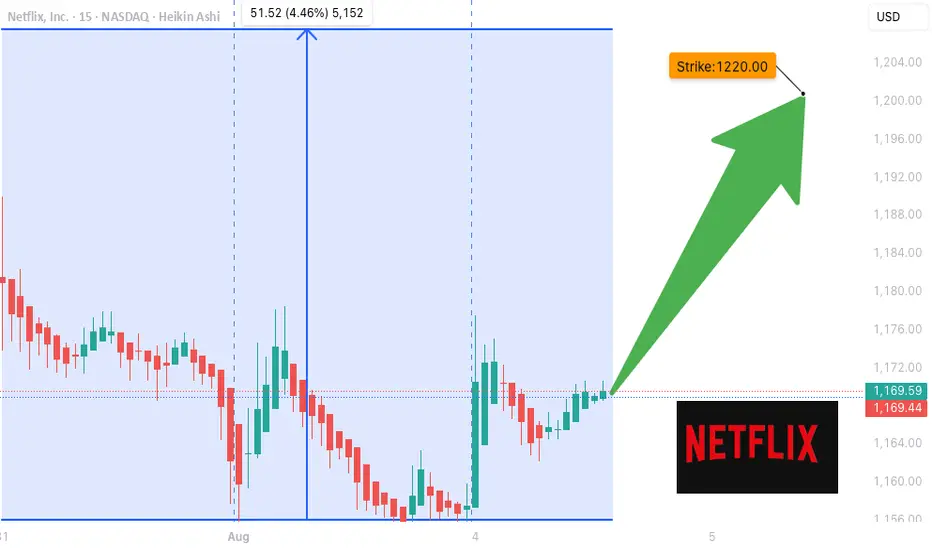
NFLX Wait For Break Out Fibo Level
## 📈 \ NASDAQ:NFLX WEEKLY TRADE IDEA (AUG 5–9)
**🔥 BULLISH FLOW | CALL/PUT RATIO: 1.84 | CONFIDENCE: 65%**
---
### 🧠 AI-DRIVEN SENTIMENT
* **Weekly RSI**: 54.9 ✅ (Bullish Momentum)
* **Daily RSI**: 38.4 ↗️ (Climbing but still weak)
* **Volume**: 📉 0.7x last week = Low institutional follow-through
* **Options Flow**: Massive call buying = Institutions lean bullish
* **Volatility**: VIX at 18.2 = Option-friendly zone
---
### 🛠️ TRADE SETUP
| 🔹 | Trade Type | Long Call |
| -- | --------------- | ------------------- |
| 🎯 | **Strike** | **\$1200** |
| 📅 | **Expiry** | **Aug 8 (Fri)** |
| 💵 | **Entry** | **\$4.05** |
| 📈 | **Target** | **\$6.00 – \$8.00** |
| 🛑 | **Stop** | **\$2.50** |
| 🔐 | **Size** | 1 contract |
| ⚖️ | **Risk/Reward** | \~1:2 |
---
### ⚠️ RISK CHECK
* 🔸 Daily RSI still < 45 — needs breakout for full confirmation
* 🔸 Volume not convincing — watch for fakeouts
* 🔸 Short expiry = 🔥 gamma risk
---
### 🧩 STRATEGY INSIGHT
> "Call buyers are in. RSI is rising. But volume is soft. You’re early — not late."
🎯 Enter @ Open
🚀 Target quick momentum pop
👀 Exit if RSI fails to break or macro hits
---
💬 **Plan to enter?** Comment “IN”
🔁 Repost if you're tracking NFLX
📊 Follow for more AI-synced trades
Unsustainable GrowthMy buy zones are below, as we approach the 1.618 extension this insane wave looks like it may out of steam soon. As a best-guess approach I will wait for the 0.618 price or go look for another stock if that doesn't materialize

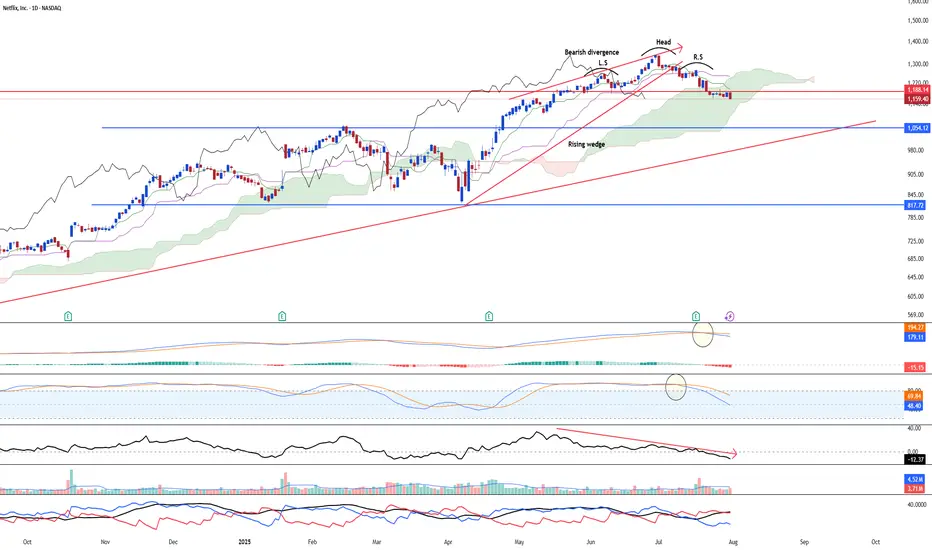
Turning the side for NetflixNetflix NASDAQ:NFLX may go through some serious correction soon after the stock rallied a lot till the high of 1337. Furthermore, the stock has confirmed the head and shoulder reversal with the latest bearish candle rejecting the neckline resistance @ 1188.14. Furthermore, the bearish divergence has been on since 19 May 2025.
Long-term MACD has performed a bearish crossover at the top and histogram is negative.
Stochastic Oscillator has confirmed the overbought signal.
23-period ROC turns negative and forms a bearish divergence. Directional movement index saw increased bearish trend strength signal.
Target is at 1054 in the near-term
NFLX RANGEIs NFLX aiming the top of the range (1190-1197)? Currently not breaking down below 1162. It's the end of July and things may be getting hot! For the next play :)
Fed Powell speaking at 2/2:30p today. I think it's expected that his words may move the market. We may just range some more. I will assess how we close.

NFLX Short1. Market Structure Overview
The broader market structure has shifted bearish following a Change of Character (CHoCH) around 1277.42, where price broke below a prior higher low, suggesting a possible trend reversal. This was later confirmed by multiple Breaks of Structure (BOS) at lower levels, especially the key BOS at 1162.8, which solidified bearish intent. Each BOS has been followed by continued selling, showing strong bearish momentum and weakening buyer control.
2. Supply and Demand Zones
Several major supply zones (resistance) are present, especially at 1340–1330, 1300–1290, 1277–1260, and most immediately at 1185–1175, where price is currently reacting. These zones have previously shown strong rejections and are likely to cap bullish retracements.
On the demand side (support), the primary demand zone lies at 1130–1110, which acted as a prior accumulation base. A deeper demand area also exists near 1100–1090, which could serve as a last-resort support if price breaks lower.
3. Price Action Within Key Border
Currently, price is hovering around 1173.99, inside the lower supply zone of 1185–1175. The structure suggests a potential short-term retracement to this zone before continuation lower. If price rejects here again, the expectation is for a move toward the 1130–1110 demand zone. However, a strong breakout and hold above 1185 could open the path for retesting higher supply levels like 1225–1245.

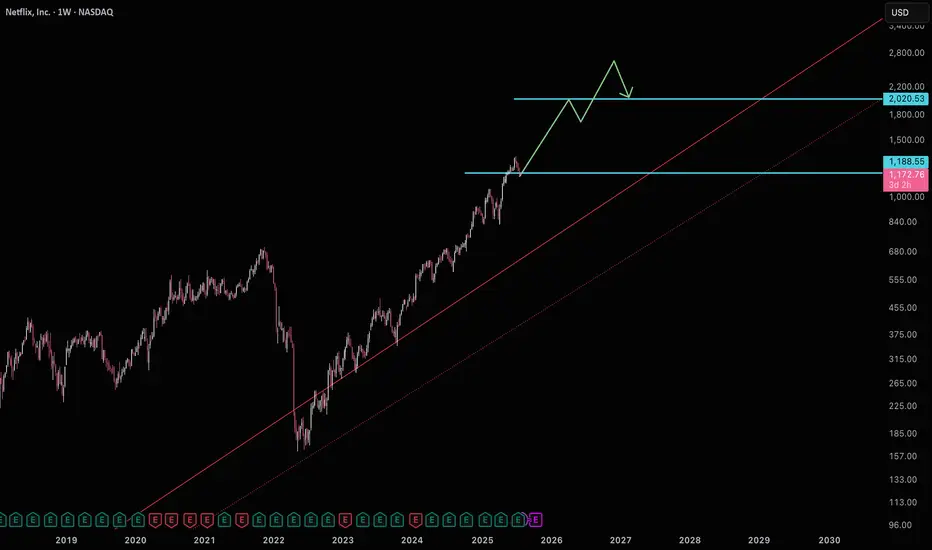
Netflix building support for $2000Netflix is currently sitting on support getting ready for a move to $2000.
Good luck!
NFLX WEEKLY OPTIONS TRADE (07/28/2025)**🎬 NFLX WEEKLY OPTIONS TRADE (07/28/2025) 🎬**
**Institutions Are Buying Calls – Should You?**
---
📈 **Momentum Breakdown:**
* **Daily RSI:** Mixed ➡️ Possible short-term weakness
* **Weekly RSI:** Bullish bias intact ✅
🔥 Overall = **Moderate Bullish** trend confirmed on the **weekly timeframe**
📊 **Options Flow:**
* **Call/Put Ratio:** **2.23** 🚨
💼 Strong institutional call flow = **bullish bias** from big money
* **Strike Ideas from Models:**
* \$1260 (Grok/xAI)
* \$1230 (Gemini/Google)
* \$1220 (Meta)
* ✅ **\$1200** (Consensus Strike)
🧨 **Volume Warning:**
* 📉 Institutional participation is **lower than average**
* 🚫 Could signal weak follow-through or fading interest
---
🧠 **AI Model Consensus (Grok / Gemini / Claude / Meta / DeepSeek):**
✅ Call buying favored across the board
✅ Weekly bullish momentum confirmed
⚠️ Daily RSI & low volume = headwinds
📌 Play it smart: momentum’s real, but conviction isn’t maxed
---
💥 **RECOMMENDED TRADE (65% Confidence):**
🎯 **Play:** Buy CALL Option
* **Strike:** \$1200
* **Expiry:** 2025-08-01
* **Entry:** \~\$8.50
* **Profit Target:** \$16.00 → \$17.00
* **Stop Loss:** \$5.10
📆 Entry Timing: Monday market open
📏 Position Size: Risk-managed (2-4% portfolio)
---
⚠️ **RISK CHECKLIST:**
* 🟡 **Volume Fragility:** Institutions not fully loading
* 🟥 **Gamma Risk:** Expiry this week = possible sharp swings
* 🔴 **Daily RSI Divergence:** Short-term weakness still possible
---
📌 **TRADE DETAILS (JSON Format for Automation):**
```json
{
"instrument": "NFLX",
"direction": "call",
"strike": 1200.0,
"expiry": "2025-08-01",
"confidence": 0.65,
"profit_target": 16.00,
"stop_loss": 5.10,
"size": 1,
"entry_price": 8.50,
"entry_timing": "open",
"signal_publish_time": "2025-08-01 09:30:00 UTC-04:00"
}
```
---
**TL;DR:**
🟢 Weekly bullish setup with strong options flow
🟡 Daily weakness = proceed with discipline
🎯 \ NASDAQ:NFLX \$1200C for short-term momentum upside
💬 Are you following the institutions or fading the low volume?
\#NFLX #OptionsFlow #AITrading #WeeklySetup #InstitutionalMoney #TechStocks #UnusualOptionsActivity #TradingView #MomentumTrading

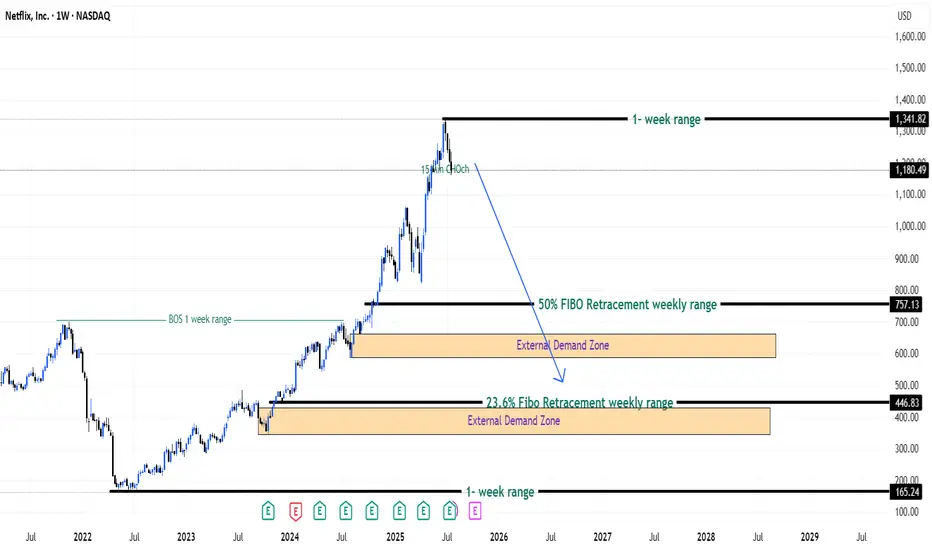
Bulls Quit? Bears Ready! - Netflix Stock (USA) - {27/07/2025}Educational Analysis says that Netflix (USA Stock) may give trend Trading opportunities from this range, according to my technical analysis.
Broker - NA
So, my analysis is based on a top-down approach from weekly to trend range to internal trend range.
So my analysis comprises of two structures: 1) Break of structure on weekly range and 2) Trading Range to fill the remaining fair value gap
Let's see what this Stock brings to the table for us in the future.
DISCLAIMER:-
This is not an entry signal. THIS IS FOR EDUCATIONAL PURPOSES ONLY.
I HAVE NO CONCERNS WITH YOUR PROFITS OR LOSS,
Happy Trading,
Stocks & Commodities TradeAnalysis.
My Analysis is:-
Short term trend may be go to the external demand zone.
Long term trend breaks the new high after going from discount zone.