NVDA bearish rising wedge for right shoulder (the bear thesis)It looks like we’re just shy of a breakout confirmation this rising wedge which in itself might be only a right shoulder of head and shoulders top. Time will tell if this setup plays out or gets canceled out.
Trade ideas

NVDA Swing Trade – Overbought Reversal Setup (June 12, 2025)📉 NVDA Swing Trade – Overbought Reversal Setup (June 12, 2025)
Ticker: NASDAQ:NVDA | Bias: 🔻 Moderately Bearish
Strategy: Short-Term Swing | Timeframe: ~2 weeks
Confidence: 75% | Entry Timing: Market Open
Expiry: June 27, 2025
🔍 Market & Technical Snapshot
• Price: ~$144.67
• Trend: Weekly and M15 uptrend still intact
• RSI (Daily): ~70.63 → Overbought
• MACD: Bearish crossover on Daily
• Options Data:
– Heavy put OI at $140 (14,803 contracts)
– Max pain at $135 → potential pull lower
– High call OI at $145–$150 caps upside
🧠 AI Model Breakdown
🔼 Grok/xAI (Bullish Swing):
• Calls out strong technicals, 5-min momentum
• Suggests $155C for upside play
🔽 DeepSeek (Bearish Swing – Preferred):
• Overbought daily RSI + bearish MACD
• Strong put volume + options market pressure
• Targets pullback to $138–$140 → PUT @ $140
✅ Recommended Trade Setup
🎯 Direction: PUT
📍 Strike: $140
📅 Expiry: 2025-06-27
💵 Entry Price: $2.09
🎯 Profit Target: $3.10 (+48%)
🛑 Stop Loss: $1.25 (–40%)
📈 Confidence: 75%
📏 Size: 1 contract
⏰ Entry Timing: Market Open
⚠️ Risk Considerations
• Weekly chart still bullish → risk of trend continuation
• Low VIX (17.26) = slower option premium movement
• Positive news surprise could cause upside gap
• Use tight risk controls and monitor intraday structure
💭 NASDAQ:NVDA : Extended or just gearing up for another breakout?
📉 Drop your play below — Put buyers vs. breakout chasers 👇

NVIDIA (NVDA) investors should knowHello NVIDIA (NVDA) investors,
Looking at the daily chart below, we see that NVDA briefly broke out of its long‑standing yellow descending channel only to be pulled back in; price is now testing horizontal support in the $100–150 range. In the lower pane, RSI remains negative and has yet to break its downtrend line around the 41 level.
Technical Analysis
Descending Channel:
The stock has been trading inside a long‑term descending channel. Selling pushed it back inside after a false breakout near $137–142. The upper channel line sits around $115—until we see a daily close above that, a true trend reversal is unlikely.
Horizontal Support/Resistance:
Support: $95-100 (confluence of past lows and the channel’s lower boundary)
Resistance: $147-150 (channel upper line), then $145–150 (early‑April highs)
RSI:
Currently ~41. A break above the RSI downtrend near 45–50 would signal improving momentum; if it fails, we could retest oversold territory.
Fundamental & Macro Factors
Quarterly Results:
NVDA reported strong revenue and margin growth last quarter, driven primarily by AI/data‑center demand.
AI & Data‑Center Demand:
Demand from AI‑focused servers and cloud providers remains very high, and this secular trend is expected to persist.
Trump’s Latest Tariffs:
In early March 2025, an additional %145 tariff on China‑origin semiconductors was announced. This measure may raise NVDA’s export costs to China and exert short‑term margin pressure. It also risks demand swings as Chinese buyers adjust their inventory strategies.
Strategic Recommendations
Stop‑Loss:
Consider a stop‑loss on daily closes below $90 to protect long positions.
Position Sizing:
Scale into longs near support, and take profits incrementally near resistance.
Tariff Watch:
Monitor any further U.S. export restrictions or tariff changes on China—each announcement can drive volatility
-Celil Adıgüzel

Nvidia - The breakout will eventually follow!Nvidia - NASDAQ:NVDA - will break out soon:
(click chart above to see the in depth analysis👆🏻)
Over the course of the past couple of days, we saw a quite strong rally of +50% on Nvidia. Considering the market cap of this company, such a move is quite impressive. Following this overall very strong bullish momentum, an all time high breakout is quite likely to happen soon.
Levels to watch: $150
Keep your long term vision!
Philip (BasicTrading)

NVIDIA stock : (Inverted H&S) We are confirmed bullish📈 NVIDIA Stock Analysis: Bullish Reversal Ahead! 🚀
🔍 Overview:
Today, we’re analyzing NVIDIA's stock chart, which presents a powerful inverse head and shoulders pattern—a classic bullish reversal signal!
🛠 Key Components of the Pattern:
- 🫳 Left Shoulder: Formed after a downtrend.
- 🧠 Head: The lowest point, indicating strong support.
- 🫴 Right Shoulder: Shows buyers stepping in, confirming momentum shift.
- 📏 Neckline Breakout: If price crosses this resistance level with volume, we expect an upward movement!
📊 Technical Details:
- 📉 Current Price: $144.78
- 🔝 Resistance Levels: $160.00, $152.77, $148.60
- 📉 Support Levels: $131.46, $121.08, $110.00
- 📢 Volume: 125.83M, validating market sentiment.
📈 Expected Market Behavior:
If NVIDIA maintains momentum above the neckline, traders could anticipate further price appreciation 💰✨. Strong volume will confirm the trend, making it an attractive opportunity!
🧐 Final Takeaway:
This bullish pattern suggests that investors might consider strategic entries 📊💡. Whether holding or entering positions, keeping an eye on market reaction & volume is key!

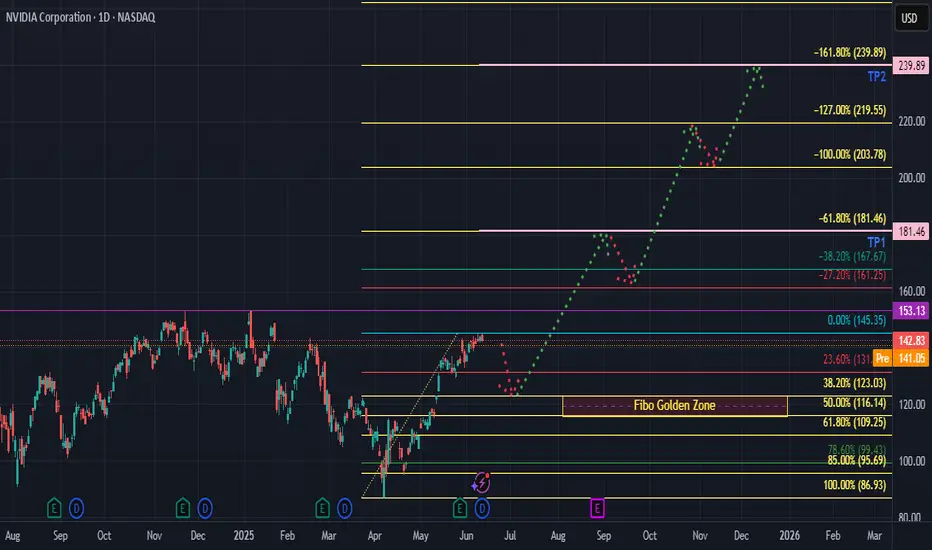
NVDA Daily 12th JuneI draw Fibonacci retracement and specified Fib Golden Zone. I believe that the price may drop to 38% Fib level, after which it will be ready to move towards the TPs.
AI Chip Stocks NVDA and AMD Showing 5 Wave RiseNASDAQ:NVDA and NASDAQ:AMD are both showing 5 wave rise in weekly chart after a correction in WXY. I haven't checked but other AI related stocks also might be doing something similar.
Once the 5 waves are over, we can expect some correction but the 5-wave rise post a correction typically signals fresh uptrend so it might be worth keeping an eye on these stocks. Waiting till retracement/correction of this rise is complete.

Is NVDA Building Strength Before a Breakout?After cooling off from its $150 highs, NVIDIA (NVDA) is consolidating in the $140–$145 zone. While some traders fear the AI hype has peaked, others see this as the calm before another rally. With solid fundamentals, continued leadership in AI, and strong institutional backing, NVDA remains a name to watch closely.
🎯 Trade Setup:
Entry Points
✅ $142 – Current price zone (speculative buy)
✅ $135–$130 – Strong support (ideal swing entry)
✅ $125 (only if market-wide pullback occurs)
Profit Targets
📈 TP1: $149 – All-time high retest
🚀 TP2: $160 – Extension target
💰 TP3: $175+ – Long-term bullish scenario if momentum returns
💡 Strategy: This is a “buy-the-dip, trade-the-breakout” setup. Wait for confirmation above $146 if you're conservative, or accumulate gradually into weakness with a clear risk plan.
📌 Disclaimer: This is not financial advice. Always do your own research and use proper risk management. I'm sharing my personal view for educational purposes.

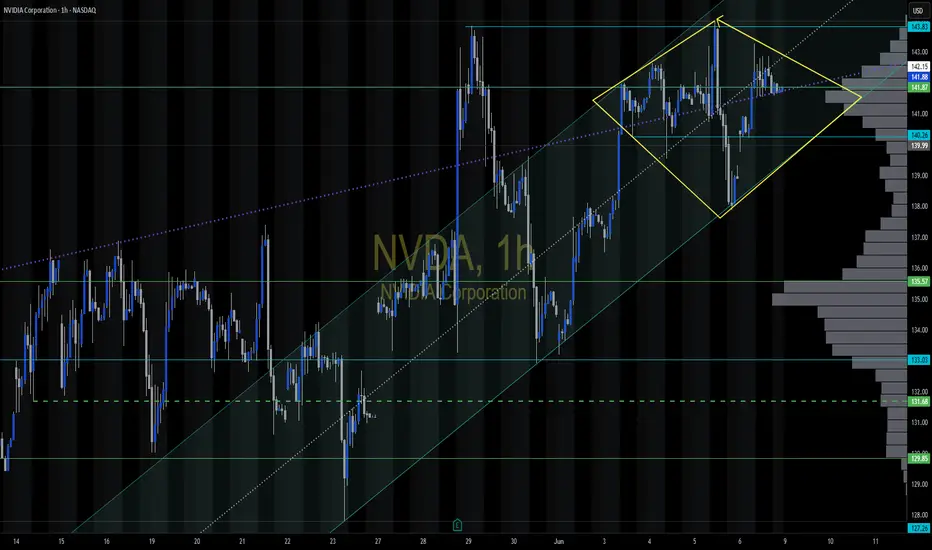
NVDA 145+?If Nvda break and hold 145 then 146 , 147 , 149 and HOY. Inv H&S on the hourly. My opinion only.

How to see other users positions on an asset - Long vs Short Want a quick way to be able to see what others are thinking about an asset - whether they are long or short - and perhaps even which users are making the best calls?
TradingView has it built in with a couple of button clicks :)

NVDA $148 VS $139 NVDA competing at the moment with bullish momentum dominating. am looking for rebound tomorrow from where it is to determine after ORB if price will head to next key level at $148 where previous buy and sell orders were withheld. If price fails to utilize this key level at $143 you can expect a quick cash grab for $139 with continuation to my level imbalance of $131 as mentioned before. Both key levels will be retested at some point. But for now, looking up with the trend.

BUY NVDABUY NVDA at 108.00 to 99.00, riding it back up to 142.00 to 151.00 as Profit Targets, Stop Loss is at 86.00!
If anyone likes mumbo jumbo long garbage analysis, than this is NOT for you.
Also, if you are afraid of risk, failure, and want only a 100% sure thing, than
run as fast as you can from the markets, because it is definitely NOT for you.
WARNING: This is just my opinion of the market and its only for journaling purpose. This information and any publication here are NOT meant to be, and do NOT constitute, financial, investment, trading, or other types of advice or recommendations. Trading any market instrument is a RISKY business, so do your own due diligence, and trade at your own risk. You can loose all of your money and much more.


keep an eye on 144.80 !boost and follow for more!💖
NVDA is hitting my bullish targets a mentioned in my last update from early April🎯, now watching my final short term price target of 144.80, if this can break and hold this week then a rally to new ATH/175-200 should follow.
if we reject here then a dip to 124-132 should come before the upside continues.

NVDA ThoughtsThis is not financial advice just my charting on NVDA maybe in correct just learning and sharing thoughts. If you ca help or see some thins i can include plz comment below here to learn

$NVDASame thing as $AMD. Daily bands are very tight. NASDAQ:NVDA Leading the market today 2.07% with AMEX:SPY breakeven 0.06%. China & US meeting today.

NVDA Support and Resistance Lines Valid from June 1 to 30Overview:
These purple lines act as Support and resistance lines when the price moves into these lines from the bottom or the top direction. Based on the direction of the price movement one can take long or short entries.
Trading Timeframes
I usually use 30min candlesticks to swing trade options by holding 2-3 days max. Anyone can also use 3hr or 4hrs to do 2 weeks max swing trades for massive up or down movements.
I post these 1st week of every month and are valid till the end of the month.

NVDIANVDIA will not back down until 158-160 level is reached. Wait for setup and aim for the target.
Disclosure: We are part of Trade Nation's Influencer program and receive a monthly fee for using their TradingView charts in our analysis.

Nvidia could be worth $220 by this time next yearThe amount of money this company is making is insane and it doesn't look like its going to slow down any time soon. There is strong demand for Nvidia products universally there is no limit to how far this thing will go. Over the past 5 years it has outperformed Bitcoin, need I say more?
I am abit late to be buying into the rally but I will keep accumulating should the market provide me with ample opportunities. I think this is a fantastic growth stock for a diversified portfolio and I think Nvidia is one of the top dogs of todays economic eco system.
Despite the fact it looks expensive the stock is actually still under valued. The range of the intrinsic value is between $110 - $240. I do not recommend going all in FOMO but this thing is going up, I have done some research and it is a fantastic company to work for everyone says they love working there and they pay their employees well.
They continue to innovate and pave the way forward for semi conductor tech. I love my Nvidia chip in my laptop I can only imagine what the more expensive chips are capable of. Nvidia and Broadcom make up about 15% of my portfolio. Thank you for reading my article and please comment if you want to talk about stocks. Have a great day.
NVDA Possible Diamond TopNVDA Possible Diamond Top inside this channel, pay attention to this area of consolidation should be a big move after words.
NvdaRising wedge just like Qqq, Spy, and most of tech sectors...
Price should begin the decline down to 112.00 with a pit stop first at 128 or 200ma ..
I expect a dead cat bounce there back to 134 before the next leg down
As you can see here looking at the Chip sector SMH
You have a similar Rising wedge at .236 fib.
And you can also see that .236 has been a brick wall for a year.
Zoom in close at SMH and you'll see friday finished with a reversal candle
Daily RSI Confirms
Either wait for a break below 139.00 or short anything over 140 with a stop above 145.00..

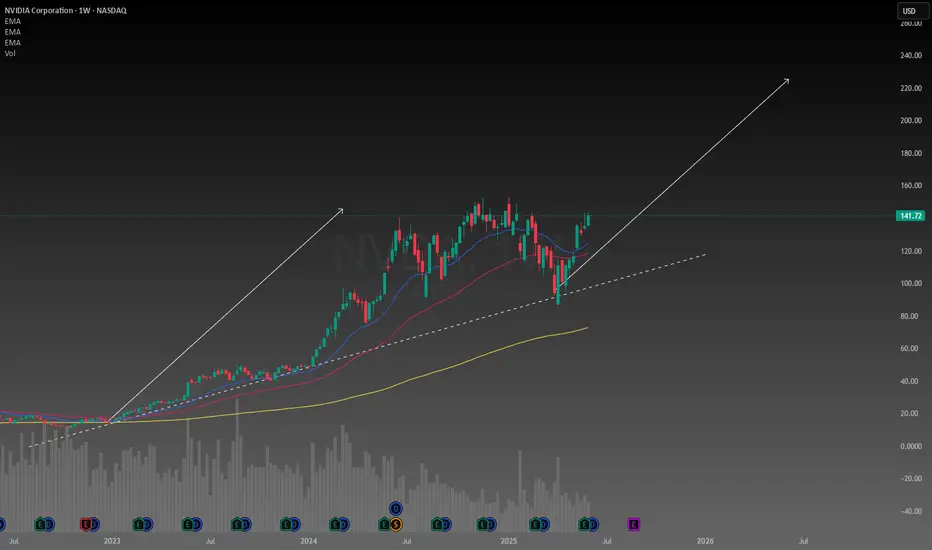
NVDA to $240 by 2026NASDAQ:NVDA is bullish still, anyone can see that, however I wanted to find some targets once it's in price discovery mode, well the golden pocket happpens to be $240 ($225-$250)
on weekly trend is confirmed extremely bullish so I'll continue holding and NASDAQ:NVDA should break $240 before 2026
Even a buy signal went off at the bottom in April. Let's see how much gas NASDAQ:NVDA has after it breaks the famous $150 resistance level

Fundamental and technical analysis on NVDA (Chicken Nugget) soonFundamental Analysis
NVIDIA Corporation (NVDA) remains a key player in the tech sector, benefiting from the rise of artificial intelligence, data centers, and gaming. With sustained growth, constant innovation, and strong demand for its graphics chips, the company continues to deliver solid financial results.
Recent reports indicate revenue growth and expansion in key markets. Product diversification, particularly in supercomputers and embedded systems, strengthens NVDA’s position against competitors. Investor interest in the semiconductor industry helps maintain the stock’s positive momentum.
Technical Analysis
The chart analysis highlights key technical levels for investors:
- Key Resistance: $150 USD – This level must be broken to confirm a strong bullish trend. A breakout with volume could signal a gradual rise toward higher targets.
- Support Level: $131.50 USD – Strong demand and low supply are identified at this level, making it an excellent entry point for investors looking for buying opportunities before a potential rebound.
Targets & Strategy
- Short-term target (late June/early July): The target range of $170-$175 USD is possible if the bullish trend is confirmed. This level aligns with technical extensions and favorable market dynamics.
- July buyback (-5% to -10%): A moderate correction could occur, offering another buying opportunity before an upward recovery.
- Selling target (September to November): The next selling target is between $200-$240 USD, depending on market developments and investor sentiment.
Conclusion
NVDA stock presents interesting prospects, with well-defined technical levels and a strong fundamental outlook. Investors should monitor these thresholds to adjust their strategy based on market fluctuations.
If you want to refine this analysis or explore other scenarios, I'm here to dive deeper into key points! 🚀 Subscribe! TSXGanG
I hold a CCVM and MNC (Certificate of Competence to become a securities broker anywhere in Canada) and have been working as a trader for five years.
It’s a pleasure for me to help people optimize their trading strategies and make informed financial market decisions.
