NVDA 140 PUT exp Feb 21 (Win)Saw NVDA was extremely bullish for the previous 2 weeks with nom signs of breathing. Price reacted to a strong daily key level signifying a retracement coming soon. Made a uptrend trend line on the 1HR and 4HR timeframe, price broke below at market close on the previous day, formed 3 lower highs and a retest off the trend line break on the 1HR timeframe. Shorted it down to the first mini key level for the win.
Trade ideas

NVDA: Spring effect on SL: Buy ideaOn NVDA we would have a high probability of having an upward trend over a time unit of one (01) hour. This is explained by the fact that we have two (02) spring effects on the support line. Red candles with a small body and a long, low wick. This upward trend will also be confirmed by the breaking of the resistance line with force and the vwap by a large green candle accompanied by a large green volume.
Furthermore, we must be careful because there may also be a continuation of this downward trend in the event of a strong break of the support line by sellers.

Nvidia Closes the Gap—Where Next?Nvidia has stormed back from its early February lows, rallying more than 20% to erase January’s sharp gap lower. But with the gap now closed, the stock has hit its first real test of resistance.
DeepSeek Reaction: Panic Fades
The initial sell-off was triggered by fears that DeepSeek’s AI breakthrough could loosen Nvidia’s grip on the industry. However, those concerns have since eased. While DeepSeek’s model offers cost advantages, it still relies on Nvidia’s GPUs, and overall AI accelerator demand remains strong. Nvidia’s software ecosystem remains a significant moat, making it difficult for the industry to shift away from its technology on a large scale. The broader takeaway? The market likely overreacted.
The Technical Significance of Gaps
Price gaps aren’t just voids on a chart—they represent key areas of supply and demand imbalance. When a stock gaps lower, it often creates a resistance zone as trapped buyers look to exit when price returns.
After rallying back earlier this month, Nvidia finally posted its first red candle the moment the gap was filled, snapping a ten-session streak of higher closes. This suggests sellers are stepping in, and the battle over direction is heating up.
Forward Scenarios: Breakout or Breakdown?
Breaking Higher: If Nvidia can push beyond the gap close, the next resistance is the late January swing high—the level that triggered the breakdown. Above that, the major hurdle remains the double-top all-time highs from the turn of the year.
Pulling Back: The rally to close the gap has formed a steep ascending trendline. A break below this could open the door for a deeper retracement, with the February swing lows as a key downside target. Given Nvidia’s multi-year uptrend, choppy consolidation phases like this are normal—but if support gives way, it could shift momentum in bears’ favour.
Nvidia (NVDA) Daily Candle Chart
Past performance is not a reliable indicator of future results
Disclaimer: This is for information and learning purposes only. The information provided does not constitute investment advice nor take into account the individual financial circumstances or objectives of any investor. Any information that may be provided relating to past performance is not a reliable indicator of future results or performance. Social media channels are not relevant for UK residents.
Spread bets and CFDs are complex instruments and come with a high risk of losing money rapidly due to leverage. 83% of retail investor accounts lose money when trading spread bets and CFDs with this provider. You should consider whether you understand how spread bets and CFDs work and whether you can afford to take the high risk of losing your money.

NVDA at a Decision Point! Trade Setups for Feb. 20Technical Analysis (TA) Overview
NVDA is currently trading near 138-139, consolidating after a strong uptrend. It recently rejected from 141, which aligns with a key gamma resistance level. If bulls can push above 141, momentum could continue toward 143-150. However, failure to hold current levels may lead to a deeper pullback toward 130-123 support levels.
📌 Key Support & Resistance Levels:
* Resistance: 141 (gamma resistance), 143.44 (previous high), 150 (major call wall)
* Support: 137, 129-130 (first demand zone), 123 (major put support)
📌 Indicators:
* MACD: Bearish crossover—momentum is slowing.
* Stoch RSI: Oversold at 17.34, meaning downside may be limited, but no immediate reversal yet.
* Volume Profile: Price is at a high-volume node, meaning consolidation or a breakout attempt is likely soon.
Gamma Exposure (GEX) & Options Sentiment
🔹 Call Walls (Resistance):
* 141: Strong gamma resistance—breakout level for bulls.
* 150: Major call wall—tough level to break unless momentum strengthens.
🔹 Put Walls (Support):
* 130: First put support—likely to hold on a pullback.
* 123-120: Deeper put walls—if 130 breaks, downside could accelerate.
🔹 Options Sentiment:
* IVR: 42.3 (moderate implied volatility—expect bigger moves).
* Call Open Interest: 19.1% – Moderate bullish bias, but not extreme.
Trade Scenarios for Tomorrow
✅ Bullish Setup:
* If NVDA breaks above 141, expect a push toward 143-150.
* Ideal entry: Above 141, stop-loss below 139.
* Profit targets: 143.44, 145, 150 (extension).
❌ Bearish Setup:
* If NVDA fails at 141 and breaks below 138, expect a move toward 130-123.
* Ideal entry: Below 138, stop-loss above 140.
* Profit targets: 130, 127, 123.
Probability Estimate for NVDA’s Next Move: Bullish Move Above 141 (Targets 143-150)
Scenario Probability (%): 50%
Reasoning: NVDA is in a strong uptrend but faces key gamma resistance at 141.
• Needs strong volume to break through 141-143 levels. | | Choppy/Sideways (Range 137-141) | 30% |
Volume profile suggests heavy trading activity around 138-140, meaning price may consolidate.
* MACD suggests weak momentum, signaling possible chop before a breakout. | | Bearish Breakdown Below 138 (Targets 130-123) | 20% | - Bearish MACD crossover signals weakening momentum.
* If 138 fails, expect downside toward 130-123 levels. |
Final Thoughts
* NVDA needs to break 141 to continue higher toward 143-150.
* If 138 breaks, selling pressure could increase, pushing price to 130-123.
* IVR is moderate, meaning larger moves are possible, but momentum needs to pick up.
🔹 Best Trading Plan:
* Bullish Play: Look for a breakout above 141 → target 143-150.
* Bearish Play: Watch for rejection at 141 or a break below 138 → target 130-123.
🚨 Disclaimer: This analysis is for educational purposes only and does not constitute financial advice. Always conduct your own research and trade with proper risk management.

NVIDIA - Scalping + Forecast (2-19)🔥 Market Overview (NVIDIA - NVDA)
Trend: Bullish recovery after a consolidation phase.
Key Levels:
Resistance: $142.04 (Supertrend level)
Support: $132.88 (200 EMA), $138.29 (Intermediate support)
Indicators:
EMA 9: $140.21 (Price hovering around short-term trend)
EMA 200: $132.88 (Strong support)
MACD: Bearish momentum fading, but still negative.
RSI: 59.19, approaching overbought zone.
🔥 Scalping Strategy
🩸 1. Range Scalping (Preferred Strategy)
Buy near: $138.50-$139.00, targeting $142.00.
Sell near: $142.00, targeting $138.50.
Stop-loss: Below $137.50.
🩸 2. Breakout Scalping (If $142.50 Breaks)
Buy above: $142.50, targeting $145-$147.
Stop-loss: Below $141.50.
🩸 3. Momentum Scalping (For Quick Trades)
Short near: $142.00, targeting $138.50.
Buy near: $138.50, targeting $142.00.
🔥 Mid-Term Trend Forecast (1-3 Weeks)
NVDA needs to break $142.50 to confirm a continued bullish rally.
If rejected at $142.00, expect a pullback to $138.50.
MACD shows signs of recovery but remains weak.
🔥 News & Market Context
NVIDIA remains a market leader in AI and GPU sectors, with high institutional interest.
Investor sentiment remains strong, but macroeconomic factors could influence movement.
Earnings and sector-wide tech performance will play a role in confirming a breakout.
🔥 Decision:
🩸 Short-term: Range scalp between $138.50-$142.00.
🩸 Mid-term: Wait for confirmation of $142.50 breakout.
🩸 Ideal Play: Short near $142.00 if rejection; buy on a confirmed breakout above $142.50.
👑 Final Verdict:
NVDA is at a key resistance zone. A breakout above $142.50 could push towards $145+, while rejection could bring a pullback to $138.50.
🔥 LucanInvestor's Quote:
"The market is a battlefield—know when to strike, and when to hold." 👑

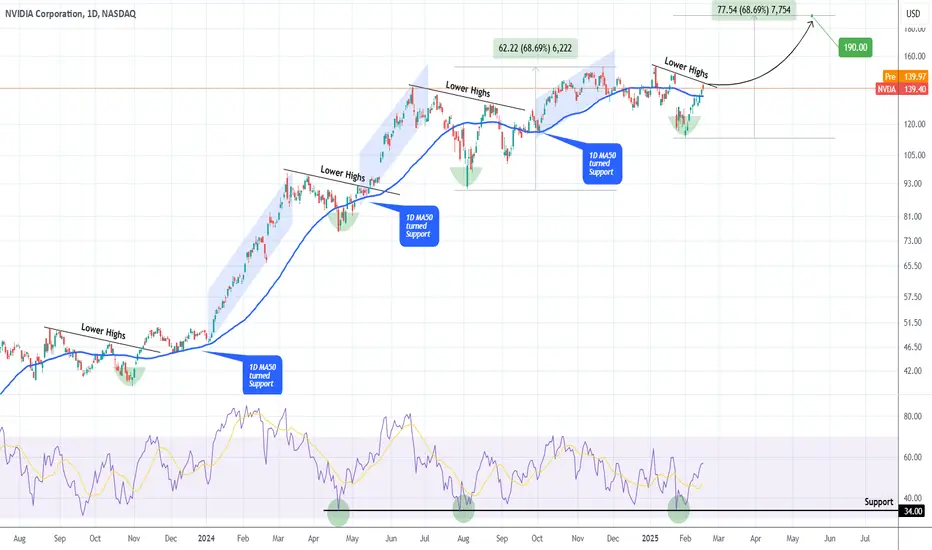
NVIDIA Rejected on the most important Resistance of all.Last time we looked at NVIDIA Corporation (NVDA) was just 20 days ago (January 29, see chart below) but we managed to get the exact bottom buy opportunity on the 1W MA50:
As the stock reacted with an immediate and relentless rally of 10 straight green 1D candles, it hit yesterday its first hurdle, the All Time High (ATH) Lower Highs trend-line and closed in red.
This Lower Highs trend-line is historically very important as every time a similar technical structure broke in the past 2 years, a strong rally followed. The early ones were stronger, which is natural to expect as the company was recovering from the 2022 Inflation Crisis and had enormous room to grow. On a side-note, the 1D RSI rebounded on its 34.00 Support, where the stock's last two bottoms were priced.
As a result, we believe that if NVIDIA breaks and closes above the current Lower Highs trend-line, it should at least repeat the last rally from its bottom (+68.69%), which translates to a $190 medium-term Target.
-------------------------------------------------------------------------------
** Please LIKE 👍, FOLLOW ✅, SHARE 🙌 and COMMENT ✍ if you enjoy this idea! Also share your ideas and charts in the comments section below! This is best way to keep it relevant, support us, keep the content here free and allow the idea to reach as many people as possible. **
-------------------------------------------------------------------------------
💸💸💸💸💸💸
👇 👇 👇 👇 👇 👇
NVDA - Back again, now down again?The pattern seems to repeat.
Again, we had a HAGOPIAN, which sais, that price goes back more than from where it came, and this rule was right.
Up in here, I'm not that confident anymore that price will reach the Centerline. But, it's not about what I think, or how confident I'm are. I just have to follow my Strategy and act according to the Rules, the trading framework of the Medianlines.
That said, we either shoot up on earnings, or we definitely tank down. For now, there is no trade, only a Gamble. I rarely gamble, so I'll sit on the sidelines and let it happen whatever will come out on earnings.
As for a Lotto-Ticket, I would buy some Puts and just have fun to watch how they get burned, or how I get a Christmas Moment in the beginning of the new year §8-)

NVIDIA & xAI’s Grok 3: A Game-Changer or Overhyped AI Play?NVIDIA’s stock ( NASDAQ:NVDA ) has been on an unstoppable rally, driven by the AI boom. Now, with Elon Musk’s xAI set to launch Grok 3 —trained on an impressive 100,000 NVIDIA H100 GPUs —the market is buzzing with speculation. Could this be the catalyst that propels NVDA to the next level, or are we approaching an AI-driven valuation bubble?
Key Developments :
Massive GPU Demand : xAI’s Grok 3 will utilize a staggering 100,000 H100 GPUs, reinforcing NVIDIA’s dominance in AI hardware and boosting its market position.
Supercomputer Expansion : Musk’s team is building one of the most powerful AI training clusters in Memphis, Tennessee. This development could significantly increase NVIDIA’s long-term revenue streams, given its key role in powering these systems.
Release Date : Grok 3 is set to launch today, February 17, 2025(4 AM GMT) , with a live demonstration, which may influence sentiment around AI-related stocks, especially NVIDIA.
Market Sentiment & Risks : While these developments seem bullish for NVIDIA, some analysts, including hedge funds like Elliott Investment Management, have raised concerns over the potential for overvaluation as the AI euphoria spreads.
Conclusion: Grok 3’s launch will be a pivotal moment, with NVIDIA at the heart of the AI revolution. Whether this sparks a fresh rally or raises concerns about an AI bubble remains to be seen.
------------------------------------------------------------------------------
Now, let's use Technical Analysis to analyze NVIDIA stock(NVDA) .
In terms of technical analysis, the loss of an Ascending Channel is not good news for any asset and is a sign of weakness in the upward trend . This has happened to the NVIDIA stock(NVDA) .
From the point of view of Classical Technical Analysis , it seems that NVIDIA stock is completing the Rising Wedge Pattern .
Educational tip : The Rising Wedge Pattern is a bearish reversal or continuation pattern characterized by converging upward-sloping trendlines. It signals weakening bullish momentum, often leading to a breakdown below support. A confirmed breakout to the downside indicates a potential price decline.
I expect the launch of Grok 3 Artificial Intelligence(AI) can increase at least +10%+15% of NVIDIA stock(NVDA) . If the upper line of the Rising Wedge Pattern breaks , we can expect a further increase [ the next target can be Yearly Resistance(1=$175.68)(in case of breaking) ].
What’s your take? Drop your thoughts about NVIDIA in the comments! 👇
Be sure to follow the updated ideas.
NVIDIA Analyze (NVDAUSD), Daily time frame.
Do not forget to put Stop loss for your positions (For every position you want to open).
Please follow your strategy; this is just my idea, and I will gladly see your ideas in this post.
Please do not forget the ✅' like '✅ button 🙏😊 & Share it with your friends; thanks, and Trade safe.


NVDA Trading AnalysisLong Positions:
Buy at 138 and 132 with profit targets at 144 and 150.
Short Positions:
Sell at 148 and 152 with profit targets at 142 and 133.
Risk Management:
Ensure proper stop losses and adjust position sizes according to market volatility.
Disclaimer:
This analysis is for informational purposes only and does not constitute investment advice. Trading in financial markets involves risks and may result in losses. It is recommended to conduct your own analysis and consult with a financial advisor before making any investment decisions.

NVDA: Buy ideaOn NVDA we would have a high probability of having a continuity of the upward trend over a time unit of one (01) hour if and only if the resistance line is broken forcefully by the buyers.
But, let's be careful because the market is unpredictable. There may be a reversal of the trend. This will happen if the vwap indicator and support line are forcefully broken by sellers.

My BY Entries for NVIDIAHere are my 2 buy entries for NVIDIA.
Please study my chart and see my reasons.
Entry 1: buy at the current price of $123.5.
Entry 2: wait to retrace back to $120
SL for the two entries: $114.8
TP1 and TP2 : $150
Trade with care

NVDA: FREMA Linear Extensions - Horizontal VS DirectionalFREMA bands offer a dynamic edge over traditional ATR-based volatility bands by adapting to real buying and selling pressure (bullish and bearish part of candles) rather than just price movement. Unlike ATR bands, which expand symmetrically based on historical volatility, FREMA bands widen asymmetrically — expanding more on the upside during strong buying pressure and on the downside when selling dominates. This makes them highly effective for identifying momentum early, spotting true breakouts, and distinguishing strong trends from choppy markets. By responding directly to market psychology, they provide superior trade entries and exits, minimizing noise in ranging conditions while highlighting areas of genuine demand and supply shifts. For traders seeking a more responsive, trend-sensitive tool, FREMA bands deliver a clearer picture of market dynamics compared to conventional volatility indicators.
RESEARCH
Testing how price behaves within 2 types of linear extensions:
Horizontal
While giving an impression of being static, they're actually based on FREMA which is dynamic.
Use Horizontal Levels when expecting price to respect historical support/resistance, especially in sideways or mean-reverting markets.
Directional
Gives an immediate clue of being adaptable to the general angle of trend.
Use Linear Extensions when trading with momentum or trend continuation, as they adapt to market directionality.
Will price respect the static balance of past support and resistance, or will momentum dictate its own path along the trajectory of directional expansion? By tracking price interactions with both projections, we’ll uncover which model best maps the market’s intentions, offering valuable insights for future setups.
Stay tuned as we register these behaviors in real-time because once the market chooses its guide, the next move could be crystal clear.

NVDA $141 touchAs per usual beautiful prediction to the gap filler on NVDA. loser to the 141 filler and possible third lower high. Would definitely capitalize on that $3 dollar difference and get out until I see a down movement to retest trendline support or I see a retest to the upside.
It is uncertain now. Wha is not uncertain is we will get that GAP closed.

Nvidia 2-17 (scalping + forecast) 🔥 Trend: NVIDIA (NVDA) is showing a recovery after a recent correction. The short-term trend is bullish, but resistance is approaching.
Key Levels:
Resistance: $140 (critical breakout zone).
Support: $132.98 (key holding zone).
Indicators:
EMA 9: $136.25 (price above, indicating a short-term bullish trend).
EMA 200: $133.34 (supporting the recovery).
Supertrend: $132.98 (acting as a near-term support level).
MACD: Bullish crossover, indicating positive momentum.
RSI: 70.69, approaching overbought conditions, signaling potential resistance ahead.
🔥 Scalping Strategy:
🩸 1. Momentum Scalping:
Buy near: $136–$137, targeting $140.
Sell near: $140, targeting $135 on retracement.
Stop-loss: Below $133 for risk management.
🩸 2. Breakout Scalping:
Long if price breaks above: $140, targeting $145.
Short if price fails at $140, targeting $135.
🩸 3. EMA/VWAP Strategy:
Price above EMA 9 and 200, indicating a continuation move.
Ideal to buy on pullbacks to EMA 9 ($136) for quick scalps.
🔥 Mid-Term Trend Forecast (1-3 Weeks):
If NVDA breaks $140, a continuation to $145–$150 is likely.
A rejection at $140 could trigger a pullback to $133–$130.
RSI suggests cautious optimism; overbought conditions may lead to short-term selling pressure.
🔥 News & Market Context:
Earnings Season: Upcoming earnings could drive volatility.
AI & Chip Demand: NVIDIA remains dominant in AI chip supply, providing long-term strength.
Tech Sector Performance: Strong overall, but macroeconomic factors could influence movement.
🔥 Decision:
🩸 Short-term: Scalping long above $136, but watching $140 resistance.
🩸 Mid-term: Bullish above $140, caution if rejected.
🩸 Ideal Play: Buy on dips, exit near $140 or breakout trade if $140 is cleared.
👑 Final Verdict: NVIDIA is positioned for a potential breakout, but resistance at $140 must be cleared. Traders should manage risk carefully, as RSI suggests the stock is nearing short-term overbought conditions.
🔥 LucanInvestor's Quote: "Opportunities lie at the edge of resistance. Break through, or step aside."

$NVDA rotating up in bull channelThis is a daily of NVDA, showing a bullish parallel channel and bullish movement since the Deep-Seek fear event of a few weeks ago. Short to medium-term price targets are swing highs near the top of the channel. It will probably fill the gap caused by the selloff in the next couple of days. Best of luck.
-Mr Joseph
