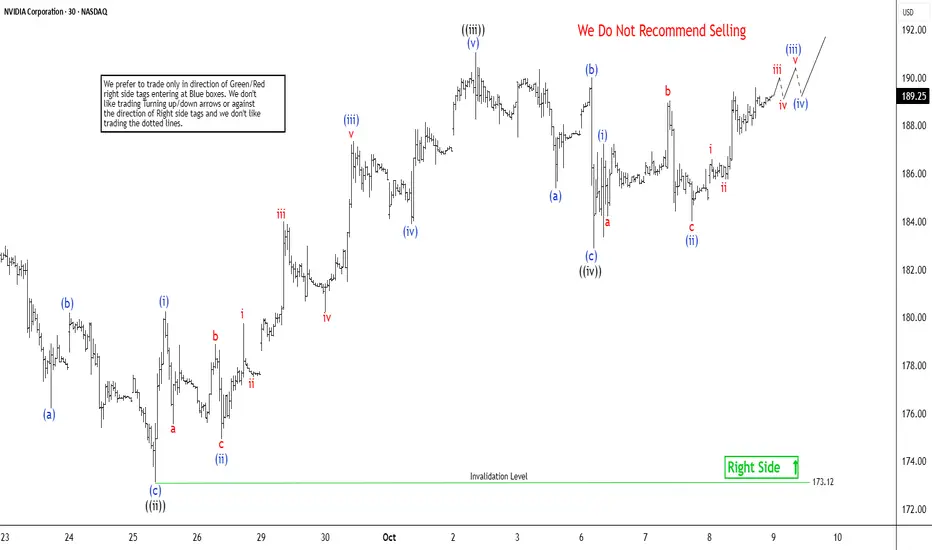
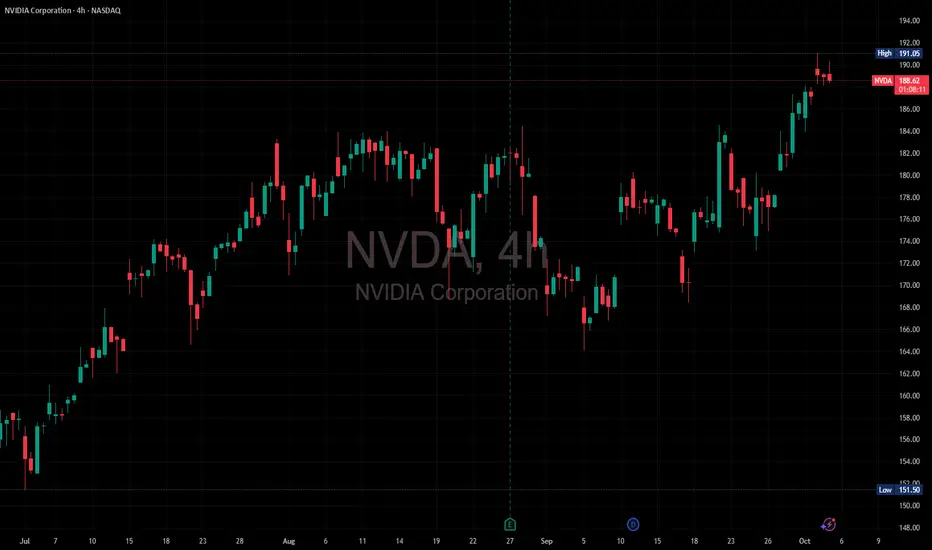
NVDA (Nvidia’s) Leading Diagonal Pattern Targets $193The short-term Elliott Wave analysis for Nvidia (NVDA) indicates that the cycle from the September 18 low is unfolding as a leading diagonal. Starting from that low, wave ((i)) concluded at $184.55, followed by a pullback in wave ((ii)) that ended at $173.12, as depicted in the 30-minute chart. The stock then surged in wave ((iii)), displaying an internal impulse structure. From wave ((ii)), wave (i) peaked at $180.26, with wave (ii) dipping to $174.93. Wave (iii) climbed to $187.35, followed by a wave (iv) pullback to $183.90. The final leg, wave (v), reached $191.05, completing wave ((iii)) in a higher degree.
The subsequent wave ((iv)) pullback formed a zigzag Elliott Wave pattern. From wave ((iii)), wave (a) declined to $185.38, wave (b) rose to $190, and wave (c) dropped to $182.88, finalizing wave ((iv)). The stock has since resumed its ascent in wave ((v)), with wave (i) ending at $187.23 and wave (ii) dips concluding at $184. The stock is poised to climb further, likely completing wave (iii) soon. A wave (iv) pullback should follow to correct the cycle from the October 8, 2025 low before resuming higher. As long as the $173.12 pivot holds, any pullback should find support in a 3, 7, or 11 swing, setting the stage for additional upside.
Trade ideas
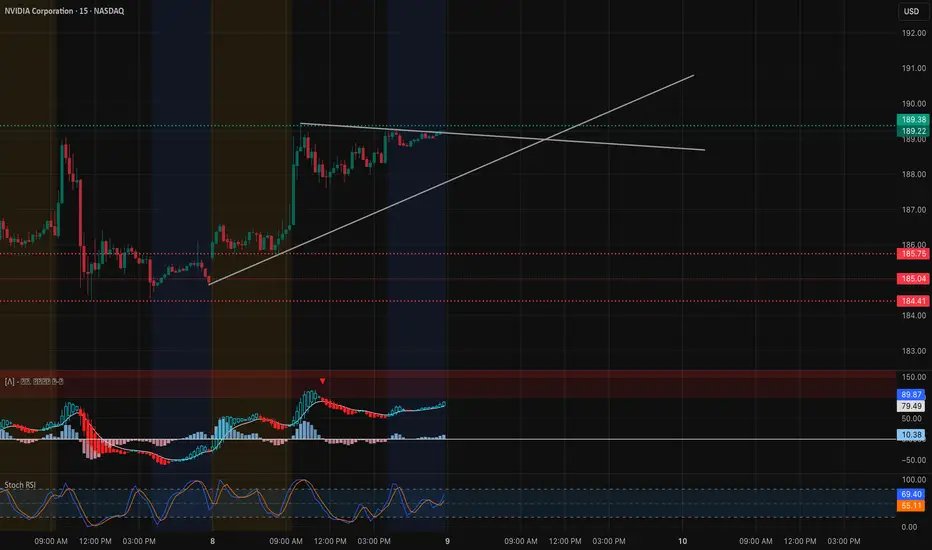
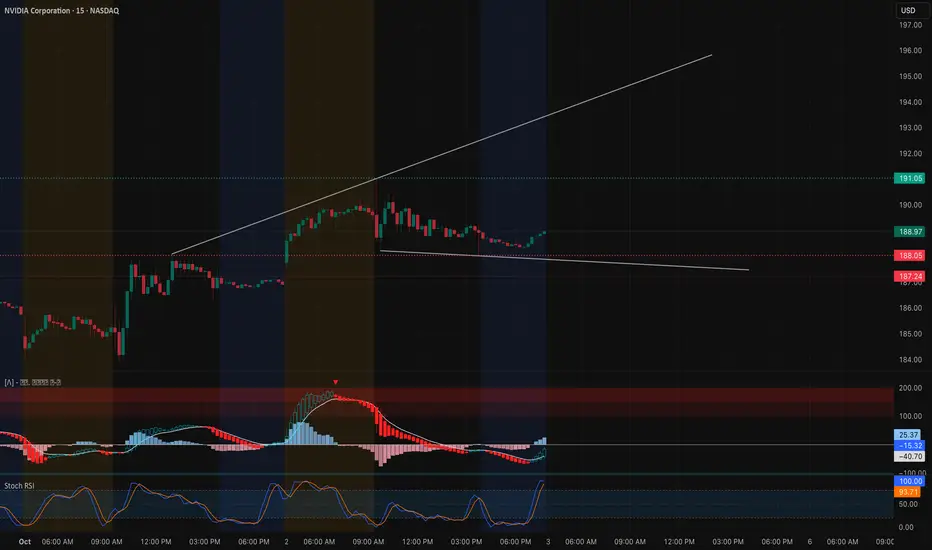
NVDA Holding Strong. Break $190 Before the Next Wave. Oct 9NVIDIA continues to trade with strong bullish momentum, consolidating just under the $190 level — a critical resistance area backed by prior liquidity grabs and gamma resistance. Today’s price action shows tight coiling between $188 and $189.50, indicating a potential breakout setup for the next session.
Market Structure:
* On the 15-minute chart, NVDA is respecting an ascending trendline from yesterday’s low, suggesting sustained intraday bullish control.
* The 1-hour structure reveals a clean range between $185.75 (support) and $189.50 (resistance) — a breakout from this range could trigger a measured move toward $192–$195.
* MACD on the 15-minute is crossing bullish with rising histogram momentum, and the Stoch RSI remains elevated but not yet overextended — signaling possible continuation before cooling off.
Support and Resistance Levels:
* Immediate Resistance: $189.41 → $190.36 (short-term breakout zone)
* Major Resistance (Gamma Wall): $192.5 → $195
* Immediate Support: $186.89 → $185.75
* Key Support Zone: $184.4 → $182.8
GEX & Options Sentiment (1H GEX Chart):
* Highest positive Call Gamma concentration sits between $192.5 and $195, aligning with visible overhead resistance.
* Put support remains dense at $182–$180, forming a sturdy gamma floor.
* IVR remains low at 12.2, and call positioning slightly outweighs puts (13.5% call bias), showing traders are positioning bullish but cautiously.
* The GEX trend favors upside momentum while $185 holds, giving NVDA room to climb toward the $190–$192.5 zone if SPY continues to strengthen.
Trade Scenarios:
Bullish Setup:
* Entry: Above $189.50 breakout confirmation
* Target 1: $192.5
* Target 2: $195
* Stop-Loss: Below $186.8
* Rationale: Trendline support, bullish MACD, and strong GEX alignment support a breakout continuation.
Bearish Setup:
* Entry: Below $185.75 (breakdown retest)
* Target 1: $184.4
* Target 2: $182
* Stop-Loss: Above $187
* Rationale: A rejection at $189–$190 with MACD divergence could trigger a short-term pullback to fill lower liquidity pockets.
NVDA’s price action shows controlled consolidation under a key resistance, suggesting a potential breakout continuation toward $192–$195 if momentum holds. Watch SPY’s direction for confirmation — any weakness there could cause NVDA to retest $185 before resuming upward. For now, bulls are in charge.
Disclaimer:
This analysis is for educational purposes only and does not constitute financial advice. Always do your own research and manage your risk before trading.
NVDA broke the resistanceNASDAQ:NVDA has just broken a resistance, slowly slowly targets 250$.
Currently no sign for downwards.

$NVDA Call Alert – Oct 31 ’25 $190 Calls | 71% ROI PotentialEnter: NASDAQ:NVDA OCT 31 2025 $190 CALLS
Buy in Price: $6.80 - $6.85
Take Profit: $11.63
Stop Bleeding: $5.98
ROI Potential: 71%
Exit Within: 302 Minutes
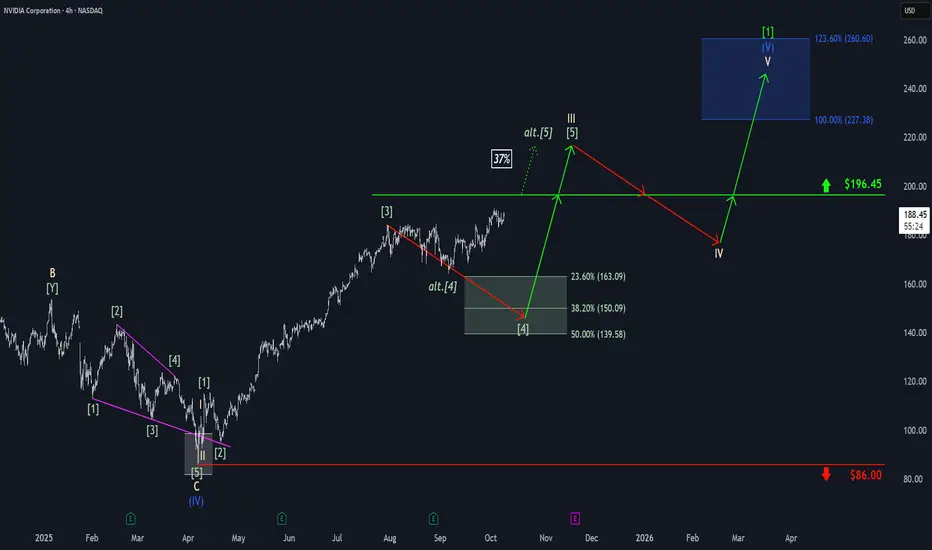
Nvidia: Bullish DistractionAmid bullish momentum, Nvidia edged closer to resistance at $196.45 before settling into sideways action late last week. As a result, there remains a 37% probability that the stock will bypass a new low and instead break directly above the $196.45 level. However, our primary expectation is for the stock to turn lower, targeting our green Target Zone between $163.09 and $139.58 to complete green wave . Only after this move do we anticipate a sustained advance above $196.45, which would mark the completion of beige wave III. Following a wave IV pullback below this threshold, we ultimately expect gains into the blue Target Zone between $227.38 and $260.60, where beige wave V should complete not only blue wave (V), but also the larger neon green wave .
NVDA - AI Dominance + Strong Technical Structure | Long Entry📈 Ticker: NVDA (NVIDIA Corporation)
📍 Recommendation: LONG
⏰ Timeframe: Position Trade (4-8 weeks)
🎯 Trade Idea Summary
Entry: $189.00 (on pullback to support)
Stop Loss: $173.00 (-8.5%)
Take Profit: $221.00 (+16.9%)
Risk/Reward Ratio: 1:2.0
📊 Fundamental Justification - AI LEADER 🚀
Revenue Growth: STRONG (+114% YoY) - $60.9B to $130.5B 💰
Net Income Growth: STRONG (+145% YoY) - $29.8B to $72.9B 📈
Debt Health: EXCELLENT (Score 10/10) - Low debt, high coverage ✅
Market Position: Dominant AI/GPU market share
Growth Catalyst: AI infrastructure spending cycle
📈 Technical Analysis
Trend: Daily ↗️ Alcista, 4H ↗️ Alcista, 1H ↗️ Alcista (ALL BULLISH)
RSI: 65.8 - Healthy momentum, not overbought
MACD: Bullish and positive across timeframes
Price Action: Above all key SMAs, holding higher lows
Key Support: $185 (recent swing), $178 (SMA20), $173 (critical)
Key Resistance: $195 (psychological), $205 (recent high), $221 (target)
🔍 Catalyst & Market Context
AI Revolution: Sustained data center demand
Earnings Momentum: Consistently beating expectations
Product Cycle: Blackwell GPU platform rollout
Institutional Support: Heavy fund ownership
🎮 Trade Management
Ideal Entry Zone: $188 - $190
Stop Below: $173.00 (below SMA20 and key support)
Target 1: $205.00 (+8.5%) - Consider partial profit
Target 2: $221.00 (+16.9%) - Full position target
Timeframe: 4-8 weeks for full target
⚠️ Risk Factors
Valuation Premium: P/E 53.9 (high but growth-justified)
Market Dependency: Tech sector correlation
Competition: AMD/Other AI chip competitors
Economic Sensitivity: Capex spending cycles
✅ Why This Trade Works
Earnings Powerhouse - Explosive growth in AI era 📊
Technical Strength - Clean uptrend across timeframes 🟢
Structural Tailwinds - Multi-year AI investment cycle 🔄
Risk Management - Defined levels with 1:2 R/R 🛡️
📅 Key Levels to Watch
Immediate Support: $185 - $188
Breakout Level: $195 - $197
Acceleration Zone: Above $205
Invalidation: Below $173 (stop loss)
#NVDA #NVIDIA #AI #PositionTrade #TechStocks #Breakout
#ArtificialIntelligence #Semiconductors #GrowthInvesting #RiskManagement
Disclaimer: This post is for educational and informational purposes only and does not constitute financial advice or investment recommendation. Trading involves substantial risk of loss and is not suitable for all investors. Past performance is not indicative of future results. Conduct your own research and consult with a qualified financial advisor before making any investment decisions.
Full moon energy - $NVDA🟩 190 — resistance zone
🟪 194 — potential breakout
🟥 153 — mid-range support
🟨 127 / 112 — deep demand zones
Momentum still strong but slowing near highs… like energy you can still feel, even when it’s pulling back that “missing you” I do mean you! phase before momentum returns.

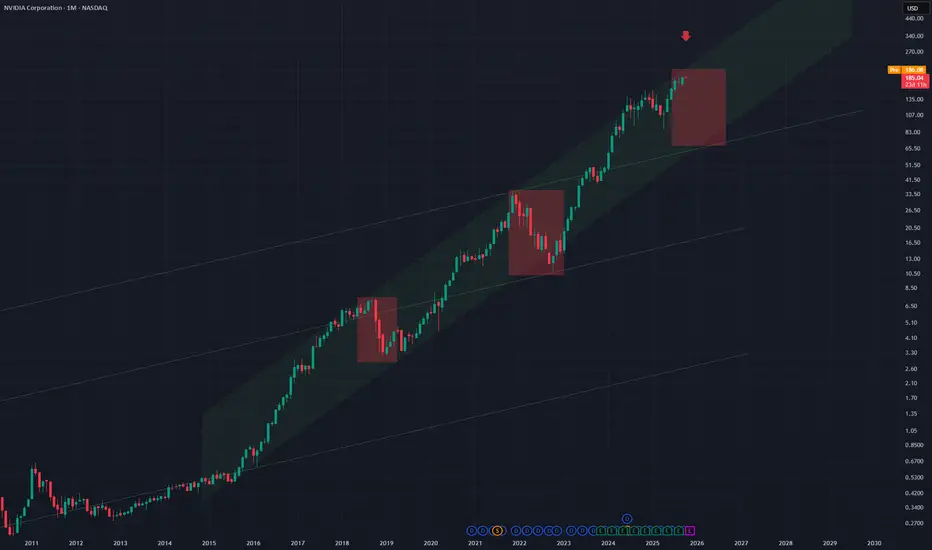
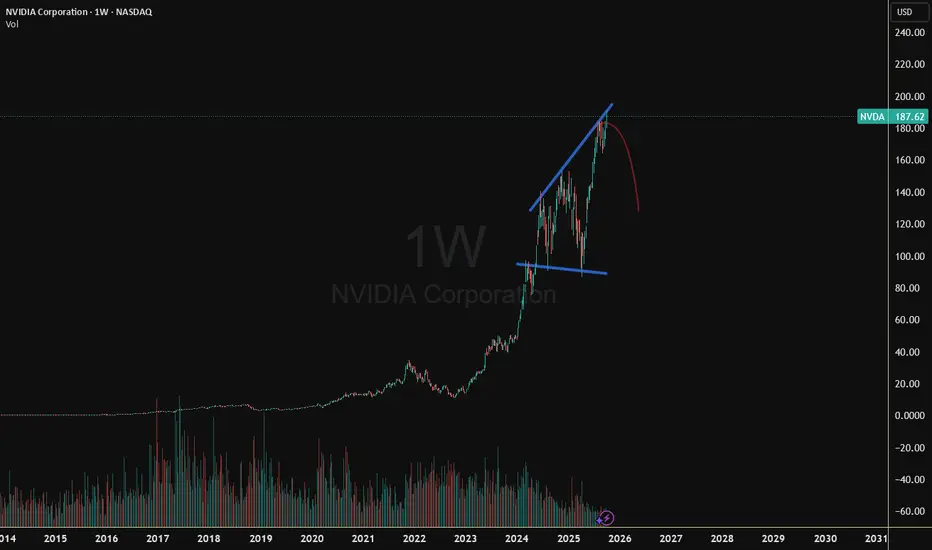
NVDA - Bear Move Within Up ChannelNVDA is at the top of an up channel on the Monthly chart
This is a very steep up channel
Two prior moves down from the top of this channel can be seen (red rectangles)
Suggesting a third drop happens on this timeframe.
Exchange Rate Secrets1. What Are Exchange Rates and Why They Matter
An exchange rate is simply the price of one currency in terms of another. For instance, if $1 = ₹84, that means one US dollar can buy eighty-four Indian rupees.
But this number isn’t just a conversion figure — it’s a snapshot of economic power.
When a country’s currency strengthens, imports become cheaper but exports turn costlier.
When it weakens, exports surge but inflation might rise.
Exchange rates influence:
Global trade balances
Investment decisions
Inflation and interest rates
Tourism and remittances
Stock and commodity markets
Understanding these hidden levers is the first step to decoding the secrets of exchange rate movements.
2. The Real Players Behind the Curtain
Contrary to popular belief, exchange rates don’t move by chance. They’re often influenced — directly or indirectly — by a select few economic giants:
a. Central Banks
Institutions like the US Federal Reserve, European Central Bank, and Reserve Bank of India hold the real levers.
They manipulate interest rates to attract or repel foreign capital.
They intervene in forex markets to stabilize or deliberately weaken their currency.
They issue monetary policies that send shockwaves through global markets.
For example, when the Fed raises interest rates, the US dollar usually strengthens — because higher returns attract global investors.
b. Institutional Traders and Hedge Funds
Major hedge funds trade billions in currencies daily. They anticipate policy changes and use leverage to amplify profits — creating massive short-term moves that can destabilize weaker economies.
c. Governments
Sometimes, governments quietly “manage” their exchange rates for strategic reasons. China, for example, has often been accused of keeping the Yuan undervalued to make its exports more competitive — a tactic dubbed “currency manipulation.”
d. The Market Psychology
Beyond data and policy, market sentiment — the collective emotion of traders — drives currencies. Fear of recession, geopolitical tensions, or even rumors can send exchange rates spinning faster than any spreadsheet can predict.
3. The Core Secrets Behind Currency Movements
Now let’s unlock the deep, often hidden mechanisms that move currencies. These are the five pillars of exchange rate secrets:
1️⃣ Interest Rate Differentials
Currencies tend to flow toward countries with higher interest rates.
If India’s rates are 6% while the US offers 4%, investors may convert dollars to rupees to earn better returns.
This inflow strengthens the rupee.
But here’s the twist: expectations matter more than reality. Even a hint that the Fed may raise rates can trigger massive dollar inflows — long before the actual hike happens.
2️⃣ Inflation and Purchasing Power
Currencies are mirrors of purchasing power.
If inflation is high in one country, its money loses value faster.
Low inflation, on the other hand, indicates stability and boosts confidence.
This is why nations with consistent inflation control — like Switzerland and Japan — often see their currencies appreciated as “safe havens.”
3️⃣ Trade Balances
Countries that export more than they import tend to have stronger currencies.
Why? Because foreign buyers must purchase the exporter’s currency to pay for goods.
For instance, Japan’s trade surplus has historically supported the yen.
Conversely, a nation running persistent trade deficits (like the US) faces downward pressure — unless offset by investment inflows.
4️⃣ Political Stability and Global Confidence
Political chaos often sends investors fleeing.
A coup, election turmoil, or policy uncertainty can cause sudden devaluations.
Meanwhile, stable governments with clear fiscal policies attract long-term investors — strengthening the currency.
When Russia invaded Ukraine in 2022, the ruble initially collapsed. Yet, with aggressive capital controls and energy exports, it later stabilized — showcasing how government measures can rewrite currency fate.
5️⃣ Speculation and Market Manipulation
The most guarded secret: exchange rates aren’t always fair reflections of fundamentals.
Short-term volatility is often fueled by speculation — big money betting on future trends.
Speculators can move billions in seconds, pushing prices away from equilibrium.
Sometimes, their combined power even forces central banks to retreat — like in 1992’s “Black Wednesday”, when George Soros famously broke the Bank of England and earned over $1 billion in a single day.
4. The Hidden Mechanisms: Pegs, Floats, and Hybrids
Every country chooses how “free” its exchange rate should be.
A. Fixed (Pegged) Exchange Rate
Here, the value is tied to another currency, like the US dollar.
Example: Saudi Arabia pegs its riyal to the dollar to stabilize oil revenues.
Advantage: predictability for trade.
Disadvantage: vulnerability to external shocks.
B. Floating Exchange Rate
The value fluctuates based on market demand and supply.
Example: The US dollar, euro, and Indian rupee are managed floats.
Advantage: market-driven flexibility.
Disadvantage: volatility during crises.
C. Managed Float (Dirty Float)
Most modern economies use this hybrid system — allowing markets to move rates but stepping in occasionally to maintain stability.
These systems reveal another secret — that exchange rates are both economic tools and political weapons.
5. Currency Wars and Global Power Play
When one country weakens its currency intentionally, others often retaliate — sparking a currency war.
The logic is simple: a cheaper currency boosts exports and jobs.
But when multiple nations do this simultaneously, it can spiral into global instability.
2010s: The US accused China and Japan of undervaluing their currencies.
2020s: Nations quietly use quantitative easing (printing money) to keep currencies weak.
2025: As emerging markets like India, Brazil, and Indonesia grow, they’re joining this silent battle — balancing competitiveness with credibility.
6. The Psychological Side of Exchange Rates
Money is emotional. Exchange rates reflect not just economic numbers, but confidence.
When investors “believe” in a country’s future — its leadership, innovation, and growth — its currency rises.
Example:
The US dollar thrives during crises — seen as a “safe haven.”
The Swiss franc and Japanese yen surge when global uncertainty spikes.
The Indian rupee strengthens when foreign investors see long-term growth potential.
This psychological dance creates cycles — optimism, panic, correction — that drive exchange rate volatility beyond fundamentals.
7. Modern Secrets: Digital Currencies and Forex Algorithms
The 21st century has introduced new players and tools that redefine how currencies behave.
a. Algorithmic Trading
Over 70% of forex volume now runs on algorithms — automated systems that execute trades based on millisecond data.
These algorithms can amplify moves, creating sharp spikes or sudden reversals within seconds.
b. Cryptocurrencies
Bitcoin and stablecoins have disrupted the concept of “sovereign money.”
Some nations fear them; others embrace them.
El Salvador adopted Bitcoin, while China banned it and launched its own digital yuan — a step toward controlling cross-border transactions.
The secret here: digital currencies could one day bypass traditional exchange rates altogether.
8. The Indian Rupee in the Global Context
India’s exchange rate journey is a fascinating case study:
Pre-1991: A fixed regime tied to the pound, later the dollar.
Post-liberalization: A managed float system with RBI intervention.
Today: The rupee reflects both domestic fundamentals and global capital flows.
Hidden truth?
The RBI quietly smoothens volatility through buying or selling dollars — maintaining competitiveness for exports while protecting inflation targets.
Future outlook:
Stronger digital economy
Growing exports (IT, pharma, energy)
Controlled fiscal deficit
All point toward a more resilient rupee in the long run — though short-term fluctuations will remain.
9. How Traders and Investors Decode Exchange Rate Secrets
Smart investors don’t just watch the numbers — they watch the forces behind them.
Here’s how they stay ahead:
Monitor central bank statements — “forward guidance” often signals currency direction.
Track bond yield differentials — a widening gap means a stronger high-yield currency.
Follow geopolitical developments — sanctions, wars, or trade deals often move currencies overnight.
Use Volume Profile and Market Structure — to identify institutional footprints in forex charts.
Analyze capital flow data — especially FII (Foreign Institutional Investor) movements in emerging markets like India.
By understanding these undercurrents, traders can align with the smart money — not against it.
10. The Future of Exchange Rates: Toward a Digital Reset
Global monetary systems are entering a new era.
The next decade may witness a “global currency reset”, where traditional paper currencies evolve into central bank digital currencies (CBDCs).
This shift could:
Reduce transaction costs
Increase surveillance and control
Challenge the dominance of the US dollar
Create new “exchange rate ecosystems” driven by technology rather than trade alone
In short, the secrets of tomorrow’s exchange rates may lie not in central banks alone, but in blockchain codes and algorithmic governance.
Conclusion: The Art and Science of Exchange Rates
Exchange rates are far more than numbers flashing on a trading screen.
They are reflections of economic strength, political will, psychological trust, and technological evolution.
The secret to understanding them lies in reading between the lines — connecting data with direction, policies with perception, and numbers with narratives.
As global markets evolve, those who grasp these hidden forces won’t just convert currencies — they’ll convert opportunities into fortune.
Because in the end, exchange rates aren’t just about money — they’re about power. 🌍💰
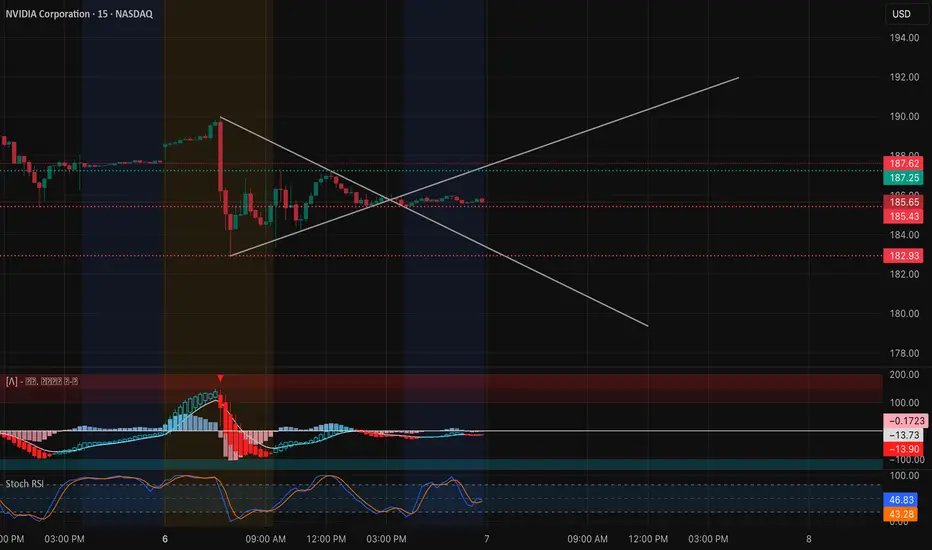
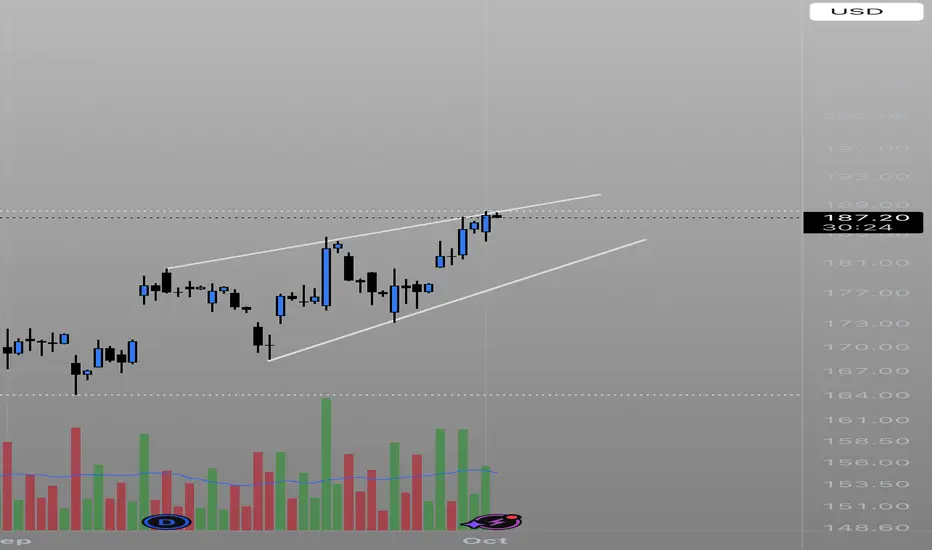
NVDA Oct 7–Coiling Tight for a Breakout! Watch $187.5 Pivot Zone15-Min Chart Analysis (Intraday Trading Setup):
NVDA is forming a symmetrical triangle, compressing between $185–$187.5 after several sessions of choppy consolidation. This coiling pattern reflects equilibrium between buyers and sellers — a setup that typically precedes a strong breakout or breakdown.
Price is currently sitting at $185.65, hugging the triangle’s apex. The MACD is neutral, showing declining momentum but no bearish crossover confirmation yet. Meanwhile, Stoch RSI is resetting mid-range (46.83 / 43.28), suggesting the potential for a new move in either direction once momentum triggers.
Short-term levels to watch:
* Upside breakout zone: $187.25 → $187.62. A break and hold above this level could quickly push NVDA toward $190–$192.50.
* Downside support: $182.93 → $180.50. If price loses $182.93 with volume, it opens room for a retest of the $178 zone where prior liquidity pools exist.
Given the wedge compression, traders should stay patient — the move that follows could be sharp and decisive.
1-Hour GEX Confirmation (Options Sentiment Insight):
GEX levels on the 1-hour chart reinforce the technical setup perfectly:
* Highest positive NETGEX / CALL resistance stands at $192.50, forming a key magnet zone if NVDA breaks out.
* The $185 area aligns with a neutral gamma transition point — a battleground between dealers hedging both directions.
* Strong PUT walls are concentrated around $180–$172.50, creating a solid downside floor.
This gamma structure implies a coiled spring scenario — a decisive break above $187.5 could unleash gamma-driven upside momentum toward $190–$192, while losing $182.9 could accelerate a gamma unwind to $180.
My Thoughts:
NVDA’s price action shows tightening volatility, a sign of energy building before expansion. With low IVR (14.8) and IVx (45.9) — volatility is compressed, making directional breakouts ideal for options traders.
I’m watching $187.50 as the key pivot. A breakout above it could trigger a short-term gamma squeeze toward $192.50, while a failure and rejection could lead to a fade toward $182–$180. This setup offers an attractive risk/reward in either direction — ideal for momentum traders.
Options Outlook (Oct 7–11):
* Bullish setup: Consider 187.5C or 190C (Oct 11 expiry) if price reclaims and holds above $187.5 with volume > average.
* Bearish setup: Consider 182.5P if NVDA fails at $187.5 and breaks below $183 with confirmed MACD divergence.
* Volatility note: With IVR at 14.8, option premiums are cheaper than usual — a good opportunity for directional swing entries.
Conclusion:
NVDA is consolidating tightly at a critical crossroad. The symmetrical triangle plus neutral gamma landscape signals a breakout is near — watch $187.5 for confirmation. Above it, bulls can push toward $190–$192.5; below $183, bears gain control. Stay alert — the next move could define NVDA’s direction for the week.
Disclaimer: This analysis is for educational purposes only and does not constitute financial advice. Always do your own research and manage your risk before trading.
NVDA Long/Investment till mid nov. 2 entries: low probability of orders getting filled/high profit margin.
1. one for higher probability of getting filled. E: 174 SL: 166
2. better profit margin. E: 172 SL: 167
target is $200 - $220
only allowed to hold it till:
1. 15 of November
or
2. 3 of December
why not to hold it till 2026? competition of selling might get higher.
commercials and fund managers will take profit before the bearish seasonality starts.

NVDA SELLIf you have not SELL NVDA, than be prepare to SELL NVDA riding it back down to 93.00 to 77.00 as Profit Targets, Stop Loss will be determine later!
If anyone likes long mumbo jumbo garbage analysis, than this is NOT for you.
Also, if you are afraid of risk, failure, and want only a 100% sure thing, than
run as fast as you can from the market, because the market is NOT a sure thing,
so it is definitely NOT for you.
WARNING: This is just opinions of the market and its only for journaling purpose. This information and any publication here are NOT meant to be, and do NOT constitute, financial, investment, trading, or other types of advice or recommendations. Trading any market instrument is a RISKY business, so do your own due diligence, and trade at your own risk. You can loose all of your money and much more.

NVDA at a Make-or-Break Zone – Can Bulls Push Back on Oct. 6? Market Overview (15-Min Chart)
NVIDIA continues to trade inside a well-defined downward channel, showing controlled selling pressure throughout last week. Each bounce attempt has been capped near the descending resistance line, currently near $188.80–$189, while support sits around $185.30–$186.
The MACD histogram has started to turn lighter red, with a potential bullish crossover forming beneath zero — an early sign of waning bearish momentum. Meanwhile, the Stochastic RSI has rebounded sharply from oversold levels and is now moving toward the upper band, indicating possible short-term upside before overbought exhaustion.
If NVDA can break above $188.50–$189, it could trigger a short-term shift from compression to expansion. However, if it rejects once more, the next retest of $185 could accelerate selling momentum.
GEX Validation (1H Chart Insight)
Gamma Exposure (GEX) levels on the 1-hour chart confirm a clear neutral-to-bullish setup if NVDA maintains above $185. The highest positive NET GEX / Call Wall aligns around $192.5–$195, suggesting strong dealer resistance in that region. A sustained breakout above $190 could ignite a push toward those upper zones if option flows turn supportive.
On the downside, Put support levels are clustered between $174–$180, forming a strong hedge-based demand area. The IVR of 9.8 and IVX avg 42.1 indicate a calm volatility environment, leaving room for expansion once direction confirms. Interestingly, Calls only account for 8.6% of flow — a potential contrarian signal if short-term momentum strengthens.
Trade Scenarios for the Week (Oct. 6–11)
Bullish Case:
If NVDA breaks and holds above $189, momentum could accelerate toward $191 (minor resistance) and potentially $195, where the next Call Wall sits.
* Entry: Above 189 confirmation
* Target 1: 191
* Target 2: 195
* Stop-Loss: Below 186
Bearish Case:
Failure to reclaim $189 and a breakdown below $185 could drag NVDA toward $182.50 or even $180, testing the lower bound of the Put Wall zone.
* Entry: Below 185
* Target 1: 182.5
* Target 2: 180
* Stop-Loss: Above 188
Option Insights
With gamma tightly balanced near current price, NVDA may be entering a coil phase before a directional break. Traders may look for short-term call spreads near 190–195 for upside confirmation, or put spreads near 185–180 if weakness resumes. The low IVR favors directional debit plays early in the week.
My Thoughts
This setup feels like a tug-of-war between dip buyers and short-term momentum sellers. NVDA’s structure suggests compression nearing resolution — the first clean break outside this falling channel will set the tone for the week.
If buyers can clear $189 with conviction, the path to $192–195 opens quickly. If not, the bears will likely reassert pressure back toward $182. The MACD and Stoch RSI alignment suggest a short-term bounce first, but the broader trend remains fragile until the channel is broken decisively.
Disclaimer:
This analysis is for educational purposes only and does not constitute financial advice. Always perform your own due diligence and manage your risk responsibly before trading.

It's time to burst the bubbleMacro factors
1) Profit-taking
2) Tariff increases and conflicts of interest with Asian countries
3) Bond growth
4) Sell-off across all markets (precious metals will trigger a portfolio sell-off)
5) Problems with Bitcoin mining; expenses will exceed revenues.
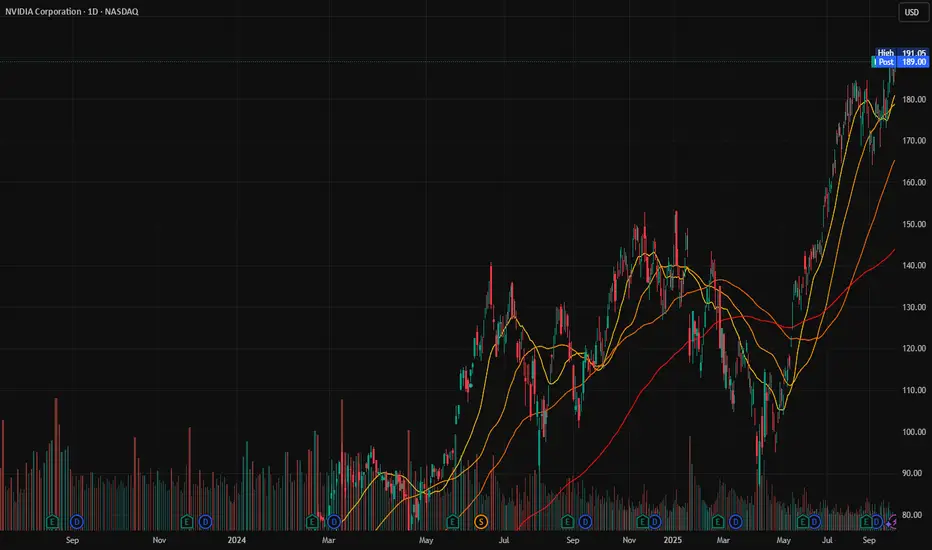
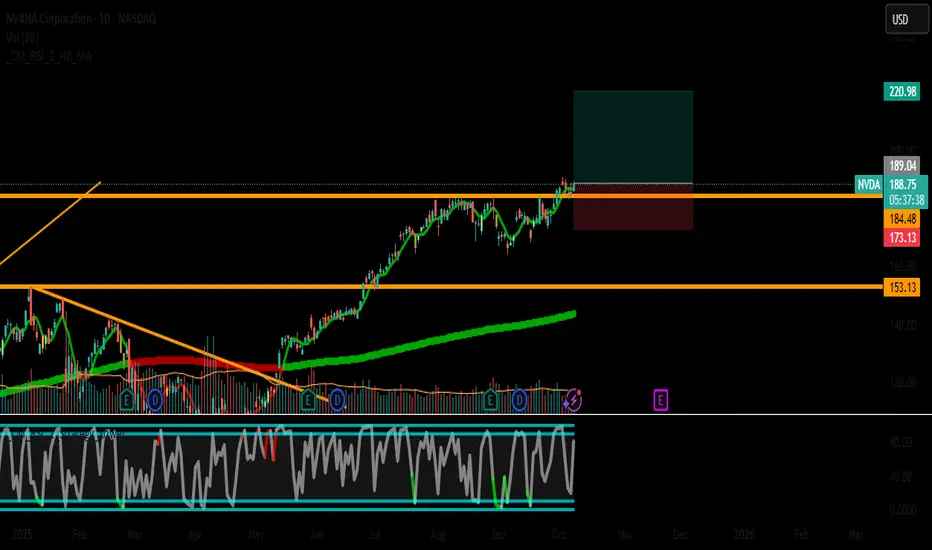
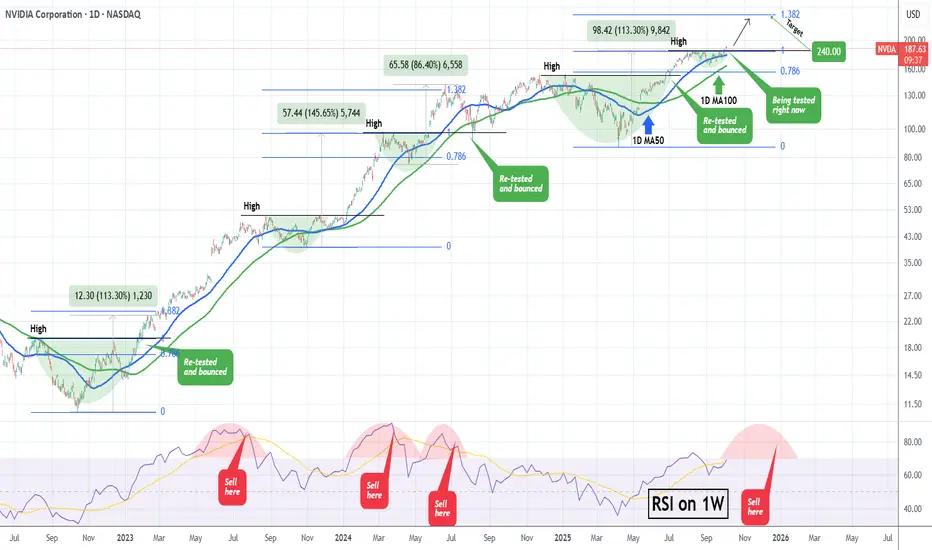
NVIDIA What happens when it retests a Resistance after a break?NVIDIA Corporation (NVDA) has been on a strong rise since the mid-term September 05 Low and this week finally broke above its previous $184 High. During the current Bull Cycle (since the October 2022 bottom), every time the price broke above a previous High and re-tested it as a Support, it started a secondary rally to new Highs.
Technically, as long as the 1D MA100 (green trend-line) holds, we should see at least a 1.382 Fibonacci extension test, similar to the February 2023 and June 2024 Highs. As a result, once the current former High / Resistance level finishes getting re-tested, we expect an end-of-the-year rally to $240.
Additionally, we will keep an eye on the 1W RSI. Typically, once it gets massively overbought above 85.00 and then starts to decline within an Arc peak formation, the time to Sell is after the middle of that Arc.
-------------------------------------------------------------------------------
** Please LIKE 👍, FOLLOW ✅, SHARE 🙌 and COMMENT ✍ if you enjoy this idea! Also share your ideas and charts in the comments section below! This is best way to keep it relevant, support us, keep the content here free and allow the idea to reach as many people as possible. **
-------------------------------------------------------------------------------
💸💸💸💸💸💸
👇 👇 👇 👇 👇 👇
TA Never Fails, But Traders Often Do
Why Technical Analysis Doesn’t Fail, and How to Make It Work for You
Has it ever happened to you that your system or technical analysis gives you the perfect signal… and the trade still goes wrong? And then, other times, with the exact same pattern, everything clicks magically and you end up with textbook profits, the kind proudly posted on social media.
Every trader has felt that same confusion at some point. At some stage in their career, every trader has questioned whether technical analysis really works. And if that question still lingers unanswered in your mind, this post is for you.
Here, I’ll walk you through why technical analysis sometimes seems to work like magic and other times fails miserably, and, more importantly, how understanding its true role can turn it into a tool that meaningfully strengthens your trading
Understanding the Real Role and Reach of Technical Analysis
At its core, technical analysis (TA) studies past price and volume behavior. But here’s the key point many overlook: expecting it to predict the future with certainty is like assuming that because something happened under certain conditions once, it will play out exactly the same way again. That’s rarely true.
When you rely on a chart pattern or setup, what you’re really hoping for is that the market environment hasn’t changed much. But markets don’t stay still. They are dynamic, adaptive, and constantly shifting. That’s why sometimes the “perfect” signal delivers textbook profits… and other times it collapses into a loss.
I’m sure you can relate: you spot the perfect setup, take the trade with full confidence, everything looks aligned, and then Powell makes a comment, volatility spikes, and your stop is hit in seconds. Did technical analysis fail? Not really. The conditions changed, and the past environment could not be reproduced.
From this perspective, TA stops being a deterministic tool (“if price breaks support, the market will fall”) and becomes a probabilistic one (“if price breaks support, there’s a certain probability the market will fall”). This isn’t a weakness, it’s an honest recognition of the uncertainty that governs financial markets and their ever changing nature.
When we strip away the myths and put technical analysis in its rightful place, it becomes clear: at best, TA allows us to frame probabilities, never certainties. It’s not a crystal ball, it’s a framework for making informed probabilistic assessments in a world that will always remain uncertain.
Where the True Power of TA Really Lies
Take the classic example: “if price breaks support, the market has a higher probability of falling than of rising.” That statement doesn’t promise certainty, but if it turns out that, say, 60% of the time the market does fall after breaking support, then you’ve uncovered something valuable: an edge.
And here’s where trading shifts from chasing luck to building consistency. If out of every 10 trades, 6 follow through in your favor, then all you really need is solid risk management, for example, keeping a minimum 1:1 risk to reward ratio. Do that, and over the long run you don’t just “sometimes win,” you run a system with a positive expectancy.
Once you’ve found that edge, the real trick is repetition. And this isn’t just motivational talk, it’s math. Statistics has a law (and in science, a law means tested truth) that guarantees the more you repeat your process, the closer your actual results will move toward that expected 60/40 edge. With discipline and patience, the math will always pull you back toward being a long term winner.
This also means you don’t second guess yourself the next time the market breaks support just because the last time it didn’t work out (thanks, Powell). You keep playing your probabilistic edge. The outcome of a single trade is irrelevant, what matters is the process repeated over time. I wrote about this earlier, and it’s worth remembering: consistency in applying your edge always beats obsessing over one result.
TA as a Compass, Not a Crystal Ball
The smartest and most effective use of technical analysis is not to predict exact prices, but to build a probabilistic edge.
TA only becomes truly powerful when it’s integrated into a system with positive expectancy, not when it’s treated like an oracle. It’s not about guessing where the next tick will land, but about shaping a repeatable process that, over time, compounds into long term gains.
Seen in this light, TA stops being a magic wand and instead becomes a compass, a steady guide to help you navigate with consistency. You don’t need to know the exact shape of every curve in the road. What you need is a reliable compass and a clear map that, with enough repetition, will get you to your destination.
How to Make TA Not Fail You
The key takeaway is simple: the problem isn’t that technical analysis “fails,” but how we interpret it and what we expect from it. Demanding certainty only leads to frustration and blinds us to its real value.
Used probabilistically and as part of a structured system, TA becomes a valuable ally. So the next time that ‘perfect setup’ fails, don’t waste energy asking what went wrong. You already know, it’s just uncertainty doing its job. Don’t let it shake your confidence, and don’t let Powell, or anything else, ruin your day. Instead, focus on the next repetition, because that’s where your edge truly lives.
The market doesn’t owe you certainty. But with an edge and discipline, probability will reward you with consistency, and that’s what compounds into real results
________
👉 If you’d like to dig deeper into this mindset shift, check out my earlier post on True Laser Vision, where I explain why projecting the value of your account is infinitely more powerful than trying to project the price of an asset. And if you’d like a more structured walk through these ideas, visit my profile, you’ll find plenty of posts where I break down how probability, expectancy, and discipline can catapult your trading to the next level. Follow along if you want to keep sharpening these skills
NVDA Holding the Line – Gamma Magnet at $190 for Oct 3 Intraday Technical Outlook (15m Chart)
NVIDIA (NVDA) closed near $188.97, stabilizing after an intraday fade from the $191 zone. On the 15-minute chart, price action shows consolidation with buyers trying to defend key support:
* MACD: Flattening and curling back toward neutral, signaling momentum could flip positive if buyers step in early tomorrow.
* Stoch RSI: Pushed back into overbought levels, showing near-term buying strength but also risk of quick pullbacks.
* Key Levels: Support rests at $188–187.2, with stronger downside protection near $185. Resistance is set at $191–192, the prior high and channel top.
Intraday takeaway: NVDA is range-bound between $187 and $191. A breakout above $191 can accelerate toward $193–195, while a failure to hold $187.2 risks a slide back toward $185.
Options Sentiment & GEX Outlook (1H Chart)
The 1-hour GEX setup highlights a tight battle around current levels:
* Gamma Walls:
* $191–192.5: Strongest positive GEX / call wall cluster — key resistance zone.
* $187.5–185: Gamma pivot and support levels where buyers may defend.
* $180 / $175: Put wall supports if selling pressure intensifies.
* Implications:
* Sustaining above $188.5–189 keeps NVDA magnetized toward the $191–192.5 call wall.
* If $187.2 fails, dealer flows may drive price toward $185 and potentially $180.
* Volatility Context: IVR sits at 10.1 (very low), meaning options are cheap relative to history. This makes directional call/put buys attractive — but also means sellers risk getting trapped if momentum surges.
My Thoughts & Recommendation
For Oct 3 trading, NVDA sits at a gamma pivot with a tight setup:
* Intraday (scalping/trading): Longs favored above $188.5, targeting $191–192.5. Quick rejection at $191 can be shorted back to $187.2–185.
* Options trading (swing/0DTE): Calls make sense only above $189–190 for a breakout chase toward $193–195. If NVDA fails at $191 and dips below $187.2, puts targeting $185–180 have cleaner risk/reward.
Bias heading into Oct 3: Neutral-to-bullish, but watch $191 as the breakout test.
Disclaimer:
This analysis is for educational purposes only and does not constitute financial advice. Always do your own research and manage risk before trading.
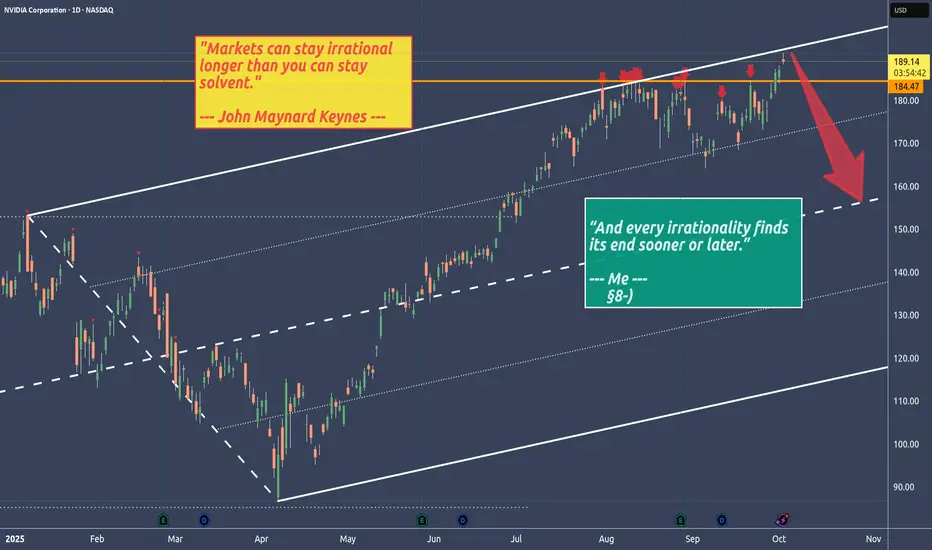
NVIDIA - Stalking NVDA with a short trade in mind🔱 Second approach to crack the U-MLH 🔱
No matter how irrational markets get, sooner or later the Black Bird strikes them down.
We’re back at the U-MLH where price is stretched.
Could it trade through it?
Absolutely.
Even better would be if price trades above the U-MLH and then falls back into the fork — that would be a strong confirming short signal.
But a turn right at the U-MLH would also be a heads-up for me.
👉 Stalking NVDA with a short trade in mind.
NVIDIA - LONG POSITIONNVIDIA (NVDA) – Upside Potential Toward $210
Currently, NVIDIA's price is trading around $189.5. The chart shows clear signs of strength, with a technical structure that suggests a possible bullish continuation in the medium term.

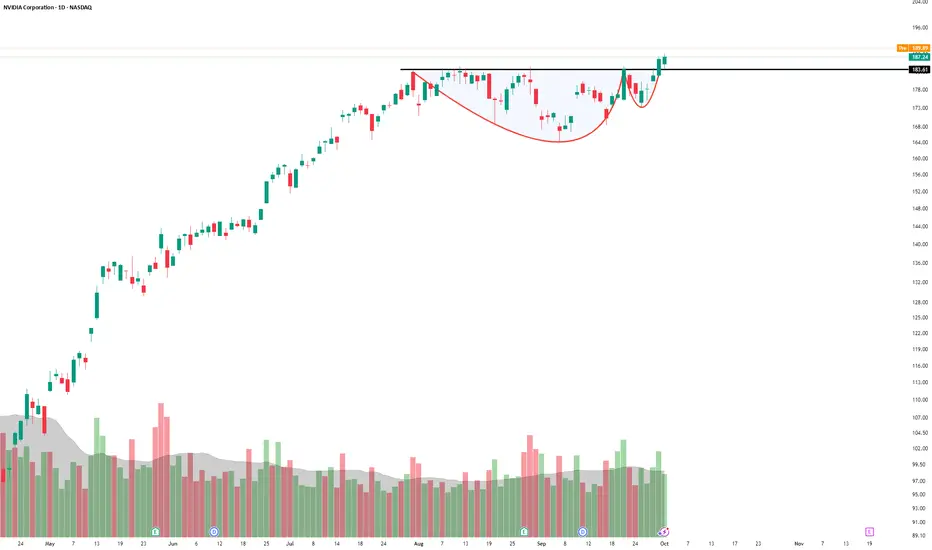
NVDA Breaking Out ... Yet Again!NASDAQ:NVDA is just unstoppable. It broke out again from this base which can also qualify as a cup and handle (C&H) continuation. Going by the size of pattern, it could very well he hitting 200 soon, though exact size comes at around 205.
Introduction to Time Zone Arbitrage in Global Markets1. Understanding Arbitrage in Financial Markets
At its core, arbitrage is the practice of exploiting price discrepancies of the same asset across different markets or forms to earn risk-free profit. This fundamental concept underpins much of modern financial trading. In theory, if a stock, currency, commodity, or derivative is priced differently in two markets, a trader can simultaneously buy low in one market and sell high in another, pocketing the difference.
Traditional arbitrage opportunities are rare and fleeting, especially in highly liquid and technologically advanced markets. With the advent of electronic trading, algorithmic strategies, and high-frequency trading, the speed at which these discrepancies are corrected has accelerated dramatically.
Time zone arbitrage emerges as a special form of arbitrage, where the temporal differences between markets become the primary source of exploitable inefficiencies. The financial world is never closed: while one market sleeps, another operates, creating windows for traders to capitalize on lagging price reactions.
2. Global Markets and Time Zones
Financial markets operate within strict local hours. For example:
New York Stock Exchange (NYSE): 9:30 AM – 4:00 PM EST
London Stock Exchange (LSE): 8:00 AM – 4:30 PM GMT
Tokyo Stock Exchange (TSE): 9:00 AM – 3:00 PM JST
These schedules create overlapping periods—for instance, NYSE and LSE overlap between 8:00 AM and 11:30 AM EST—where liquidity and volatility peak. However, outside these overlaps, markets function independently, and information from one market may not immediately influence another due to operational hours.
Time zone arbitrage exploits these gaps. For instance, significant economic data released in the U.S. after the Asian markets close can create arbitrage opportunities for traders when Asian markets reopen the next day. Essentially, traders are leveraging information delays caused by non-synchronous trading hours.
3. Mechanisms of Time Zone Arbitrage
Time zone arbitrage typically involves three major mechanisms:
Price Discrepancy Exploitation:
When an asset trades in multiple markets, its price may diverge temporarily due to the staggered opening hours. For example, a stock listed on both NYSE and LSE might react to corporate news at different times. A trader can buy in the lagging market and sell in the one where the news impact has already been reflected.
Currency Movements:
Forex markets operate 24/5, but liquidity and volatility vary by time zone. Economic announcements from one country may cause currency pairs to move in one region before others react. Traders who monitor these shifts can execute trades across regions to capture price differences.
Futures and Derivatives Arbitrage:
Futures and derivatives tied to underlying assets in different time zones can experience lagged reactions. For example, S&P 500 futures traded in Singapore may temporarily misprice relative to the U.S. cash market during Asian hours. Arbitrageurs can exploit these short-term inefficiencies.
4. Drivers of Time Zone Arbitrage Opportunities
Several factors contribute to the emergence of time zone arbitrage opportunities:
Information Asymmetry:
Not all markets receive or process information simultaneously. Corporate earnings announcements, economic data releases, or geopolitical events may affect markets differently depending on their opening hours.
Liquidity Gaps:
Markets in non-overlapping time zones may have lower trading volumes, causing temporary price inefficiencies. These liquidity gaps are prime targets for arbitrage strategies.
Currency and Macro-Economic Events:
Global macroeconomic releases—like U.S. Non-Farm Payrolls or European Central Bank announcements—impact multiple markets. Since these announcements occur during specific time zones, traders in other regions may act ahead of local market participants.
Technological Differences:
Not all markets are equally automated. While developed markets adjust quickly due to algorithmic trading, emerging markets may show delayed price reactions, enhancing arbitrage potential.
5. Examples of Time Zone Arbitrage
5.1 Forex Market
A classic example is the USD/JPY pair. Suppose a major U.S. economic report releases at 8:30 AM EST. Tokyo traders may not react until the TSE opens at 9:00 AM JST, creating a brief window where the currency pair’s price is misaligned with the news. Arbitrageurs can profit by executing trades between London, Tokyo, and New York markets.
5.2 Stock Market Cross-Listings
Many multinational companies list their shares in multiple exchanges. For example, HSBC trades in London, Hong Kong, and New York. If news affects the Hong Kong market during its daytime, traders can exploit the lag in New York’s reaction to the same news due to time differences.
5.3 Commodities Futures
Consider crude oil futures, which trade in both the CME in the U.S. and the Intercontinental Exchange (ICE) in London. A geopolitical event affecting oil supply may influence ICE prices during European hours, but CME futures may take time to adjust until New York opens, offering arbitrage potential.
6. Tools and Techniques
Modern time zone arbitrage relies heavily on technology. Key tools include:
Algorithmic Trading Systems:
These monitor multiple markets simultaneously, identify mispricings, and execute trades in milliseconds.
High-Frequency Trading (HFT):
Leveraging microsecond speed, HFT firms can capitalize on arbitrage opportunities across time zones before others detect them.
Data Feeds and News Analytics:
Real-time economic and corporate news feeds, combined with AI-powered sentiment analysis, allow traders to anticipate cross-market price movements.
Cross-Market Surveillance:
Continuous monitoring of correlated instruments across regions ensures timely identification of exploitable discrepancies.
7. Risks and Constraints
While time zone arbitrage is theoretically low-risk, several practical challenges exist:
Execution Risk:
Delays in order execution can turn profitable trades into losses.
Transaction Costs:
Spreads, commissions, and fees may erode arbitrage profits, especially in lower-liquidity markets.
Market Volatility:
Unexpected price swings due to global events may render arbitrage positions unprofitable.
Regulatory Barriers:
Some jurisdictions impose restrictions on cross-border trading, capital flows, or short-selling, limiting arbitrage potential.
Technological Risks:
Reliance on connectivity, data feeds, and trading algorithms exposes traders to system failures or cyber risks.
8. Strategies for Time Zone Arbitrage
Successful traders use a mix of strategies:
Cross-Exchange Arbitrage: Exploiting price differences for the same security on multiple exchanges.
Statistical Arbitrage: Using historical correlations and statistical models to predict and trade mispricings.
Latency Arbitrage: Capitalizing on delays in data transmission between markets.
Macro-Event Arbitrage: Reacting to economic, political, or corporate events affecting global markets asynchronously.
9. Market Participants
Time zone arbitrage is primarily the domain of:
Institutional Traders: Hedge funds and proprietary trading desks dominate this space due to the scale and technology required.
High-Frequency Traders: Specialize in exploiting microsecond-level price discrepancies.
Global Asset Managers: Engage in cross-market hedging and arbitrage as part of portfolio optimization.
Retail Traders: Increasingly accessing time zone arbitrage opportunities through online platforms and ETFs, though on a smaller scale.
10. Broader Implications for Global Markets
Time zone arbitrage plays a vital role in market efficiency:
Price Discovery: Arbitrage helps synchronize prices across markets, improving transparency.
Liquidity Distribution: Facilitates smoother capital flows between regions.
Integration of Emerging Markets: Encourages alignment with global market trends.
Technological Advancements: Drives innovation in trading systems, data analytics, and risk management.
However, it can also introduce systemic risks. Over-reliance on algorithms or HFT in multiple time zones may amplify volatility during unexpected events, as seen in global “flash crashes.”
11. The Future of Time Zone Arbitrage
The evolution of global markets suggests that time zone arbitrage will continue to grow in complexity:
24/7 Markets: Cryptocurrency and digital asset markets operate round-the-clock, reducing traditional time gaps but creating new cross-exchange arbitrage opportunities.
AI and Machine Learning: Predictive models can detect emerging arbitrage opportunities faster than human traders.
Global Market Integration: As emerging markets align with major exchanges, arbitrage windows may shrink, but sophisticated strategies will continue to exploit subtler inefficiencies.
Regulatory Evolution: Harmonization of cross-border trading rules may reduce some arbitrage opportunities but also create standardized pathways for institutional strategies.
12. Conclusion
Time zone arbitrage is a sophisticated yet fundamental aspect of modern financial markets. By leveraging temporal gaps between global markets, traders can exploit price inefficiencies for profit. Its successful execution requires advanced technology, rapid decision-making, deep market knowledge, and careful risk management.
While it enhances market efficiency and integration, it also introduces challenges related to volatility, regulation, and technological dependency. As markets evolve—especially with the rise of 24/7 digital trading—time zone arbitrage will remain a critical area for institutional traders, high-frequency operations, and innovative investment strategies.
Ultimately, time zone arbitrage highlights the interconnectedness of global finance, demonstrating that even a world divided by hours can be united by the continuous pursuit of opportunity.
NVDA: A new ATH, at what cost?As NVDA climbs to new ATH’s, it still struggles to break through resistance. it’s my belief that we revisit 179 before seeing 200. thoughts are appreciated, thanks.
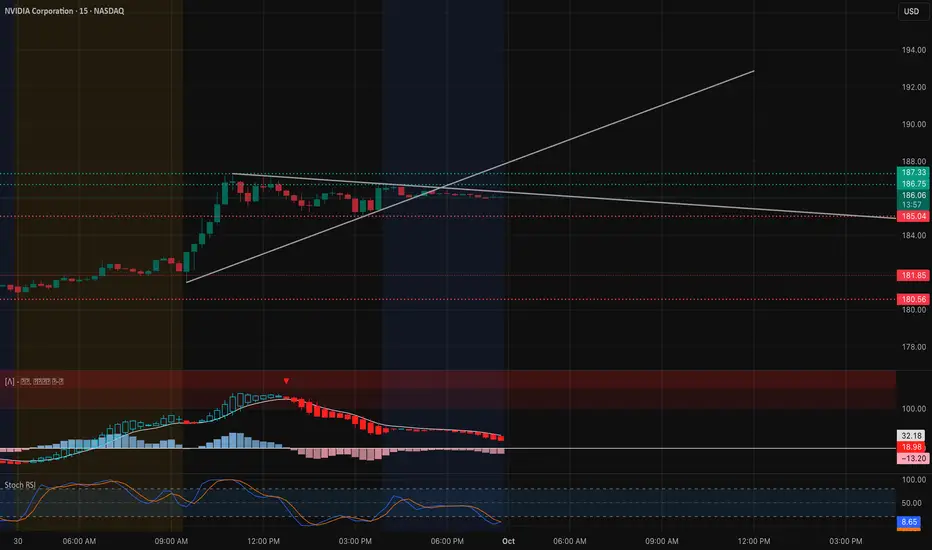
NVDA Oct. 1 – Knocking on the Door of a Breakout! Intraday View (15-Min Chart)
NVDA ripped higher early but is consolidating around $186 into the close. Price is riding the intraday trendline, though momentum is fading.
* Support Levels: $185.00, $181.85, $180.56
* Resistance Levels: $186.75, $187.33, $188.00
* Indicators: MACD is losing steam with red bars extending. Stoch RSI is buried at lows, showing possible oversold conditions.
📌 Intraday Thought (Oct. 1): If $185 holds, NVDA could bounce back toward $187–$188. A break below $185 risks a flush to $182 and possibly $181.5. Scalpers can lean long on $185 support with tight risk, or fade near $187.5 if momentum stalls.
Options & Swing View (1H + GEX)
Gamma positioning shows a clear setup:
* Call walls: Big resistance at $187.5–$190, with stacked GEX above.
* Put support: Clustered near $175–$170, with a hard floor around $170.
This implies NVDA is pinned between $185–$190 short term. A confirmed break over $187.5 opens upside momentum toward $190–$195, while losing $185 risks a retrace back to $182 → $175 zone.
* Bullish Play (Oct. 1): Calls or debit spreads targeting $190–$195 if $187.5 breaks on volume.
* Bearish Hedge: Short puts toward $182 → $175 if $185 fails.
* Neutral Play: Iron condor between $175–$190 for premium capture while NVDA consolidates.
My Thoughts (Oct. 1)
NVDA is pressing right into a breakout zone. The tape favors bulls as long as $185 holds, but momentum is clearly cooling on intraday charts. I’d treat $187.5 as the trigger line: over it, we could squeeze to $190+ quickly. Below $185, downside opens fast toward $182. Flexibility is key here—trade the levels, not the noise.
Disclaimer: This analysis is for educational purposes only and does not constitute financial advice. Always do your own research and manage risk before trading.