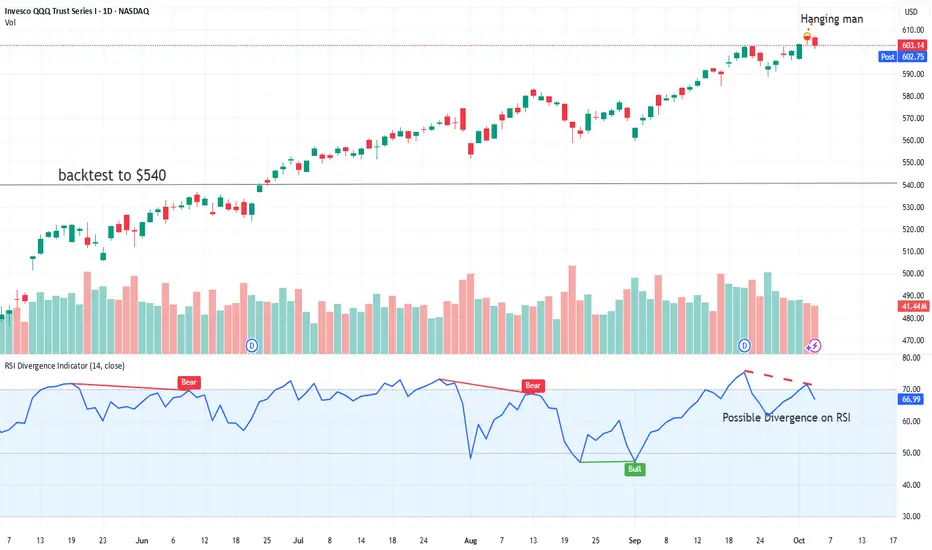
Weak setup for next weekDiverging RSI confirmed with today's faded rally. Lots of uncertainty with the shutdown, but also no release of government data. How will the Fed know to lower rates without data? Markets are at all-time highs, but also at all-time high VALUATIONS. P/S, Case Shiller PE, Earnings Yield, and others a
Key facts today
Key stats
About Invesco QQQ Trust Series I
Home page
Inception date
Mar 10, 1999
Structure
Unit Investment Trust
Replication method
Physical
Dividend treatment
Distributes
Distribution tax treatment
Qualified dividends
Income tax type
Capital Gains
Max ST capital gains rate
39.60%
Max LT capital gains rate
20.00%
Primary advisor
Invesco Capital Management LLC
Distributor
Invesco Distributors, Inc.
ISIN
US46090E1038
QQQ is one of the most established and actively traded ETFs in the world, albeit one of the most unusual. The product is one of a few ETFs structured as a unit investment trust. Per the rules of its index, the fund only invests in nonfinancial stocks listed on NASDAQ, and effectively ignores other sectors too, causing it to skew massively away from a broad-based large-cap portfolio. QQQ has huge tech exposure, but it is not a 'tech fund' in the pure sense either. The fund's arcane weighting rules further distance it from anything close to plain vanilla large-cap or pure-play tech coverage. The ETF is much more concentrated in its top holdings and is more volatile than our vanilla large-cap benchmark. Still, the fund has huge name recognition for the underlying index, the NASDAQ-100. In all, QQQ delivers a quirky but wildly popular mash-up of tech, growth, and large-cap exposure. The fund and index are rebalanced quarterly and reconstituted annually.
Related funds
Classification
What's in the fund
Exposure type
Electronic Technology
Technology Services
Stock breakdown by region
Top 10 holdings
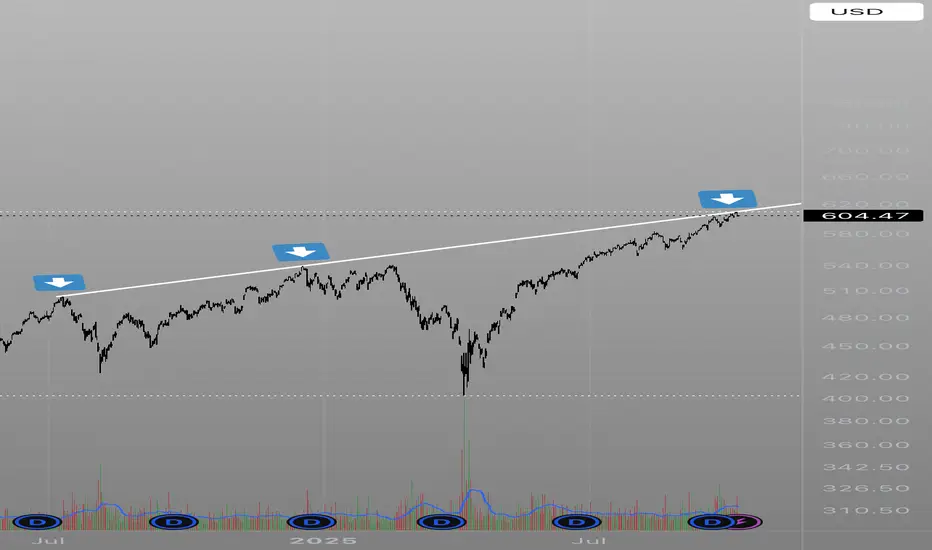
$QQQ: Rejected off massive resistanceQQQ has now rejected off this resistance 3 times spanning back to july ‘24. Do the bulls have enough steam left to push this over the line or will the bears get a chance to feast?
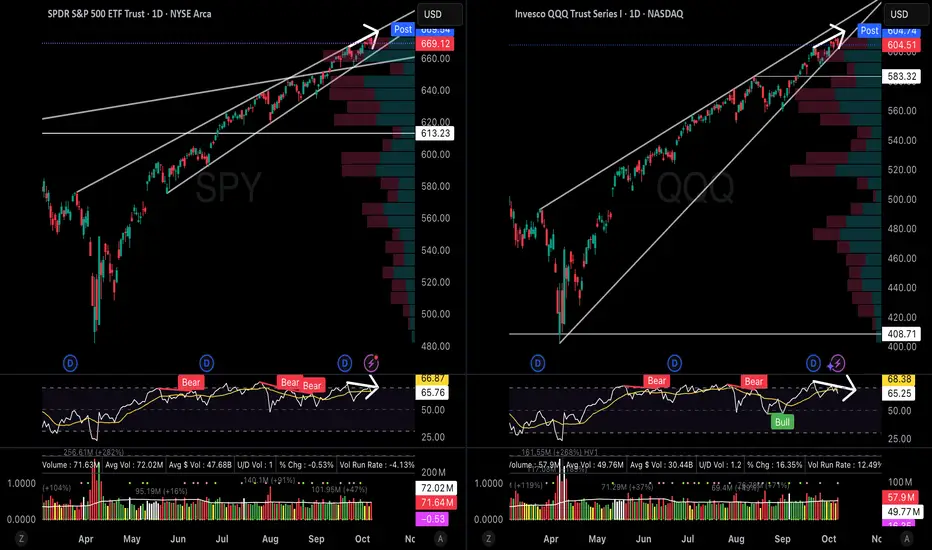
SPY/QQQ Bearish Divergence, VIX Compression, XLK→XLV Rotation After a month building my automated pattern detection system (Legend AI) and preparing for CMT Level I, I returned to find one of the cleanest technical setups of 2025—and today it's showing early signs of confirmation.
━━━━━━━━━━━━━━━━━━━━━━━━
THE SETUP: BEARISH DIVERGENCE NEAR ALL-TIME HIGHS
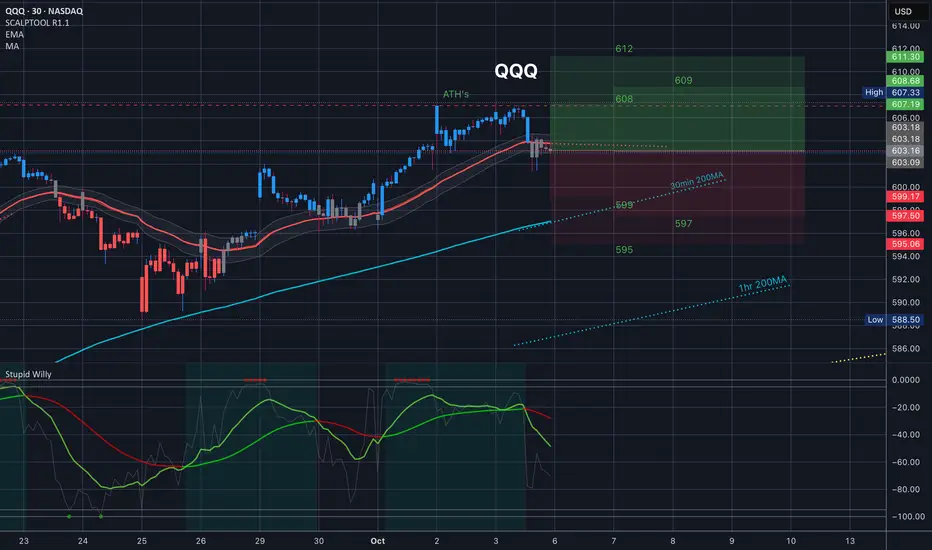
$QQQ Tomorrow's Trading range 10.6.25
We closed right at the 35EMA so that is right in the middle and will be a key level. 30min 200MA is just underneath the bottom of the implied move so if for whatever reason we come near it look to it as a support to pop us back into the implies move. And of course above us we have ATH's.
Just
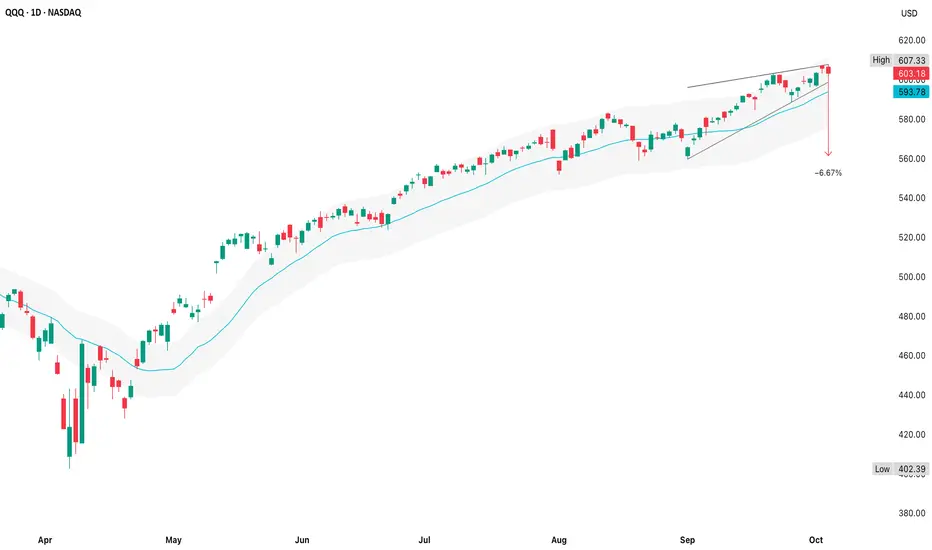
QQQ (3 October)The rising wedge (marked by the two converging trendlines) is a classic loss-of-momentum pattern
Price hit the upper boundary near $607 & closed back below $604 - a rejection right at resistance
The measured move (-6.7%) projects down toward roughly $565–$570, aligning neatly with the lower boun
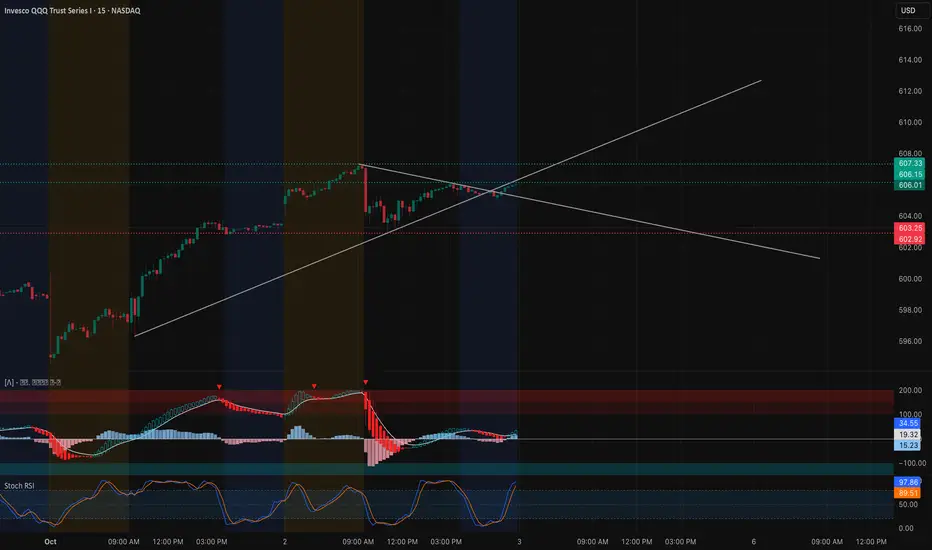
QQQ Tightening Up – Gamma Levels Will Decide Oct 3 Intraday Technical Outlook (15m Chart)
The QQQ closed near $606.01, coiling into a wedge formation after a strong upward push. On the 15-minute chart, the price is sitting right at a confluence of support and resistance trendlines:
* MACD: Starting to recover after a bearish dip, showing early signs
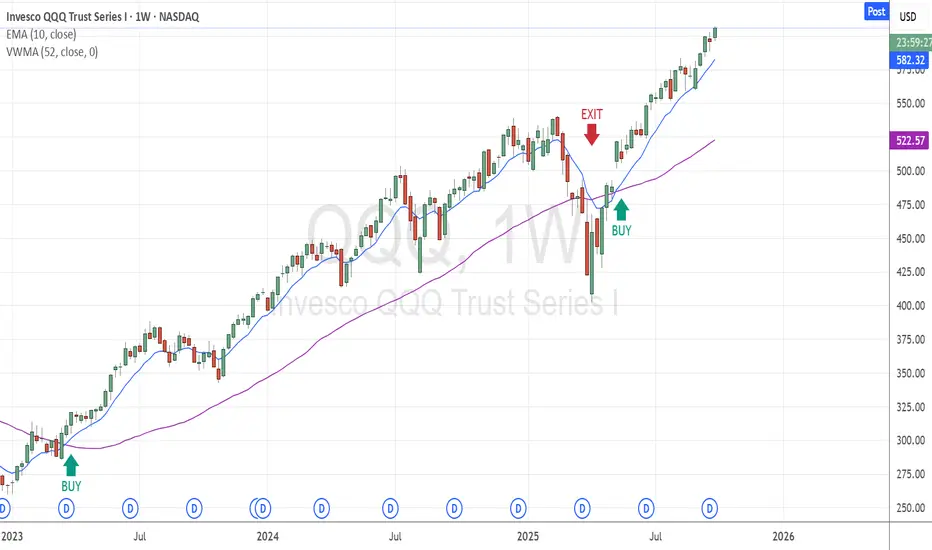
Simple Investment Strategy (Long Term only)This strategy is designed for long-term investors using a simple, two-indicator setup on the weekly chart:
• VWMA (Volume-Weighted Moving Average) – 52-period
• EMA (Exponential Moving Average) – 10-period
✅ Entry Signal (Buy)
• Enter a position when the 10-period EMA crosses above the 52-period
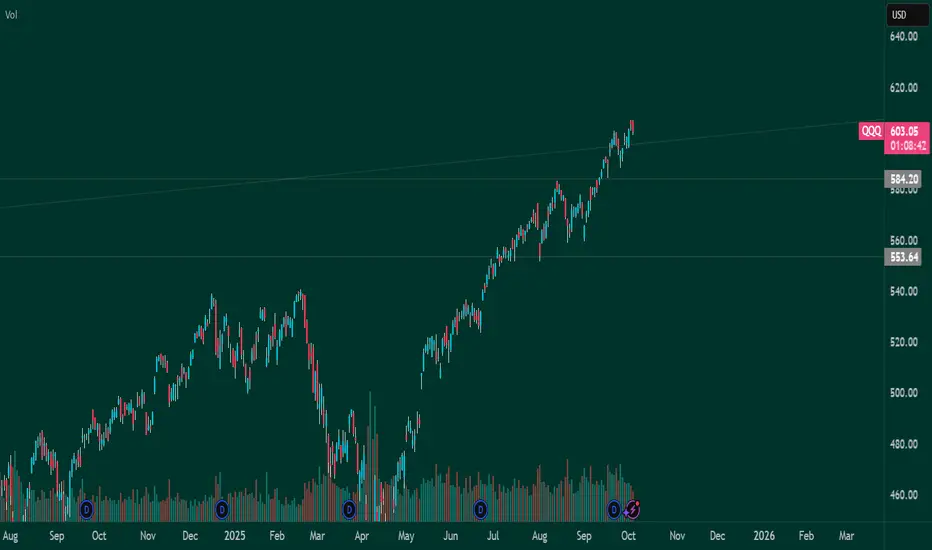
Small Correction 5-10% ?Looks like we will have a small correction hopefully not more than 10%. It could be a good time to buy the dip in nvda, orcl, crwd etc.
Happy trading !!
Not a financial advice.
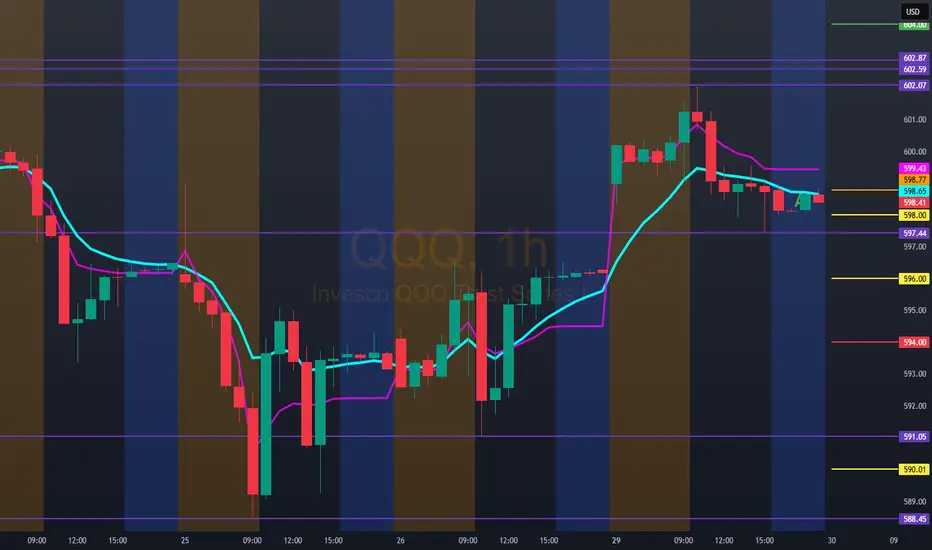
Hello trader, for tomorrow 9/30/25 QQQ: 598.73Bullish entry above 604.00/606.00 with a double top of 602.87, stop below the VAWP.
Bearish entry only below 594.00. The price could rebound to 596.00. If it breaks 596.00, our bearish entry for continuity is 594.00, possible up to 590.00, stop above the VAWP.
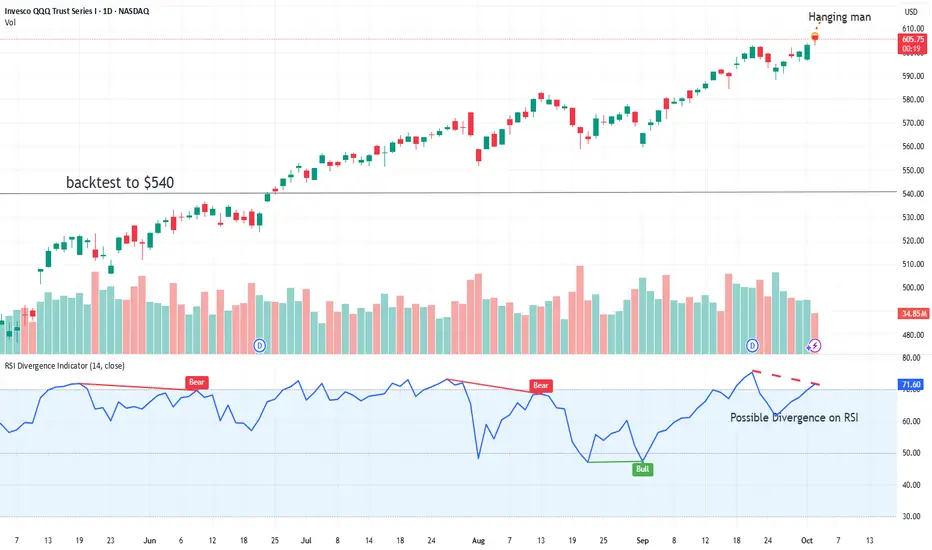
Possible Bearish Divergence with Hanging Man HammerPossible reversal pattern. Lower Highs on RSI with Higher Highs on price.
Daily candle is a hanging man.
See all ideas
Summarizing what the indicators are suggesting.
Oscillators
Neutral
SellBuy
Strong sellStrong buy
Strong sellSellNeutralBuyStrong buy
Oscillators
Neutral
SellBuy
Strong sellStrong buy
Strong sellSellNeutralBuyStrong buy
Summary
Neutral
SellBuy
Strong sellStrong buy
Strong sellSellNeutralBuyStrong buy
Summary
Neutral
SellBuy
Strong sellStrong buy
Strong sellSellNeutralBuyStrong buy
Summary
Neutral
SellBuy
Strong sellStrong buy
Strong sellSellNeutralBuyStrong buy
Moving Averages
Neutral
SellBuy
Strong sellStrong buy
Strong sellSellNeutralBuyStrong buy
Moving Averages
Neutral
SellBuy
Strong sellStrong buy
Strong sellSellNeutralBuyStrong buy
Displays a symbol's price movements over previous years to identify recurring trends.
Frequently Asked Questions
An exchange-traded fund (ETF) is a collection of assets (stocks, bonds, commodities, etc.) that track an underlying index and can be bought on an exchange like individual stocks.
QQQ trades at 610.09 USD today, its price has risen 1.15% in the past 24 hours. Track more dynamics on QQQ price chart.
QQQ net asset value is 611.62 today — it's risen 5.69% over the past month. NAV represents the total value of the fund's assets less liabilities and serves as a gauge of the fund's performance.
QQQ assets under management is 390.29 B USD. AUM is an important metric as it reflects the fund's size and can serve as a gauge of how successful the fund is in attracting investors, which, in its turn, can influence decision-making.
QQQ price has risen by 5.72% over the last month, and its yearly performance shows a 24.76% increase. See more dynamics on QQQ price chart.
NAV returns, another gauge of an ETF dynamics, have risen by 5.69% over the last month, showed a 10.71% increase in three-month performance and has increased by 27.45% in a year.
NAV returns, another gauge of an ETF dynamics, have risen by 5.69% over the last month, showed a 10.71% increase in three-month performance and has increased by 27.45% in a year.
QQQ fund flows account for 24.86 B USD (1 year). Many traders use this metric to get insight into investors' sentiment and evaluate whether it's time to buy or sell the fund.
Since ETFs work like an individual stock, they can be bought and sold on exchanges (e.g. NASDAQ, NYSE, EURONEXT). As it happens with stocks, you need to select a brokerage to access trading. Explore our list of available brokers to find the one to help execute your strategies. Don't forget to do your research before getting to trading. Explore ETFs metrics in our ETF screener to find a reliable opportunity.
QQQ invests in stocks. See more details in our Analysis section.
QQQ expense ratio is 0.20%. It's an important metric for helping traders understand the fund's operating costs relative to assets and how expensive it would be to hold the fund.
No, QQQ isn't leveraged, meaning it doesn't use borrowings or financial derivatives to magnify the performance of the underlying assets or index it follows.
In some ways, ETFs are safe investments, but in a broader sense, they're not safer than any other asset, so it's crucial to analyze a fund before investing. But if your research gives a vague answer, you can always refer to technical analysis.
Today, QQQ technical analysis shows the buy rating and its 1-week rating is strong buy. Since market conditions are prone to changes, it's worth looking a bit further into the future — according to the 1-month rating QQQ shows the strong buy signal. See more of QQQ technicals for a more comprehensive analysis.
Today, QQQ technical analysis shows the buy rating and its 1-week rating is strong buy. Since market conditions are prone to changes, it's worth looking a bit further into the future — according to the 1-month rating QQQ shows the strong buy signal. See more of QQQ technicals for a more comprehensive analysis.
Yes, QQQ pays dividends to its holders with the dividend yield of 0.46%.
QQQ trades at a premium (0.03%).
Premium/discount to NAV expresses the difference between the ETF’s price and its NAV value. A positive percentage indicates a premium, meaning the ETF trades at a higher price than the calculated NAV. Conversely, a negative percentage indicates a discount, suggesting the ETF trades at a lower price than NAV.
Premium/discount to NAV expresses the difference between the ETF’s price and its NAV value. A positive percentage indicates a premium, meaning the ETF trades at a higher price than the calculated NAV. Conversely, a negative percentage indicates a discount, suggesting the ETF trades at a lower price than NAV.
QQQ shares are issued by Invesco Ltd.
QQQ follows the NASDAQ 100 Index. ETFs usually track some benchmark seeking to replicate its performance and guide asset selection and objectives.
The fund started trading on Mar 10, 1999.
The fund's management style is passive, meaning it's aiming to replicate the performance of the underlying index by holding assets in the same proportions as the index. The goal is to match the index's returns.