Rivian Automotive (RIVN) – Macro Rounding Bottom (Weekly Timefrahi traders,
This technical analysis evaluates the long-term chart of Rivian (RIVN), identifying a major structural shift from a prolonged downtrend to a potential multi-year recovery phase.
1. Technical Setup: The Rounding Bottom & Higher Lows
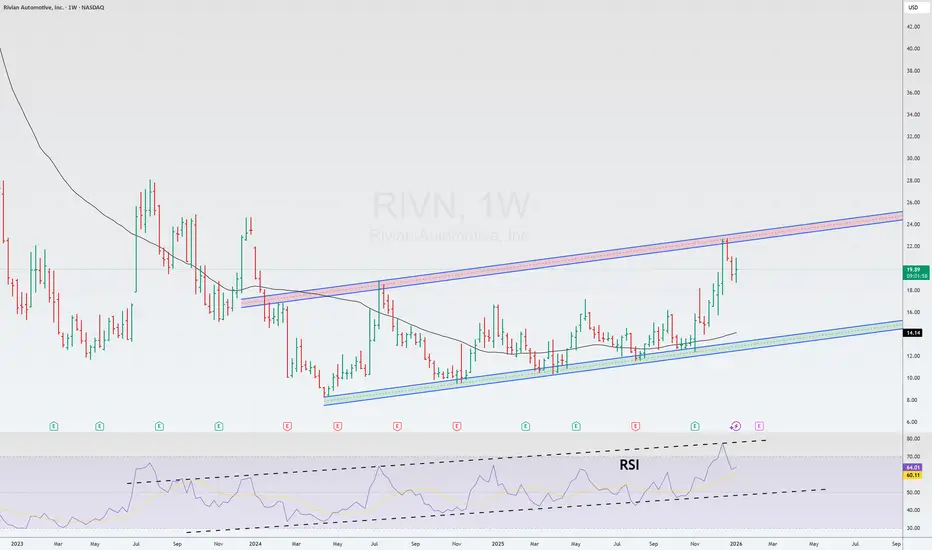
The most significant development on the weekly chart is the transition of price action from a vertical decline into a stable, rounding bottom structure.
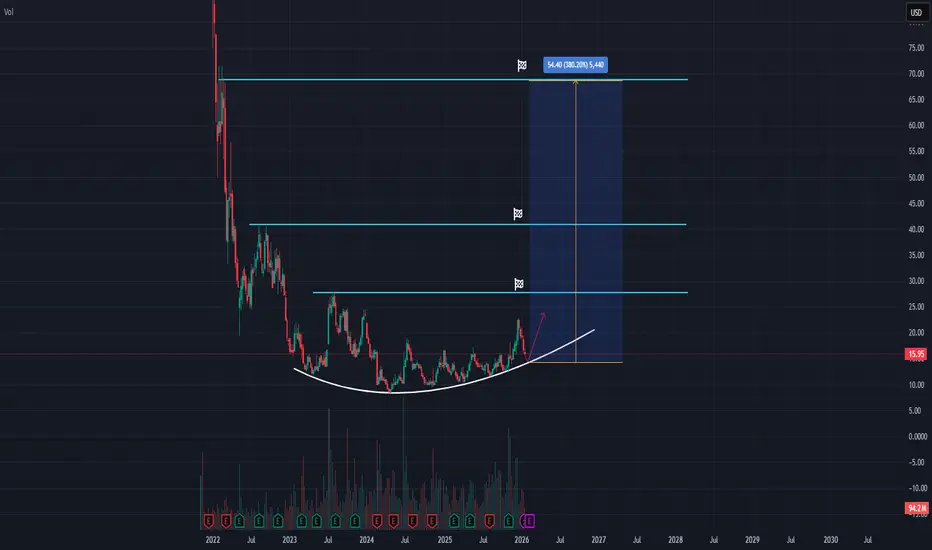
Higher Lows Creation: Since the major lows established in 2023 and early 2024, RIVN has begun to print a series of higher lows. This is visually represented by the white upsloping curve on the chart, which marks the boundary of the new accumulation phase.
Upsloping Price Action: The "bleeding" effect of the initial post-IPO sell-off has ceased. The price is now coiling and showing an upward bias as it follows the curve of the base. This indicates that institutional "smart money" is likely absorbing the remaining supply at these levels.
Support Validation: The level around $10.00 - $12.00 has served as a rock-solid floor, providing the foundation for this emerging uptrend.
2. Momentum & Structure
Consolidation: The price is currently trading near $15.95, resting just above the primary upsloping curve. This consolidation is healthy as it allows the stock to build energy for the next major leg up.
Volume Profile: The volume at the bottom of the structure shows spikes in buying activity, suggesting that the path of least resistance is gradually shifting to the upside.
3. Price Targets (Recovery Roadmap)
Based on the structural resistance levels and flags identified on the chart, we have three primary objectives for the coming years:
Target 1: ~$28.00 – The first major hurdle, representing a return to previous structural consolidation.
Target 2: ~$43.00 – A mid-term target that aligns with a significant historical breakdown point.
Target 3 (Macro Target): ~$70.00 – The ultimate objective for this reversal cycle. As indicated by the flag on the chart, a move to this level represents a massive +380.20% ($54.40) gain from the accumulation base.
4. Fundamental Context
Rivian continues to establish itself as a leader in the premium EV market. With the ramp-up of the R1 platform and the highly anticipated launch of the R2 and R3 models, the company is moving toward a more mass-market scale. This technical bottoming process aligns with the market's realization that Rivian is one of the few EV startups with the capital and brand loyalty to achieve long-term profitability.
Conclusion
The Weekly chart on RIVN is a classic example of a "macro bottom." The creation of higher lows and the upsloping price action suggest that the long-term trend has finally turned. With a clear roadmap toward the $70 target, the risk-to-reward ratio at these levels is exceptionally favorable for long-term investors.
What traders are saying
Trading Journal - January Bought really well and it went up really good really fast. Tried to give it room, to do what it needs to do, it was just coming out of stage 1 and getting to stage 2. Felt like a leader, no earnings, no theme.. So not sure why i thought that…
Another trade like TSLA that went up and took away the profits.
Key lesson, to sell ½ profits at certain price gain levels..

$RIVN Deep Retracement StructurePullback Into Key Zone
NASDAQ:RIVN has worked its way down into a technically significant retracement area that's catching my attention. We're seeing price test a mathematically-derived support zone that often marks the limit of healthy pullbacks in trending conditions.
The Technical Setup
Retracement Level:
Price is currently testing the 78.6% retracement level from the recent swing structure. This deep Fibonacci pullback zone around the $16 area represents where buyers historically step in to defend the larger move.
The 78.6% level is one of the deeper retracement ratios—when price holds here, it often signals that the underlying trend remains intact and that this is simply a correction rather than a reversal.
200-Day EMA Context:
Just below current levels, we have the 200-day EMA sitting around $14.30. This widely-watched moving average provides additional structural context and serves as a logical invalidation point for any bullish thesis.
If price were to close convincingly below the 200 EMA, it would suggest the correction is deeper than a standard retracement and the setup would be invalidated.
Risk-to-Reward Framework
What makes this particularly compelling is the asymmetric opportunity:
Defined Risk:
Stop placement below the 200-day EMA at approximately $14.30 creates a clear invalidation level. This represents logical downside if the retracement thesis is wrong.
Measured Upside Potential:
Extension back toward prior swing highs in the $22.50 zone provides the upside target. Measuring from current levels to the target, relative to the defined risk, gives us approximately 4:1 risk-to-reward ratio.
That's exceptional asymmetry risking one unit for the potential to gain four if the structure plays out.
Why This Area Matters
Confluence of Support:
78.6% Fibonacci retracement level
$16 psychological round number
Proximity to 200-day EMA support
Prior consolidation zone that could now act as support
When multiple technical factors align in the same area, it increases the probability that price respects the zone.
Swing Structure Logic:
Deep pullbacks that hold at the 78.6% level often produce strong reversionary moves back toward the prior high. This isn't random it's a function of how trend corrections tend to behave when the larger structure remains intact.
What I'm Watching
Price acceptance at the $16 zone - Need to see buyers defend this level
200 EMA behavior - Watching whether price holds above or violates this support
Volume on any bounce - Looking for increasing participation if reversal begins
Candle structure - Monitoring for reversal patterns or rejection wicks at current levels
The Measured Move
From the retracement low around $16, back to prior highs at $22.50, represents approximately $6.50 of potential upside movement.
With risk defined below $14.30, that's roughly $1.70 of downside if stopped out.
$6.50 potential gain vs $1.70 potential loss = 4R setup
This is the kind of reward-to-risk profile worth evaluating closely.
Position Considerations
Entry Zone: Current levels around the 78.6% retracement offer logical entry consideration
Invalidation Point: A close below the 200-day EMA would negate the retracement thesis
Target Projection: Return to prior swing highs represents the measured completion of the reversal
For specific entry techniques, scaling strategies, and detailed position management, full parameters will be available inside our trading room.
The Bigger Picture
This setup exemplifies proper swing structure analysis:
Identify a clear trend
Wait for a deep but proportional retracement
Find confluence at a key technical level
Define risk below structural support
Measure potential back to prior resistance
Evaluate if the risk-to-reward justifies the position
When all these elements align, you get setups like this high probability, asymmetric opportunities with defined parameters.
Patience Required
Retracement plays require patience. Price might consolidate at this level before reversing. It might test lower toward the 200 EMA before bouncing. The key is having a plan and letting the structure develop.
Don't chase let the level prove itself. If it holds and confirms, the 4R potential makes the wait worthwhile.
This analysis is for educational purposes and represents personal technical observations. All trading involves substantial risk. Fibonacci retracements and moving averages are tools for analysis, not guarantees of future price movement. Always conduct independent research and apply appropriate risk management to any positions.

Amazon+Rivian= MoneyTrend is starting to change.
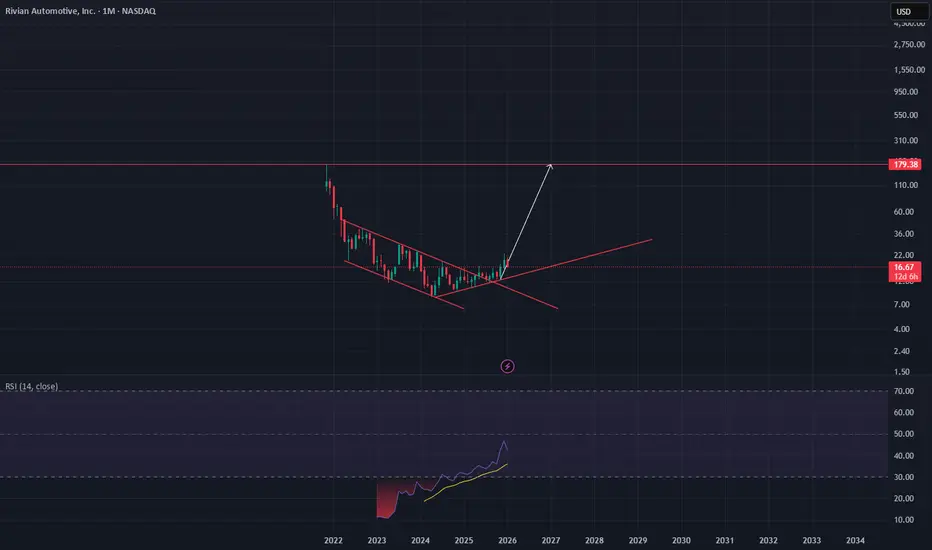
This looks like a regular starting of a bull market for a small market cap. It will always end up like a cup and handle and go into to a long bull market trend.
Insider information, I work for amazon deliveries and Rivian vans work well, but they are going to need to keep replacing them for how much we use them. Rivian will keep getting demand from the constant abuse we drivers put on their vehicles.
I also see a lot of older folks driving Rivian trucks, and now with tesla having self-driving on subscription for vehicles this creates a more diverse decision making for consumers.
Price target is above highs.
RivianNASDAQ:RIVN
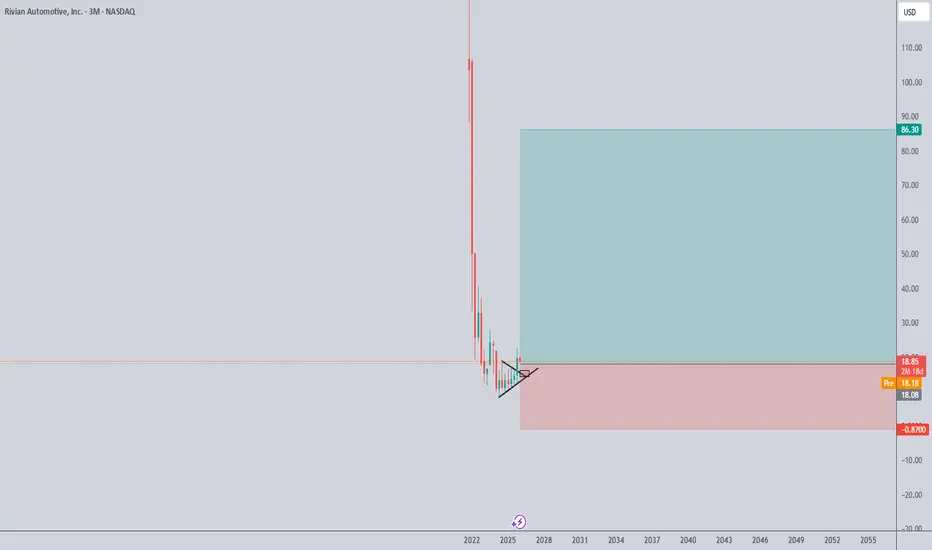
Lost the weekly bull flag.
Now watching the 0.236 Fib.
If 0.236 holds and flips into support, the structure stays bullish. Strong trend. Buying support makes sense.
Not scared.
Bullish while 0.236 holds.

Rivian Software & Services: This is the most interesting part for you. Their software growth is 324%! Thanks to the partnership with Volkswagen, Rivian is starting to sell its technology to others, which brings a much higher margin than the metal itself.
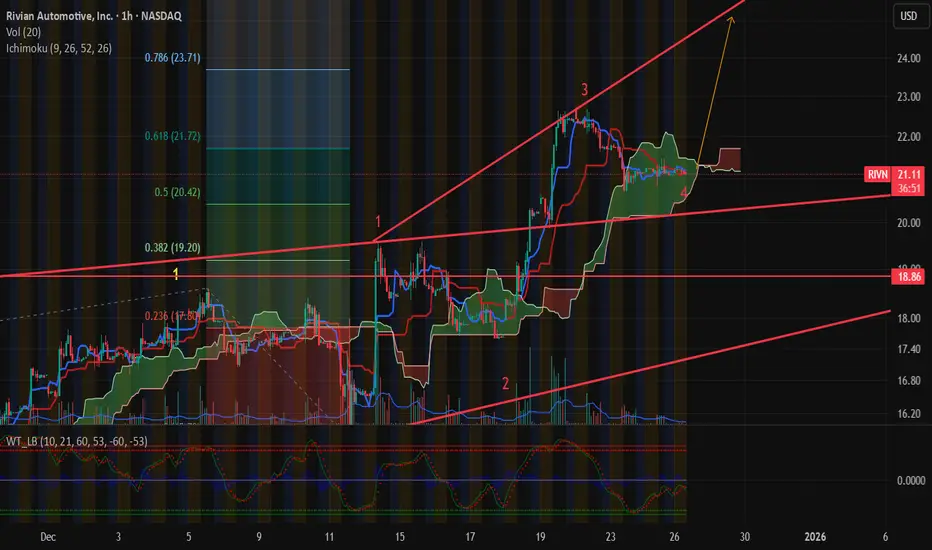
RIVN Crossroads: Can We Reclaim $20.61 for a Run to $27... and beyond for the rest of 2026?
while the recent suspension recall and CEO share sale have pushed the price down about 9%, the volume indicators tell a much different story than the headlines.
The Thesis: Despite the pullback the past 3 days, we are seeing a significant Bullish Divergence on the OBV and A/D lines. While retail is panic-selling the recall news, the 'Smart Money' indicators (CMF and Cumulative Volume Delta) are actually rising or holding steady.
This suggests the dip is being absorbed by institutional buyers.
Key Levels to Watch:
Support: If we hold the $19.50 zone through this week, the 'shakeout' is likely over.
Resistance: $20.61 is the immediate pivot. A break above this validates a move toward the $27 supply zone.
Catalyst: All eyes are on the February 12th earnings for R2 platform updates.
Don't forget the strategic partnership with #AMZN which is a major shareholder.

RivianNASDAQ:RIVN
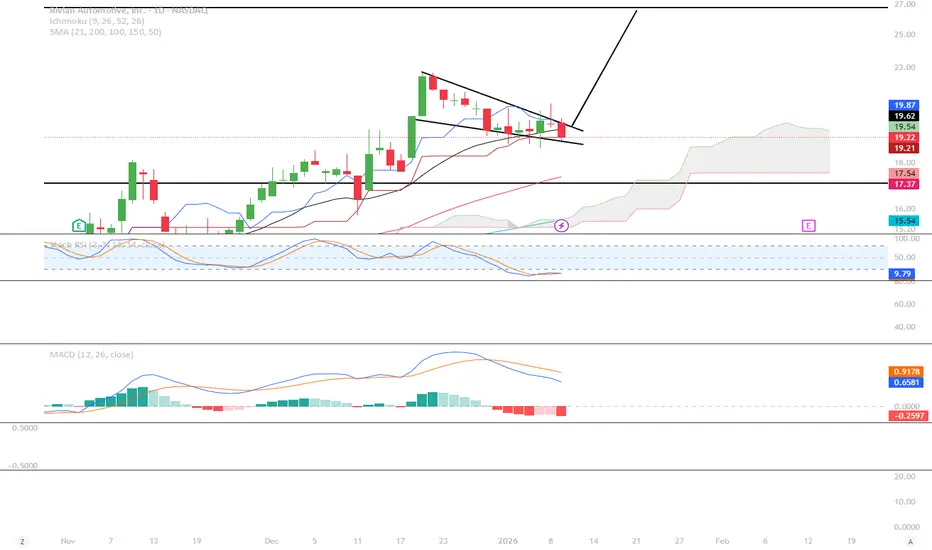
The daily Tf held the Kijun perfectly. Can this bullflag break out next week?! Next ressistance zone at around 26.77 which is the .382 Fib level.
RIVNRivian ( NASDAQ:RIVN ): Strategic Risks
1. Delivery & Sales Performance
Annual Decline: Rivian delivered 42,247 vehicles in 2025, an 18% decrease compared to 51,579 units in 2024.
Q4 Underperformance: Deliveries fell 31% YoY (9,745 units), missing the consensus expectation of 10,100 units.
Guidance: The company narrowed its annual forecast to 41.5k–43.5k units. Currently, growth is limited by market demand rather than production capacity.
2. Market Challenges & Competition
Tax Credit Expiration: The end of the $7,500 federal EV tax credit is negatively impacting sales.
Intense Competition: In 2026, the R2 platform enters a saturated market against the updated Tesla Model Y, Hyundai Ioniq 5, Kia EV6, and Chevrolet Equinox EV.
Pricing Wars: Ford (F-150 Lightning) and GM (Silverado EV) are using their scale to aggressively cut prices.
Global Expansion: Chinese manufacturers (BYD, Zeekr) are expanding into Western markets; Rivian lacks the margins to compete in a price war.
3. Technology & R2 Platform Roadmap
🔎
RIVIANNASDAQ:RIVN
The weekly can test the 200 MA (yellow line), but a flip requires a weekly close above it. Might need some time so the 21 MA (white line) can catch up with price.
The sell order block (red box) must be broken with momentum and volume expansion. Otherwise, expect rejection.
26.77 is a continuation target, valid only after acceptance above the 200 MA and invalidation of the sell block.

Rivn round two longRIVN has pulled back to the golden pocket and looks ready to resume towards 25$ soon. I missed the first leg since I’m not a major fan of the company, but I would trade this. I’ve learned to really just wait for my levels and set alarms. I will enter this if we get a consolidation candle.

RIVN- UpdateRIVN- Update
.
Plan has run and pull pack as expected.
New buying pull back entry.
US STOCKS- WALL STREET DREAM- LET'S THE MARKET SPEAK!

rivn is setting up for a major run!i normally do trend and support analysis ,but when i seen this i was wondering that ,this looks like a classic Wyckoff accumulation,and we are right at the end waiting for lift off...couldn't believe it myself but this looks exactly like aapl in apl 2009 between oct to april. also the volume is not consistent with price.. if im right this stock is primed and ready for lift off now!

Rivian Automotive: Navigating High Hopes and Market RealitiesShares of Rivian Automotive (NASDAQ: RIVN) have been on a remarkable trajectory, more than doubling in value over the past eight months and currently trading near a two-year high of approximately $22.64. This surge reflects growing investor optimism about the company's path to operational maturity and its strategic positioning within the competitive electric vehicle (EV) landscape. However, as the stock approaches these elevated levels, a nuanced debate emerges between bullish catalysts and significant valuation concerns. This analysis delves into the key drivers behind the rally, the divergent views from Wall Street, and the critical factors that will determine Rivian's performance in 2026 and beyond.
The Bullish Thesis: Strategic Catalysts and Operational Momentum
The optimistic narrative for Rivian is championed by analysts like Dan Ives of Wedbush Securities, who recently maintained his "Outperform" rating and raised his price target to $25. This suggests a further potential upside of about 11% from current levels. Ives's constructive outlook is anchored in several pivotal developments:
The Accelerated Push into Autonomy and AI: A primary catalyst is Rivian's recently unveiled strategy at its inaugural "Autonomy & AI Day." The company announced ambitious plans, including the launch of its proprietary Rivian Autonomy Processor (RAP1) and a forthcoming autonomy subscription service in 2026. According to Ives, this accelerated focus on self-driving technology is not merely a feature enhancement but a strategic move that could unlock new, high-margin revenue streams (via software subscriptions) while simultaneously improving vehicle efficiency and helping to manage long-term manufacturing costs through technological integration.
The Crucial R2 Platform Rollout: The successful launch and ramp-up of the R2 vehicle platform are seen as central to Rivian's growth story in 2026. The R2, targeting a more accessible price point than the flagship R1T and R1S models, is expected to significantly expand Rivian's addressable market. A smooth production and delivery ramp for the R2 is critical for improving volume metrics, achieving economies of scale, and demonstrating the company's ability to execute on its growth roadmap.
The Volkswagen Joint Venture as a Game-Changer: Rivian's multibillion-dollar strategic joint venture with Volkswagen is widely viewed as a transformative partnership. For Rivian, it provides a massive infusion of capital, validates its next-generation electrical architecture and software stack, and offers a pathway to global scale through access to Volkswagen's manufacturing expertise and supply chain. This alliance substantially de-risks Rivian's balance sheet and long-term capital needs, strengthening its competitive moat against both legacy automakers and pure-play EV rivals.
Attractive Relative Valuation and Technical Strength: Despite the sharp rally, proponents argue Rivian remains attractively valued on a relative basis. At approximately 5x forward sales, it trades at a significant discount to Tesla's multiple of over 16x, suggesting room for expansion if execution improves. Technically, the stock is trading decisively above all its major moving averages (50-day, 100-day, 200-day), a pattern that typically signals sustained bullish momentum and indicates buyers are in control across multiple timeframes.
The Cautious Counterpoint: Consensus Skepticism and Lofty Expectations
Despite these compelling drivers, a significant degree of skepticism persists on Wall Street, presenting a stark contrast to the bullish outlook. The broader analyst consensus, as aggregated by services like Barchart, currently sits at a "Hold" rating, with a mean price target of approximately $16. This implies a potential downside of roughly 28% from current levels, highlighting a deep-seated concern that the recent rally may have overshot the company's near-term fundamentals.
The primary concerns underpinning this cautious stance include:
Execution Risk: The automotive industry is notoriously difficult, and Rivian must flawlessly execute the R2 launch, ramp up new production lines, and integrate complex autonomy technology—all while managing cash burn.
Intensifying Competition: The EV market is becoming increasingly crowded, with price wars and rapid innovation from both established giants and new entrants putting pressure on margins and market share.
Macroeconomic and Demand Headwinds: Higher interest rates and potential consumer softening could impact demand for big-ticket items like vehicles, testing Rivian's pricing power and delivery targets.
Valuation Stretch: At current prices, skeptics argue the stock is pricing in a near-perfect execution of its multi-year plan, leaving little room for operational missteps or market disruptions.
Technical Framework and Seasonal Considerations
From a chart analysis perspective, key levels are coming into focus:
Major Support Zone: A critical area of historical buying interest and structural support is identified around the $8.00 level.
Major Resistance Zone: The next significant hurdle and potential profit-taking zone for the current uptrend lies near $28.00.
Additionally, some traders note a seasonal tailwind, with historical data indicating Rivian shares have averaged a gain of over 6% in the month of January. While past performance is no guarantee, this pattern can influence short-term trading sentiment.
Conclusion: A High-Stakes Inflection Point
In summary, Rivian Automotive stands at a high-stakes inflection point as it heads into 2026. The bullish case, led by analysts like Dan Ives, is powerful and forward-looking, built on strategic differentiators in autonomy, a pivotal new vehicle platform, and a landmark partnership that provides financial stability. The stock's technical posture and relative valuation add to this appeal.
However, the substantial gap between the bullish price targets and the conservative consensus "Hold" rating underscores the exceptional execution required to justify current valuations. The market is effectively asking: Can Rivian transition from a promising story to a sustainably profitable, high-volume automaker before the capital runs thin or competition intensifies further?
For investors, the decision hinges on conviction in management's ability to navigate this complex transition. The upcoming year will be critical, with milestones around the R2 launch, autonomy developments, and joint venture progress serving as key catalysts that will either validate the bullish thesis or reinforce the skeptics' caution. The path forward promises significant volatility, with the stock likely oscillating between the forces of high-growth optimism and the gravity of automotive industry realities.

Analysis of RIVNSPRS takes time to develop, but the ability to READ a stock chart and all the dynamics of each individual stock chart as quickly and easily as you read a book is important for consistently successful trading. Charts are the LANGUAGE of trading transactions and you must develop this skill to have a high income trading stocks.
Professional traders swing trade. The will nudge price or create setups that triggers HFT AI with their huge quantities of orders flooding the queues before the market opens.
When reading a stock chart, use several time frames for the most accurate and reliable method of understanding what has occurred in the past that may impact the current price action.
Do not use percentage stop losses because Floor traders will take you out.
All retail-side orders are required by SEC rules and regulations to be "LIT" before being executed by the Payment for Order Flow Market Makers to whom your broker sends most, if not all, of their retail orders.
The professionals of the market can see everything you do. You can ONLY see their activity via the stock charts. You need to learn how to read a stock chart accurately and quickly.
Avoid using "recommended stocks" as these are also identified by HFT AI and you will be front ran all the time.
Professionals trade on the millisecond. That's 60,000 transactions per SECOND.
You trade on the 1 minute scale. Even though it seems like your order is filled quickly, it actually is filled VERY SLOWLY in relation to the professionals' millisecond execution time.
Use indicators that reveal Dark Pool Activity so that you can create a watchlist of stocks and identify early the professional traders' footprints that will create a sudden momentum run.

RIVIAN - DAY TRADE SET-UPGood Morning,
Hope all is well. Please see Rivian day trade idea. Entry levels, stops and take profits.
Trade Safely
EnjoY!


$RIVN Triangle Breakout Triangle structure resolved to the upside with strong follow-through.
Price now approaching the $22 resistance zone.
Key question:
Acceptance above $22 or rejection and consolidation below?
No prediction — just mapping levels and reactions.

RIVIANRIVN just printed its highest weekly close in nearly two years. Price was rejected at the 200-MA and the $19 resistance zone. Overall structure still favors continuation, but some consolidation is likely first. Key level to watch is the 0.886 retracement—if that holds, the 23.6$ area becomes the next upside target.

RIVIAN leaving downtrend. Going horizontal or up next?RIVN has some pretty interesting cards right now. The upcoming launch of the R2 is supposed to be a game changer for the company. But only time will tell if this is really the case.
For now at least one could say that the downtrend since it's (overpriced) IPO seems to be done. So next question would be: Are we going into an accumulation for xx months/year or will we start trending up already?
To be honest, I think it's 50/50 here. Nevertheless, accumulating here doesn't seem like a bad decision. As long as we stay above the yearly open, which we are currently retesting, I don't see any issues here.
Let's see how PA unfolds going forward.

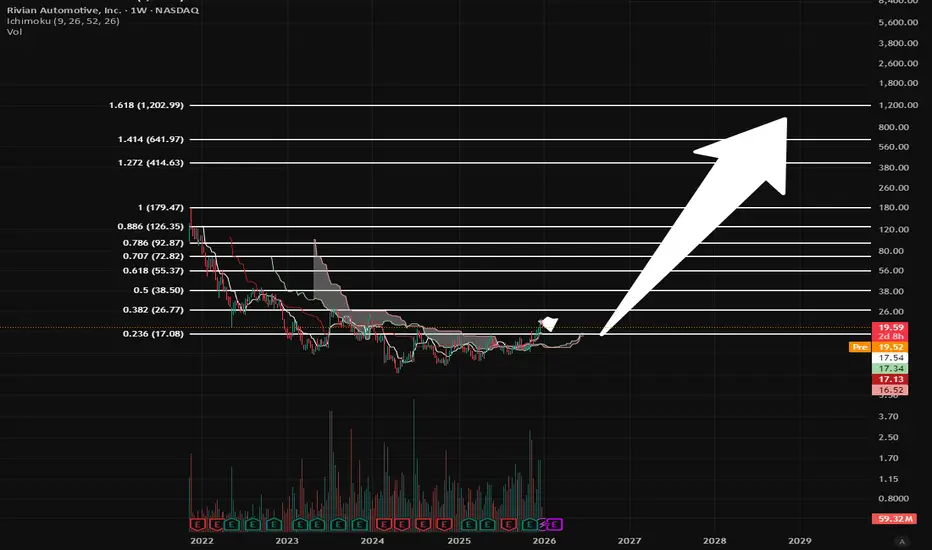
$RIVN $48+ Target in SightNASDAQ:RIVN breakout and backtest has us targeting $48+ at our next Fibonacci level. A trip from here to previous all time highs would be an 888% move to $180+. Just like NASDAQ:TSLA , NASDAQ:RIVN gets all the negative market price action that auto manufacturers face, but they gain the upside that tech stocks see.
