SCSC Earnings Gamble: $45C--Pre-Earnings Lotto Play?
# 🚨 SCSC Earnings Gamble: \$45C 🎯 Pre-Earnings Lotto Play? 📈💰
### 📊 Earnings Prediction Breakdown (2025-08-20)
**Company:** ScanSource, Inc. (SCSC)
#### 🔎 Fundamentals
* 📉 Revenue growth: **-6.3%** (big challenge)
* 💸 Margins: Thin (Profit 2.3%, Operating 3.3%, Gross 13.5%)
* ⚠️ Beat rate: Only **38%** with negative surprise history (-6.1%)
* 🧾 Forward EPS est.: \$3.74 (+34.5% growth expected — may be too optimistic)
**👉 Score:** 5/10 (Weak fundamentals, a few bullish sparks)
---
#### 🏦 Options Flow
* ⚡️ IV: Normal, no big expansion
* 📉 Liquidity: Low (79 calls vs 3 puts OI 😬)
* 🛡️ Skew: Slightly bearish (more puts for hedging)
* 🐢 No dark pool or big whale activity
**👉 Score:** 4/10 (Retail-heavy, no big-money conviction)
---
#### 📈 Technicals
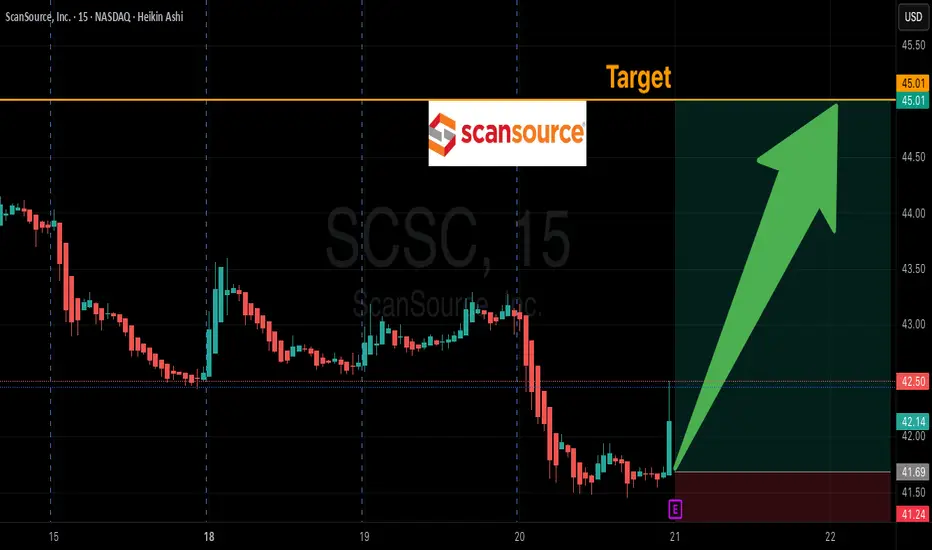
* 💵 Price: \$43.06 (hovering above MA)
* 📊 RSI: Neutral → leaning overbought
* 🔑 Levels: Support \$41.36, Resistance \$45.00
* 📉 Volume: Weak (0.72x avg)
**👉 Score:** 5/10 (Neutral momentum, low volume support)
---
#### 🌎 Macro Context
* 🚚 Supply chain headwinds remain
* 📦 Tech distribution sector under pressure
* 📉 Micro-cap vulnerability → tough environment
**👉 Score:** 5/10 (Neutral sector, not much tailwind)
---
### 🎯 Directional Conviction: **53% Neutral / Speculative Bias**
---
## ⚡️ TRADE IDEA (Speculative Only) ⚡️
🎯 **\$45 Call @ \$1.25 (Sept 19 expiry)**
* 🛑 Stop Loss: \$0.62 (50%)
* 🎯 Target: \$2.50–\$5.00 (200–400% lotto)
* 📆 Entry: Pre-earnings close
* ⏰ Exit: Within 2 hrs post-earnings
---
📊 **Quick Recap Card:**
* 🎯 Instrument: **SCSC**
* 🔀 Direction: **CALL (LONG)**
* 🎯 Strike: **45.00**
* 💵 Entry: **1.25**
* 🛑 Stop: **0.62**
* 📅 Expiry: **2025-09-19**
* 📈 Confidence: **53%**
* ⚠️ Risk: Low liquidity, speculative lotto
SCSC trade ideas
ScanSource, Inc.
The price has recently bounced from the lower Bollinger Band and is heading towards the middle band (likely the 20-period simple moving average).
When price bounces from the lower band, it can signal a potential recovery or a short-term rally.
There is a noticeable gap up followed by consolidation near the upper band in the past.
The stock has recently been in a correction phase, pulling back from highs near $53 down to around $45, where it's now bouncing.
Based on the Bollinger Bands' behavior, the chart could be showing signs of consolidation after a downtrend.
If price moves above the middle Bollinger Band and sustains it, it could suggest a potential continuation of an uptrend.
Bullish Case: If the price breaks and holds above the middle band (around $48), it could attempt to test the upper band (~$52).
Bearish Case: Failure to break and sustain above the middle band may lead the price to retest the lower Bollinger Band (~$44), especially if broader market conditions remain weak.

$SCSC VCP Breakout Setup$SCSC putting in a nice VCP breakout setup with a base shake out (red circle).
This might just go tomorrow but will set up ideally if it can put in couple more days below that supply line (orange bars)

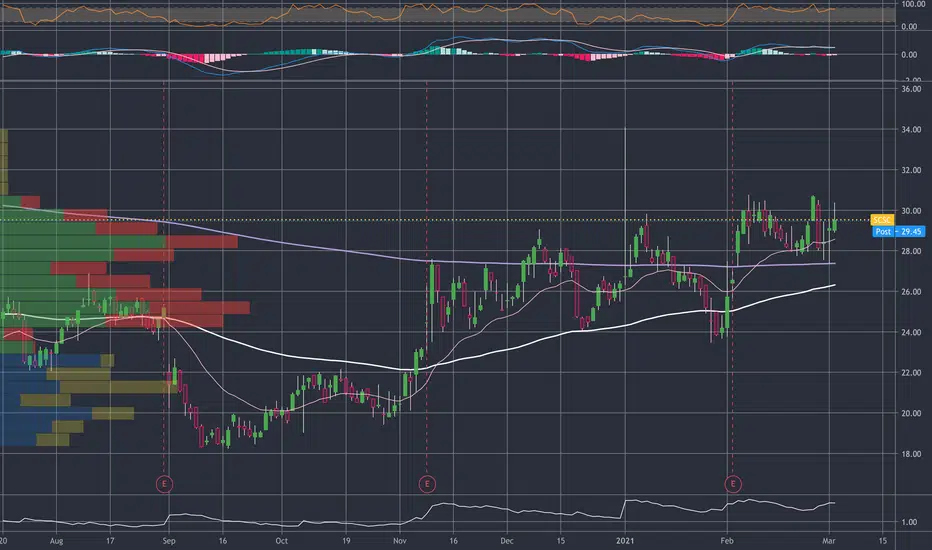
$SCSC - golden crossI love playing the golden cross for a simple reason. It works.
Was told to pick it up 3/1 and did not listen. Looking for my long entry now

$SCSC - golden crossTrying to get better at scanning and came across this lovely
Golden cross on the horizon, putting a limit order in for commons at the 20 EMA
Hold and gain.

SCSC: A rising Triangle 14 year in the making. Which way will itA gradual rising stock price for 14 years was accompanied by a 14 year decline in MACD.
