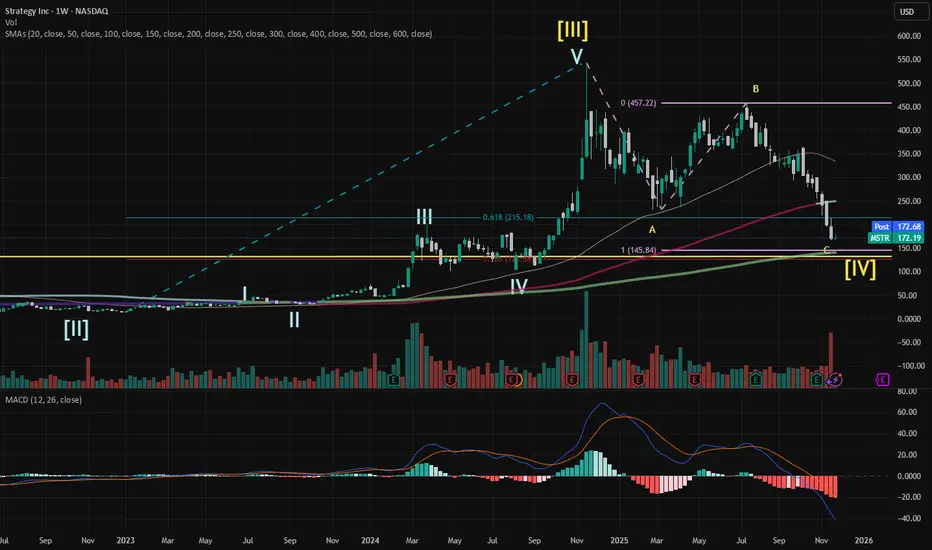
$MSTR: AB = CD is around $145NASDAQ:MSTR completed Wave in Nov 2024 and has been in Wave correction since. Elliott Wave theory states that often the correction will enter the zone of Wave 4 of one lesser degree, i.e., Wave III-Wave IV area of Wave . This corresponds to $200 in March 2024 and $102 in August 2024 (a 50% drop for Wave IV!).
Presently, MSTR at $172 already entered the top of that zone., AB = CD for the flat correction gives $145, which is right in the middle of this zone. $145 also is just above the 78.6% retracement.
This count is invalidated if MSTR drops below Wave top achieved in Feb 2021 at $131.50.
I don't believe MSTR will drop below $131.50 but hitting AB = CD at $145.84 is likely, which would probably correspond to CRYPTOCAP:BTC = $78K.
I don't own MSTR and don't plan to trade this name. If CRYPTOCAP:BTC drops to $78K, I plan to add to my position.
Trade ideas
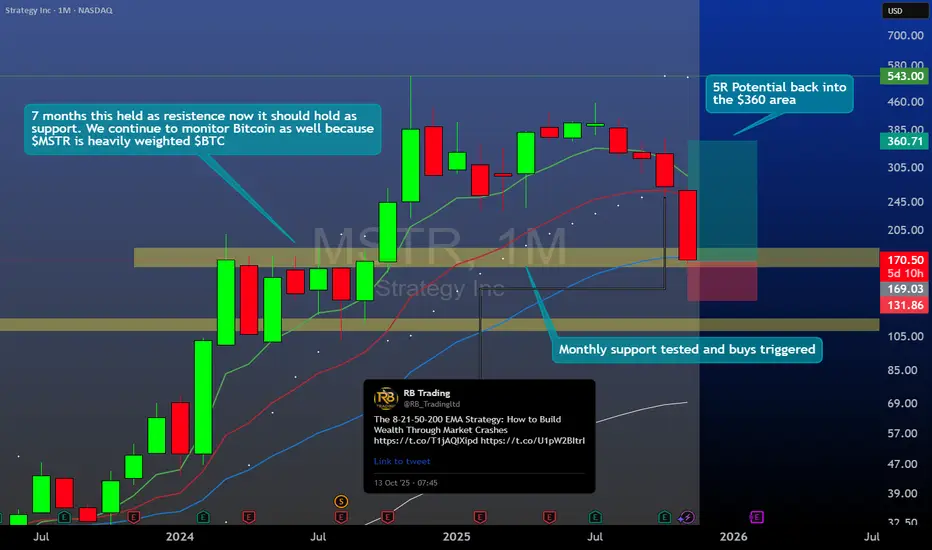
$MSTR Pullback Into Monthly Demand🟠 NASDAQ:MSTR Pullback Into Monthly Demand
✓ Price has rotated cleanly back into a major demand zone
✓ Structure still supports higher time-frame strength
✓ Buyers have stepped in here before with conviction
A strong area to watch as momentum rebuilds.
We have already started adding via out tier system.
$MSTR: Monthly down trend...GM lads, looks like we have a fully confirmed monthly down trend in $MSTR...this likely is bad news for all of crypto.
Stay safe out there...
Cheers,
Ivan Labrie.

DECODED ANALYSIS STRATEGY (MSTR)MSTR is currently in the second phase of its second quarterly grand cycle, with a long way to complete this cycle.
Currently near upper support at $164.75,
⭐Pattern support is noted at $141, and if this pattern support breaks, than next
support noted at $108.2.
Multiple skip supports are noted at $29.1 and lowest at $11.78,
After correcting, a huge pump will occur,
Resistance for 2026, 2027 are noted at $536.63, $573.76, $803.76, $1006.72, $1075.18,
Resistance for 2030 are noted at $1742.28, $2006.81, $2134.95, $2379.51,
Resistance for 2034, 2035 are noted at $6046.67, $6979.31,
Important note, all my analysis is based strictly on actual factual supports and resistance with no predictions,
This message is for educational purposes only.
Always DYOR.
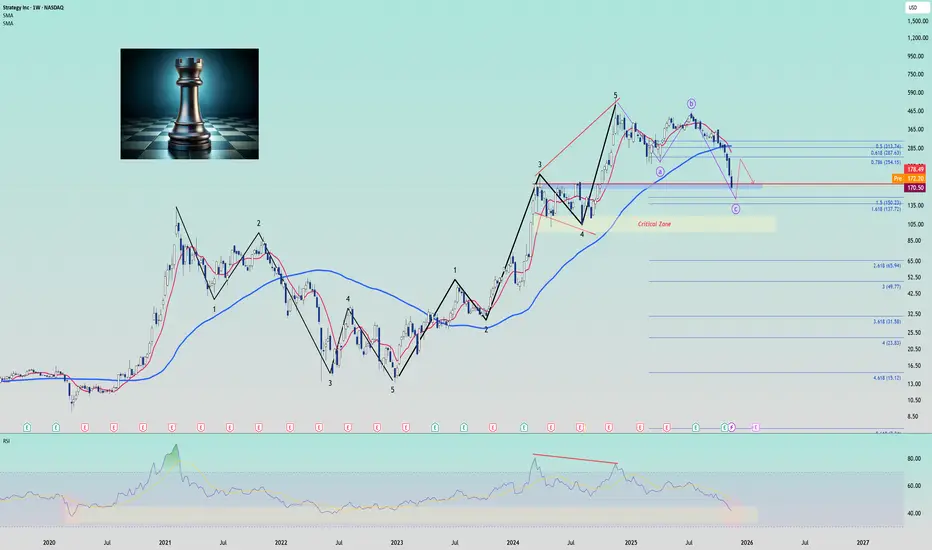
MSTR Chess Game: When Smart Money Plays Against Saylor!
Did you play chess before?
For me, i started playing it in the past 3 days, and even though i reached a nice speed rank, the performance and game review still show the blind movement! And this is EXACTLY what Saylor is doing! Let me show you the data:
He bought $1.5B at $52K (March), then added $3B at $60K+ (November) - always buying the momentum, not the value! Now MSTR down -50% from $360 while BTC only -10%... You see the pattern?!
Weeks ago (Oct 1, around $360) i told my friend, "If I play with 1-2, I will say this guy is ass*** and i will try to cost him a loss, and i will play the game to make him buy my sells then rekt him and buy his loss."
Just a few weeks and here we are! MSTR losing -50% and BTC run to his buy AVG $74K, yes, he is still in a safe zone, but the real game starts now!
The Technical Setup (this is where it gets interesting!):
So i use multiple methods - GANN 50% retracement hitting at $145, Fibonacci Golden Pocket at $152-163, and Volume Profile showing the highest trades at $147. Even RSI at 28 is showing divergence while price is making new lows!
Here's my trade plan:
Entry Zone: $145-155 (I'm scaling in here!)
Target 1: $183 (taking 25% off)
Target 2: $190 (another 50% off)
Stop Loss: $139 (below monthly support)
Risk/Reward: 1:2.8 (this is a beautiful setup!)
But wait, there's more data!
The correlation is crazy:
MSTR/BTC: 0.84 correlation
BTC/NDQ: 0.72 (and rising!)
If MSTR breaks $140, we could see BTC at $83-79K and NDQ dropping 5-8%!
Will Saylor survive? Here's the math:
BTC needs to hit $29K for margin calls - that's NOT happening!
He has $3.2B in unencumbered BTC
Bonds not due until 2027-2029
His software business still makes $50M quarterly.
So he plays it nicely, and the team behind still has more to do! Strategic Bitcoin Reserve talks, Gensler leaving, Q1 2025 crypto regulations - they're doing their best to make everything hold!
The sentiment data (this is golden!):
Fear & Greed: 25 (Extreme Fear)
Put/Call ratio: 2.3 (highest since 2022!)
Social volume: -78% last 7 days
You know what this means?! Smart money accumulating while retail panicking!
My analysis using:
GANN boxes on log scale (this is KEY!)
Custom MA ribbons with volume weighting
Multi-timeframe RSI divergence
Fibonacci zones from multiple swings
So what's the play?!
If you're conservative:
Wait for the weekly close above $180
Scale by 25% at a time
Use BTC/GOLD as a hedge
If you're aggressive like me:
Accumulate $145-155 NOW +2% invest
Sell $190+225 calls for income
Consider the BTC/MSTR pair trade
Next 30 days watch:
Monthly close Dec 31 (CRITICAL!)
Q4 BTC purchases announcement
Fed meeting Jan 29
MSTR earnings Feb 3
Anyway!
Would MSTR be saved now and rebound?! YES!
Professional accumulation is happening at these levels - the risk/reward is too good!
they do their best to make everything hold, the system is upgraded, the thinking scale has become faster than your mind now!
So, we're all here to make profits, and i wish i could short MSTR at $360, but now I'm buying!
if you like what you read and what you see, please press the like button, and your comments are welcome
Thanks, tradingview, for giving me a space here!
we ask Allah to reconcile and repay
#MSTR #Bitcoin #CryptoTrading #Saylor
MSTR Downside Setup: Oversold Momentum + Extreme PCR Warns of Dr
Ticker: MSTR
Current Price: $173.42 (near weekly high)
Signal Type: Weekly (V3)
Direction: PUT (Short)
Confidence: 65%
Conviction: Medium
Weekly Momentum: BEARISH (-3.75% 1W)
Options Flow / PCR: Extremely bearish | PCR 7.23
Risk Level: Moderate
🎯 Trade Setup
Strike: $155 PUT
Expiry: 2025-11-28 (3 days)
Entry Range: $1.19 – $1.29
Target 1: $2.50 (110% gain)
Target 2: $3.20 (170% gain)
Stop Loss: $0.85 (30% risk)
Position Size: 2.5% of portfolio
🧠 Key Insights
Katy AI shows initial bearish pressure but ultimate bullish target at $173.42 — conflicting signals
Technicals: Oversold RSI at 14.5, trading near weekly low, support at $165.60, resistance $173–175
Options Flow: Heavy institutional put buying; unusual activity suggests strong short-term bearish conviction
News Sentiment: Mixed crypto outlook; recent Bitcoin/Ethereum moves provide some indirect support for MSTR
⚠️ Notes
Moderate risk due to Katy conflict — short-term bearish momentum dominates over delayed bullish AI target
Tight stops recommended; monitor recovery toward $173+ for potential reversal


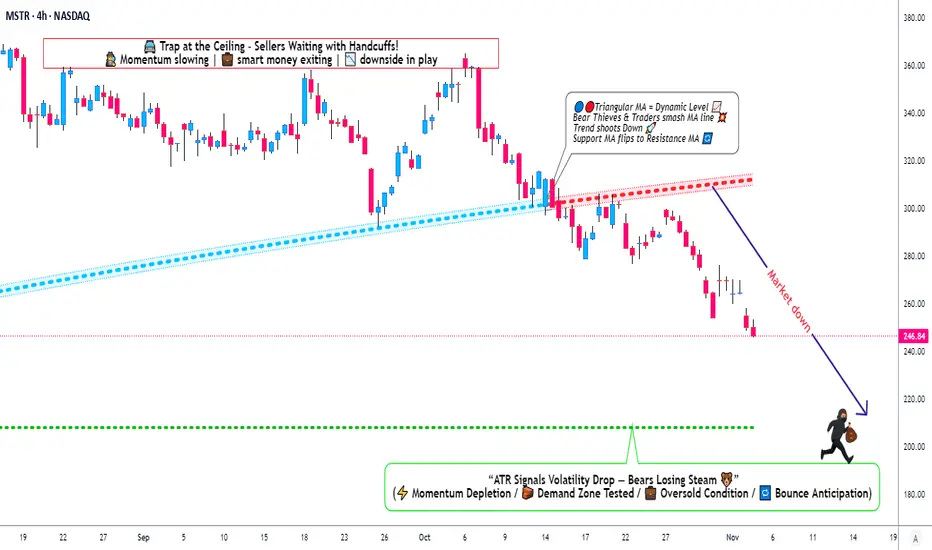
MicroStrategy Under Pressure: Bearish Playbook in Action🎯 MSTR: The "Thief's Playbook" - Strategic Bear Trap Setup! 💰🔥
📊 Asset Overview
MicroStrategy Inc. (MSTR) - Bitcoin's Proxy Play in the Stock Market
🎭 The Setup: When Bears Come to Party
Alright folks, gather 'round! We've got ourselves a textbook triangular moving average breakdown on MSTR that's screaming "short opportunity" louder than my portfolio after a bad trade week! 😅
Current Market Sentiment: 🐻 BEARISH CONFIRMED
The technicals are aligning like planets before a lunar eclipse - and trust me, this eclipse might cast some shadows on those long positions!
🎯 The "Thief Strategy" Game Plan
🚪 Entry Zones - The Layering Approach
Here's where it gets spicy! 🌶️ Instead of going all-in like a degen at a casino, we're using the "Thief Layering Method" - multiple limit sell orders to scale into this position:
Suggested Entry Layers:
🥇 Layer 1: $300
🥈 Layer 2: $290
🥉 Layer 3: $280
💎 Layer 4: $270
🔥 Layer 5: $260
Pro Tip: You can add MORE layers based on your risk appetite and account size. More layers = Better average entry = Smoother sleep at night! 😴
🛡️ Risk Management - The "Oh Sh*t" Line
Stop Loss: 🚨 $320
⚠️ IMPORTANT NOTICE: Dear Thief OGs, Ladies & Gentlemen! This SL is MY line in the sand. YOU need to decide YOUR own risk tolerance. Trade at your own risk, manage your own money, and don't blame me if things go sideways! This ain't financial advice - it's entertainment with charts! 🎪
🎁 Target Zone - Where We Cash Out
Take Profit Target: 🎯 $210
Why $210?
💪 Strong historical support level
📉 Oversold territory expected
Classic bull trap zone where longs get liquidated
⚠️ ANOTHER IMPORTANT NOTICE: Thief OGs! This is MY target. You do YOU! If you see profits earlier and want to secure the bag - DO IT! Don't be greedy. Take profits when YOU feel comfortable. Your account, your rules, your responsibility! 💼
🔗 Related Assets to Watch - The Correlation Game
Keep your eyes on these bad boys for confirmation:
📈 Direct Correlations:
NASDAQ:MARA (Marathon Digital) - Bitcoin miner, moves with crypto sentiment
NASDAQ:RIOT (Riot Platforms) - Another BTC miner, similar volatility pattern
NASDAQ:COIN (Coinbase) - Crypto exchange, sentiment indicator
CRYPTOCAP:BTC (Bitcoin spot) - The godfather! MSTR holds massive BTC, direct correlation
🧠 Key Points:
MSTR trades with ~1.5x-2x Bitcoin beta (more volatile than BTC itself)
When Bitcoin dumps, MSTR often dumps HARDER 📉
Watch BTC support at $60K - if it breaks, MSTR likely follows to our target zone
Tech sector weakness ( NASDAQ:QQQ , AMEX:SPY ) adds bearish pressure
⚡ Trading Psychology - The "Thief Mindset"
Look, this setup requires PATIENCE! 🧘♂️ Don't FOMO in at market price. Layer in like a professional thief planning a heist - calculated, methodical, strategic! This isn't gambling; it's probability management with a side of humor! 😎
🎪 Final Word from Your Friendly Neighborhood Chart Thief
Remember: Markets are wild, unpredictable, and don't care about your feelings OR your bills! This analysis is for educational and entertainment purposes ONLY. The "Thief Strategy" is MY trading style - it's risky, it's aggressive, and it's definitely NOT for everyone!
Do your own research. Manage your own risk. Trade what you can afford to lose. And for the love of all that's holy, don't mortgage your house based on some random internet chart analysis! 🏠❌
✨ If you find value in my analysis, a 👍 and 🚀 boost is much appreciated — it helps me share more setups with the community!
🏷️ #MSTR #MicroStrategy #ShortSetup #BearishBreakdown #SwingTrade #DayTrade #ThiefStrategy #BitcoinStocks #TechnicalAnalysis #MovingAverageCrossover #LayeringStrategy #RiskManagement #StockMarket #TradingIdeas #BTC #CryptoStocks #BearTrap #SupportAndResistance #ChartAnalysis #TradeSmart
🎯 Trade smart, layer in, manage risk, and may the profits be ever in your favor! 💰🚀
Where It Started — Retail Never Heard the MSCI Whispers⚡️ Where It Started — The Perpetual Offering Nobody Took Seriously (MSCI Was Only Whispers Back Then)
🌐 Referenced Tweet (Announcement of the Perpetual Preferred Offering):
x.com
⸻
⚡️ The Moment No One Realized Was the Start
When this perpetual preferred offering was announced, retail shrugged it off.
But this tweet was the first real signal that something bigger was shifting beneath the surface.
At that moment:
• The MSCI exclusion risk was only industry whispers
• Retail had zero clue
• Macro liquidity was tightening
• Crypto-heavy balance sheets were getting risky
• Companies were quietly positioning early
This offering wasn’t loud.
It wasn’t marketed as defensive.
But it was — and now the charts expose exactly what they were preparing for.
⸻
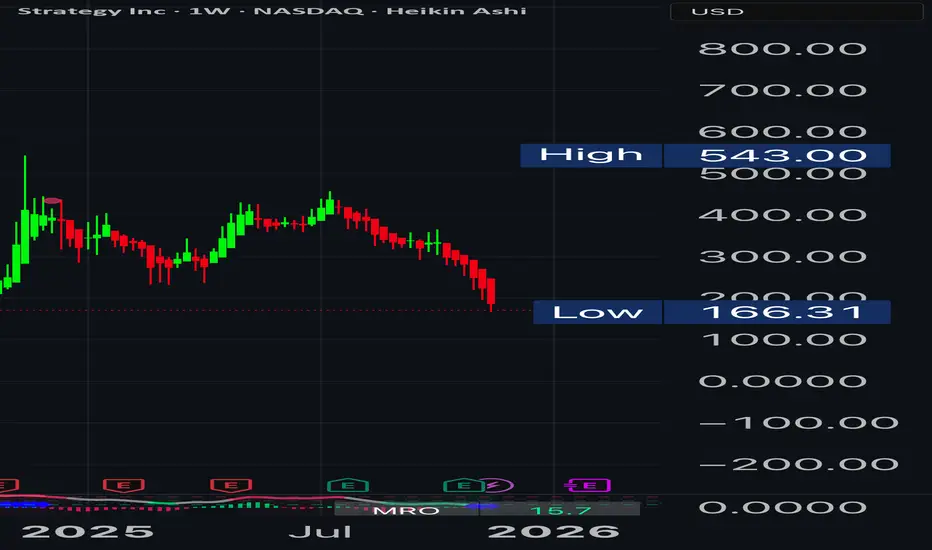
📉 MSTR Weekly (June ’25 → Now)
• Peak near $543
• Now near $374
• Low of $166
• Multi-month distribution
• Slow, steady derisking — NOT a panic crash
This is exactly what happens when institutional flows dry up slowly after classification risk rises.
Retail didn’t see it.
The chart did.
⸻
📉 BTC Weekly (June ’25 → Now)
• High: $126K
• Current: $104K
• Low: $74.5K
• Lost upward trendline
• Not a blow-off — a slow liquidity fade
Again, the signature of structural deweighting.
Not fear.
Not news.
Flows.
⸻
⚡️ The Link to MSCI
When this perpetual offering was issued:
• MSCI exclusion wasn’t public
• Analysts were only hinting
• No press releases
• No retail coverage
• No major alerts
But companies close to the fire knew classification rules were shifting.
So they raised capital early.
Retail had no idea.
They wouldn’t know for months.
⸻
⚡️ The Takeaway
This tweet marks the starting point of a long structural shift that retail didn’t understand until it was already deep in motion.
The perpetual offering was the tell.
The MSCI rules were the trigger.
MSTR and BTC’s breakdown was the confirmation.
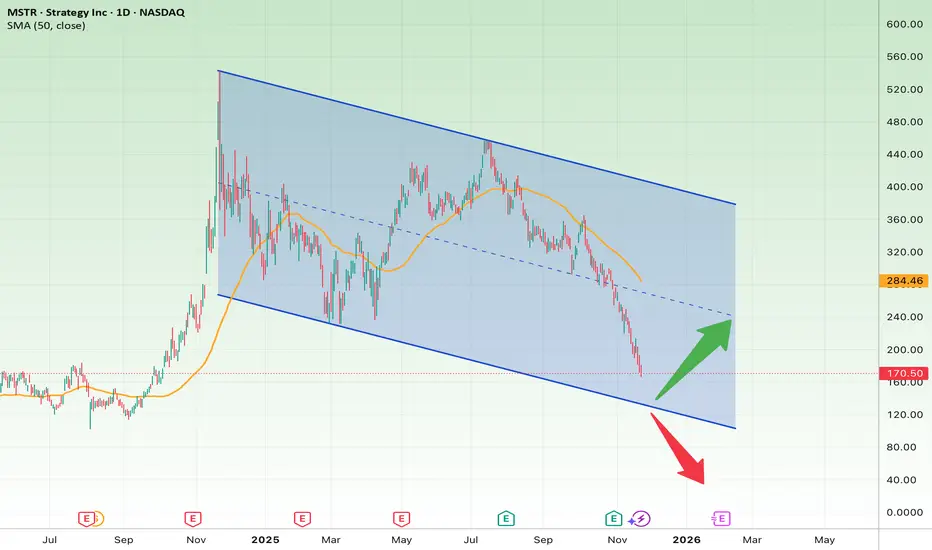
MSTR at a Breaking Point: Reversal Rally or a Deep Breakdown?The chart shows MSTR trading inside a large descending channel, with price now approaching the bottom boundary of the channel — a zone where strong reactions usually occur. The recent sell-off has been steep, indicating the stock is potentially oversold at current levels.
1. Key Support (Bottom of Channel)
• Major support: $150 – $160
This is the lower boundary of the descending channel and the most important level on the chart.
2. Bullish Scenario (Green Path)
If MSTR finds support at the bottom of the channel:
• Price may bounce toward the midline of the channel around $230 – $240.
• If momentum continues, the next key resistance is near the 50-day SMA and upper channel resistance at $280 – $300.
3. Bearish Scenario (Red Path)
If price breaks below the channel:
• A sharp decline toward $100 – $120 becomes likely.
• This is the next major support zone below the channel.
Bullish Targets
• TP1: $230
• TP2: $280
• TP3 (extended target): $320
Bearish Target
• TP (Downside): $120
Stop-Loss
• A daily candle closing below $150
This would confirm a breakdown from the channel and invalidate the bullish setup.
MSTR Monthly & Quarterly Waterfall Crash In MotionI'm adding MSTR (MSTU 2x, MSTZ -2x ETFs) to my trading portfolio.
If there is a knife that I do not want to catch, THIS IS IT! MSTR is going to the toilet, even if you thought it's already in it... it's not in the toilet yet.
This Monday there's a possibility of a single-day reaction HIGH which could give us a new SHORT entry window. I will open a SHORT Monday night or Tuesday morning if the Indicators confirm a Bearish Divergence. If Tuesday closes higher than Monday then the bounce should last a bit longer.

MSTR Bounce Time???Looking at the perfect pullback spot for MSTR. We rejected the 1.618 of my fib and have pulled all the way back to the 50% mark of the original fib value. As well, this is the POC of the consolidation zone before the last run up. I would expect buyers to show up here and try to defend.
This is not financial advice. Just telling you what I see and hope to see in the coming weeks.

MSTR falling into buying territory I’m planning to open a small starter position at today’s open to catch a short-term bounce. If price continues to dip, I’ll scale in gradually until my full position is built. From there, I’ll be targeting a move back to the upside toward my projected exit level.
Close of the ENDLast price of MSTR could be between
$100-$80.
It will take more benefics and star a change of tendence.

QuantSignals V3 | Katy AI Contrarian MSTR Weekly PUT QuantSignals V3 Weekly Date: 2025-11-26
Current Price: $179.00
Weekly Momentum: Bullish (+4.27%)
Flow Intel: Bearish (PCR 6.20)
Trend: Mixed / Conflict
Trade Signal: PUT
Recommended Strike: $175.00
Entry Range: $1.91 – $2.05
Target 1: $3.50 (75% gain)
Target 2: $4.50 (125% gain)
Stop Loss: $1.20 (40% loss)
Confidence: 58%
Position Size: 2% of portfolio
Expiry: 2025-11-28 (2 days)
Analysis Summary:
Katy AI predicts a bearish trajectory (-1.32%) with 168-point prediction series showing consistent downside momentum.
Overbought RSI at 81.6 and 86% of weekly range high suggest potential reversal.
Contradiction exists: Weekly momentum bullish but Katy AI and extreme PCR indicate bearish pressure.
Options flow shows heavy institutional put buying (PCR 6.20).
Risk level: Medium-High due to conflicting signals.
Key Notes:
Tight 2-day expiry limits time decay risk.
Conservative stop protects against unexpected bullish breaks above $181.68.
High-risk trade—use small position size due to uncertainty.

Quant Signals V3: MSTR Downside Momentum TradeMSTR Weekly (QuantSignals V3 | 2025-11-24)
Direction: BUY PUTS
Confidence: 65%
Expiry: 2025-11-28 (4 days)
Strike Focus: $167.50
Entry Range: $6.75 – $7.15 (mid: $6.95)
Target 1: $10.73 (≈60% gain)
Target 2: $13.43 (≈100% gain)
Stop Loss: $4.85
Position Size: Medium / reduce due to moderate confidence
Weekly Momentum: NEUTRAL (–0.08% 1W)
Put/Call Ratio: 2.13 (Bearish)
Flow Intel: Bearish / institutional put buying
Risk Level: ⚠️ Moderate – conflicting signals
Current Price: ~$173.06
📈 Technical Overview
VWAP: $177.30 → price below VWAP suggests potential downside
Weekly range position: 23.1% → room to move down
Support: $166.00 (session low)
Resistance: $177.30 (VWAP)
24h Price Move: –6.46%
Trend: Conflicting signals — Katy AI bullish prediction vs bearish flow & news
Chart Tips:
Draw support at $166.00 and resistance at $177.30
Highlight entry band $6.75–$7.15
Mark targets $10.73 / $13.43 and stop $4.85
Monitor Bitcoin correlation and news catalysts
📰 Fundamental / Sentiment Notes
Bearish news pressure: BTC –6.4%, JPMorgan caution
Sector uncertainty, Michael Saylor defense statements
Options flow shows strong institutional put buying
⚠️ Risk Notes
Conflicting signals: Katy AI bullish vs bearish technicals & flow
Medium conviction → consider smaller position size
Monitor for volatility spikes around crypto-related news

Saylor’s Company Is at the Center of a Global Index Shock📉 MSCI vs Strategy: Why Michael Saylor’s Company Is at the Center of a Global Index Shock — And What It Means for Bitcoin
Over the past few weeks, one of the most important developments for both equities and crypto has quietly unfolded: MSCI, the world’s largest index provider, has started questioning whether Strategy (formerly MicroStrategy) should continue to be included in its global equity indices.
This is not a small technical issue.
This is a structural threat with potentially billions of dollars in forced selling, massive volatility for Strategy’s stock, and real implications for Bitcoin’s price trajectory.
Here’s the complete
breakdown 👇
🔍 What Triggered the MSCI Review?
MSCI launched a consultation on how to treat companies that keep the majority of their balance sheet in digital assets (mainly Bitcoin). They call these firms:
► Digital Asset Treasury Companies (DATs)
Strategy currently sits at the top of this category with over 200,000 BTC on its books.
MSCI’s concern is simple:
> “Is Strategy still an operating software company,
or has it effectively become a Bitcoin investment vehicle?”
If it is considered “fund-like,” it may no longer qualify for inclusion in traditional equity indices.
💥 Why This Matters
MSCI’s global indices are tracked by trillions of dollars in passive funds.
If Strategy is removed:
► Passive funds must sell Strategy
► Estimated forced selling: $2.8B – $8.8B
► This could trigger a violent liquidity shock in the stock
JPMorgan has already warned of large, inevitable outflows if MSCI finalizes the removal.
Timeline:
Consultation ends: Dec 31, 2025
Decision: Jan 15, 2026
Implementation: Feb 2026 index rebalance
This is now one of the most significant upcoming market catalysts for both Strategy’s stock and Bitcoin.
🧩 How This Impacts Strategy Stock (STRAT / MSTR)
The possible outcomes:
1. MSCI Removes Strategy (Bearish Scenario)
Forced selling by index funds
Stock drops 35–60%
Capital raising becomes harder
Leverage strategy weakens
Narrative shifts from “corporate Bitcoin champion” to “deindexed crypto proxy”
This is the worst-case scenario for Strategy shareholders.
2. MSCI Keeps Strategy but Reclassifies (Neutral Scenario)
Some hedging, light selling
Stock dips 10–20%
But no structural damage
Market adjusts and stabilizes
3. MSCI Fully Accepts Strategy (Bullish Scenario)
Relief rally
Stock jumps 20–40%
Strategy strengthens its identity as the “corporate Bitcoin standard”
Major buying flows from passive funds
This would be a massive validation for Saylor’s Bitcoin-centric business model.
₿ How This Affects Bitcoin
Strategy has become a de facto synthetic Bitcoin ETF:
Stock rises → Strategy borrows more → buys more BTC
Stock falls → borrowing becomes expensive → Bitcoin buying slows
A deep crash → market fears forced BTC selling
Under bearish MSCI outcome:
BTC likely drops 5–15% on fear
Leverage unwinds
Sentiment weakens temporarily
Under bullish MSCI outcome:
BTC gains 3–7%
Institutional confidence strengthens
More corporates may consider a Bitcoin treasury strategy
🔄 The Reflexive Feedback Loop
At the heart of this story is a powerful feedback loop:
Strategy stock → borrowing capacity → BTC accumulation → stock valuation → investor demand
MSCI’s decision can break or accelerate this loop.
This is why the market is watching this event very carefully.
📊 Quick Summary Table
MSCI Outcome Strategy Stock Bitcoin Sentiment
❌ Remove –35% to –60% –5% to –15% Fear
⚠️ Reclassify –10% to –20% –1% to –3% Neutral
✔️ Keep +20% to +40% +3% to +7% Bullish
🧠 Final Thoughts
Whether you’re a Bitcoin investor or an equity trader, this MSCI review is far more than a technical classification issue. It is a macroeconomic event that could:
Move billions in passive capital
Impact the largest corporate Bitcoin holder
Shape the future of Bitcoin treasury strategies
Affect volatility across BTC, NASDAQ, and crypto markets
The coming months will decide whether Strategy becomes:
⚡ A globally recognized corporate-Bitcoin pioneer,
or
⚠️ A de-indexed, fund-like crypto vehicle under regulatory pressure.
Either way, this is one of the most important long-term catalysts to watch.
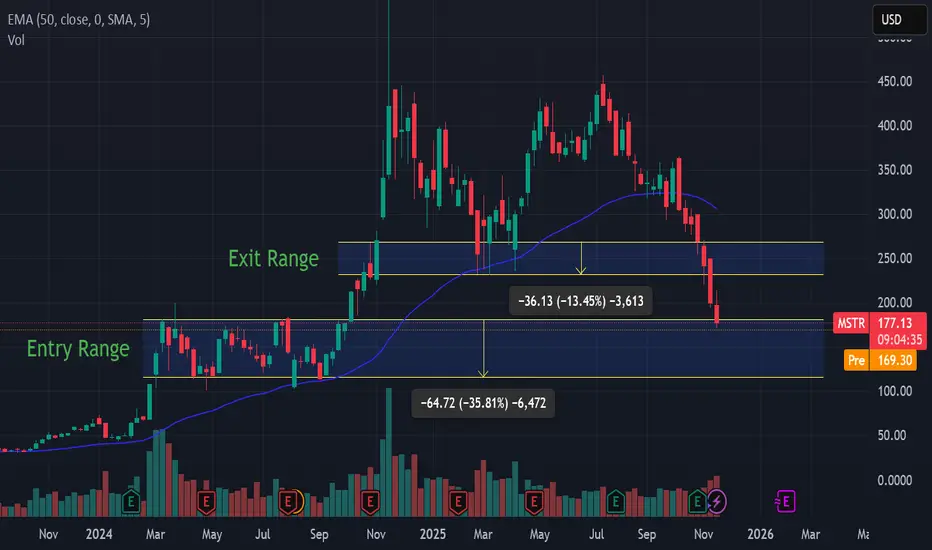
$MSTR: Rough sailing for Saylor. Trading strategy for Strategy.Since the largest crypto liquidation event on 10th of Oct which yipped out 19 B $ of leveraged positions the Crypto market finds itself in turmoil. One of the major causalities of all this FUD has been MicroStrategy. The stock NASDAQ:MSTR is now trading 2.3% below the NAV. That means the cos. NASDAQ:MSTR is 2.3% less valuable than the amount of CRYPTOCAP:BTC it holds on to its balance sheet. This signifies the market is pricing a lot of short to medium term downturn in the fundamentals of the stock and a credit event in the worst-case scenario leading to a liquidity and a solvency crisis.
From its ATH in Nov 2024 the stock has already lost 68% of the value. On 17th Sept I wrote in this blog that there is more downside expected in $MSTR/ CRYPTOCAP:BTC with support @ 0.002 CRYPTOCAP:BTC which indicates a price of 160 $ - 170 $ for $MSTR.
Is NASDAQ:MSTR only game in town? Charts seem to disagree. for NASDAQ:MSTR by RabishankarBiswal — TradingView
Currently the stock is @ 170 $. If we plot the Fib levels on the weekly from the bottoms of the FTX blowout in 2023 we clearly see the support and resistance levels for the stock. If NASDAQ:MSTR has 2 weekly close below 170 $ then we might easily visit the 140 $ range which seems to be a previous support level. If it breaks below 140 $ then we can easily see a 100 $ on $MSTR. Another key metrics is the short interest in the stock which is @ 10% of the current float.
Trade Set Up: NASDAQ:MSTR to see more downside before any turnaround. Below 170 $ the stock can go down to 140 $ and eventually finding support @ 100. NASDAQ:MSTR / CRYPTOCAP:BTC may visit 0.0015.

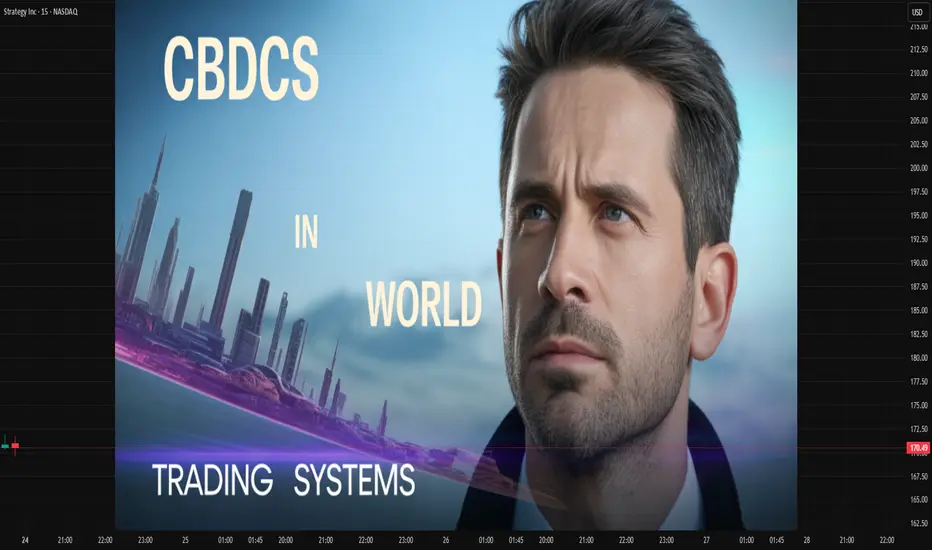
CBDCs in the World Trading System1. What Are CBDCs?
A CBDC is a digital form of legal tender issued by a country’s central bank. It is:
Sovereign-backed
Regulated and stable
A digital liability of the central bank
Designed for domestic and international use
CBDCs generally come in two forms:
Retail CBDCs – used by the general public for everyday transactions.
Wholesale CBDCs – used by financial institutions for large-value payments and settlements.
In the context of world trade, wholesale CBDCs hold greater significance due to their ability to streamline international payments and reduce reliance on intermediary banking systems.
2. Current Problems in the World Trading and Payment System
Before understanding the value of CBDCs, it's important to consider the limitations of the existing trading and settlement framework:
a. High Cost of Cross-Border Payments
International transactions often involve multiple banks, SWIFT messaging, and correspondent banking networks. This leads to:
Expensive transfer fees
Slow processing times
Reliance on intermediaries
b. Dollar-Dominated Global Trade
Over 80% of global trade is invoiced in USD. This creates:
Dependency on US monetary policy
Currency risk for emerging markets
High demand for dollar liquidity
c. Slow Settlement Processes
Cross-border trade can take days to settle due to:
Time zone differences
Compliance checks
Lack of common settlement rails
d. Fragmented Financial Infrastructure
Different countries use incompatible regulations, payment systems, and messaging formats, making interoperability difficult.
CBDCs are considered a strategic solution to all these challenges.
3. How CBDCs Can Transform the World Trading System
CBDCs have the potential to reshape global trade in multiple ways.
a. Instant and Low-Cost Cross-Border Settlements
CBDCs can enable near-instant settlements by connecting central bank systems directly through digital ledger technology (DLT).
Benefits:
Reduced transaction fees
Faster trade finance processes
Lower counterparty and settlement risk
b. Reduced Dependence on Intermediaries
Traditional cross-border payments rely on correspondent banks. CBDCs, however, enable:
Direct central bank-to-central bank transactions
Fewer intermediaries
Reduced complexity in the payments chain
This leads to greater efficiency and transparency.
c. Enhanced Transparency and Anti-Fraud Controls
CBDCs allow full traceability. This is advantageous for global trade because:
Money laundering can be detected easily
Fraud and trade-based financial crimes reduce
Compliance becomes more automated
With programmable features, central banks can embed smart compliance rules into the currency itself.
d. Strengthening of Local Currencies in Trade
If CBDCs become interoperable, nations may settle trades in their own currency instead of relying on USD.
This will help countries:
Reduce dollar exposure
Stabilize local exchange rates
Enhance monetary sovereignty
China’s Digital Yuan (e-CNY) is already being tested for cross-border trade to promote Yuan internationalization.
e. Programmability in Trade Finance
CBDCs can support programmable smart contracts, enabling automated trade functions such as:
Conditional payments
Automated customs clearance
Real-time shipment tracking linked to payment triggers
Smart invoices and escrow systems
This reduces human error, delays, and contract disputes.
4. CBDCs and Global Trade Networks
a. Interoperability Projects
Many global initiatives aim to connect CBDCs across borders:
mBridge (Hong Kong, China, UAE, Thailand, BIS)
Project Dunbar (Australia, Malaysia, Singapore, South Africa)
Project Icebreaker (BIS, Sweden, Norway, Israel)
These projects test how CBDCs can settle international trade without SWIFT.
b. Digital Trade Corridors
CBDC-enabled digital trade corridors can make it easier for regions to conduct business without dependency on legacy systems. They also facilitate:
Bilateral and multilateral trade agreements
Currency swap arrangements
Real-time settlement layers
c. Impact on SWIFT and Correspondent Banking
CBDCs could reduce global reliance on SWIFT. Although SWIFT is adapting through digital integration, CBDCs bypass many of SWIFT’s limitations.
5. Challenges and Risks of CBDCs in World Trade
Despite their potential, CBDCs face significant challenges.
a. Lack of Global Standards
Without common frameworks for:
Cybersecurity
Privacy
Settlement rules
Regulatory alignment
interoperability will be limited.
b. Cybersecurity Concerns
CBDCs increase vulnerability to:
Cross-border cyber-attacks
Systemic risk if central bank networks fail
State-sponsored digital warfare
c. Geopolitical Competition
Countries may use CBDCs to:
Avoid sanctions
Reduce dependence on dominant currencies
Create regional trade blocs
This could reshape global power balances.
d. Privacy Concerns
Governments may monitor transactions too closely, raising:
Data security issues
User privacy concerns
Risks of misuse of financial information
e. Impact on Commercial Banks
If businesses prefer using CBDCs for trade:
Commercial banks may lose transaction revenue
Deposits could shift away from banks
Banks may face funding pressure
Central banks must balance innovation without destabilizing financial institutions.
6. Future of CBDCs in the World Trading System
CBDCs are still in their experimental stage, but global momentum is strong:
Over 130 countries are exploring CBDCs
Over 20 countries are in pilot or launch phases
Major economies like China, India, UAE, and the EU are leading adoption
CBDCs will likely become a core settlement infrastructure in global trade within the next decade.
Future expectations:
CBDC-based trade hubs in Asia and the Middle East
Digital currencies replacing letters of credit (LCs)
Automation of global supply chain finance
Programmable trade contracts integrated into logistics systems
Rise of multi-CBDC platforms creating a unified digital trade layer
Conclusion
CBDCs represent a revolutionary step in the evolution of the world trading system. By providing a faster, cheaper, and more transparent method of cross-border settlement, CBDCs have the power to significantly reduce inefficiencies in global trade. They also promote monetary sovereignty, reduce dependence on the US dollar, and enable programmable trade finance. Although challenges such as cybersecurity, privacy, and geopolitical tensions persist, the direction of global finance clearly indicates that CBDCs will play a major role in shaping the future of international commerce.
MSTR (possible short)Alot going on here, but its jus because I have been charting this out since around March.
BTC has a bearish setup where we could possibly see 92.5Kish.
Looking at MSTR which is a huge follower, we broke below the 200 on the daily.
My reasoning for possible short entry (red dot).
1. Trend Based Fib (3-point in green): shows we could bounce here, but extend down toe the $200 level.
2. We could bounce here because we are re-testing the monthly IB that we broke out, we are at the 50% quadrant of that IB.
3. However, we are currently trading within the 3M quarterly candle, and the HTF breakout we had was never re-tested. Sweeping this 3M candle, would put us in a good spot for long term growth.
4. Short entry would be red dot, with covering at the last high on daily ($358ish).

157This channel is not providing individualized trading or investment advice, nor is it a banking service, brokerage service, trading service, investment service or money management service

MSTR chart update. Bounce to $266-315 before more downside?Updating the prior chart as the levels I had were off. I think it's likely that we bounce from this level.
You can see we've now hit a key support and filled a gap that was on the chart at $176. I think it's likely that we see a strong bounce from this level.
Reasons being:
1. We're at a key support
2. 3 touches of bottom of flag, usually 4th one breaks it, 3rd creates a powerful move in the opposite direction
3. Strong call flow on MSTR the past few days
I think it's likely we bounce up to the $266 or 315 resistance levels. This is a trade, not a long term position to hold.
Let's see if it plays out. Breaking this level as lower support will open up the possibility to see lower levels.

MSTR to $676MSTR is on major support, looking to run to $676 once bitcoin lifts (currently just below it's long term trend buy area).
Good luck!
