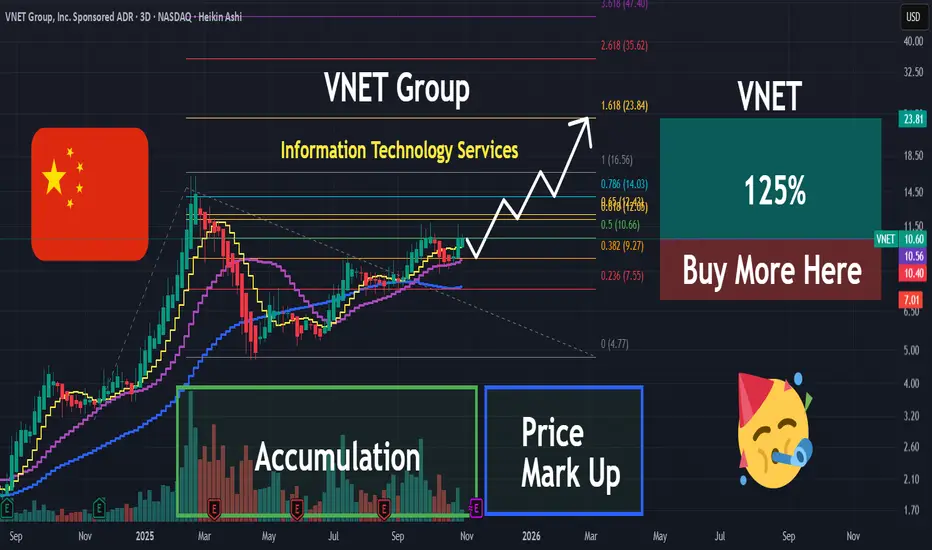
VNET | IT Services in China on the Rise | LONGVNET Group, Inc. operates as a carrier- and cloud-neutral internet data center services provider in China. It provides hosting and related services, including IDC services, cloud services, and business VPN services, to improve the reliability, security, and speed of its customers' internet infrastructure. The firm serves numerous industries, ranging from internet companies to government entities, blue-chip enterprises to small- and mid-sized enterprises. VNET Group was founded by Sheng Chen and Jun Zhang in 1999 and is headquartered in Beijing, China.
What traders are saying
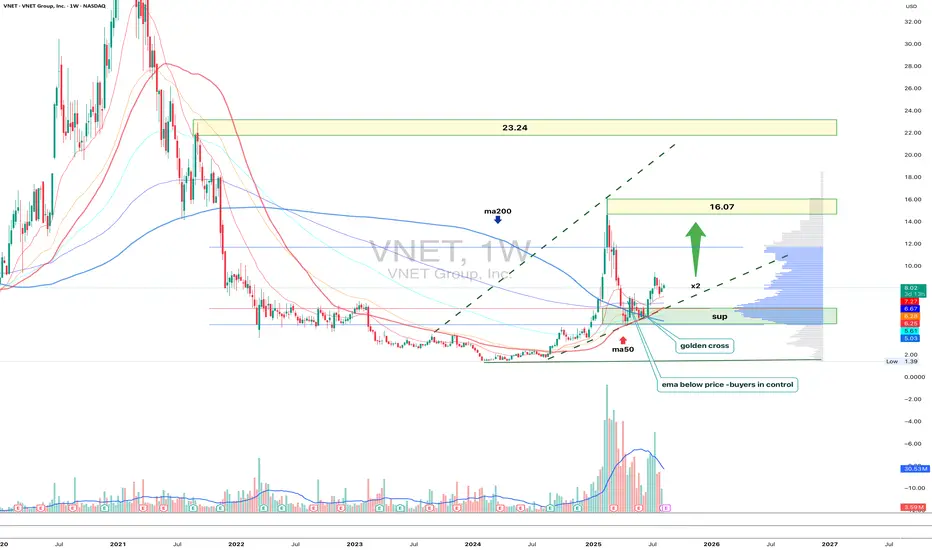
VNET 1W - second wave or second life?On the weekly VNET chart, the price has held above the 6.25–6.05 support zone, which previously triggered an impulsive rally. The current structure remains bullish: the MA50 is positioned above the MA200(golden cross) and ema below price(buyers control situation), and recent volume spikes indicate active buying interest. The next major resistance lies at 16.07 - where a key supply zone aligns with the previous local top. A breakout and consolidation above it would open the path toward the strategic target at 23.24, matching a Fibo extension and a historical distribution zone.
Fundamentally, VNET benefits from renewed investor interest in the Chinese tech sector and improved corporate earnings. Tactical plan: as long as 6.25–6.05 holds, long positions could target 16.07 first, with potential continuation toward 23.24.
A break below support cancels the bullish scenario. Sometimes the market offers a second chance and VNET may be one of those moments worth catching.
VNETReasoning:
Data processing Chinese stocks are showing strong sector performance.
Remember: Every long-term investment alert can also be played as a swing trade.
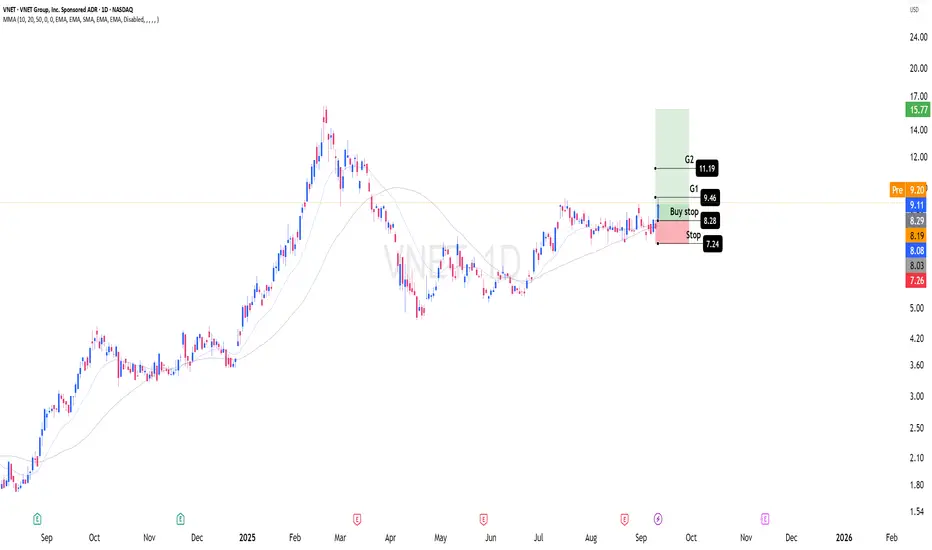
Long-Term Investors (3-12 Month Holds)
Entry: Full position on breakout
Profit Taking: Sell 1/4 to 1/5 at Goal 1
Exit Signal: Close below 20-day EMA (your trend guide) or 50EMA
Why: Strong moves are hard to time at the top, but the 20EMA acts as a reliable trend filter
Technical Analysis & Breakout Potential – $VNETTechnical Analysis & Breakout Potential – NASDAQ:VNET
1. Technical indicators show a "Strong Buy"
According to TipRanks, VNET scores strongly across several technical indicators such as RSI, MACD, and multiple moving averages—all signals point toward buy recommendations Investing.com also concludes with a “Strong Buy” sentiment across short, medium, and long term
2. Positive fundamental trigger: high revenue growth while maintaining guidance
VNET grew revenue by 22.1% year-over-year, and EBITDA rose 27.7%—while EPS disappointed. However, 2025 full-year guidance remains solid at 9.15 to 9.35 billion yuan, showing confidence in operational strength .
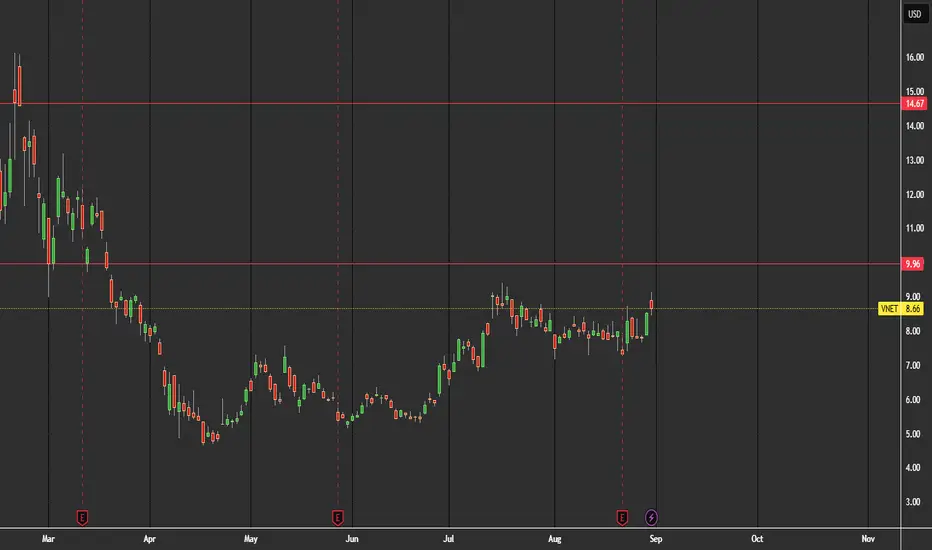
3. Technical price action and resistance zone
Today’s intraday high is around $9.25—just below $9.35. Barchart identifies resistance levels at R2: $8.98 and R3: $9.42 The stock is clearly approaching this breakout zone and confirms technical strength across higher moving averages such as MA20, MA50, MA100, and MA200
4. Volatility & outlook
VNET shows above-average volatility (~12% weekly) compared to the tech sector (~8.4%). For momentum strategies, however, this can drive rapid upside—especially during a technical breakout.
Verdict & Recommendation
Breakout level: $9.35 – a strong resistance level. A close above this would be a clear bullish trigger.
Upside potential: Breakout toward $9.42 – and possibly further toward $11+ based on analyst targets (avg. $11.20 → ~+29%)
Strong momentum: Supported by technical indicators and revenue growth; a solid risk/reward case.
Caution: High volatility means sharp moves in both directions — stop-loss management is essential.
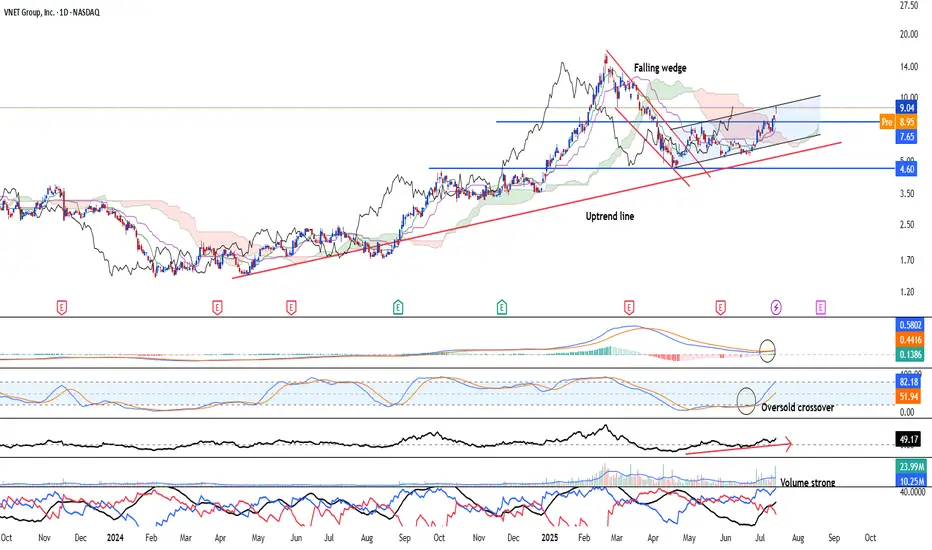
Vnet Group - Bullish trend in an early stage NASDAQ:VNET is looking at an early bullish trend continuation after the stock has broken out of the falling wedge and forms a pair of higher high and higher low. Uptrend remain intact since April 2024. Stock is likely to see strong upside going forward.
Long-term MACD just see a crossover. and histogram is positive. Stochastic oscillator has risen after confirming the oversold crossover and 23-period ROC is positive.
Volume is strong along with the uptrend and directional movement index is strongly bullish.
We see the target able to reach US$20.00. support will be at 7.65 and 6.27
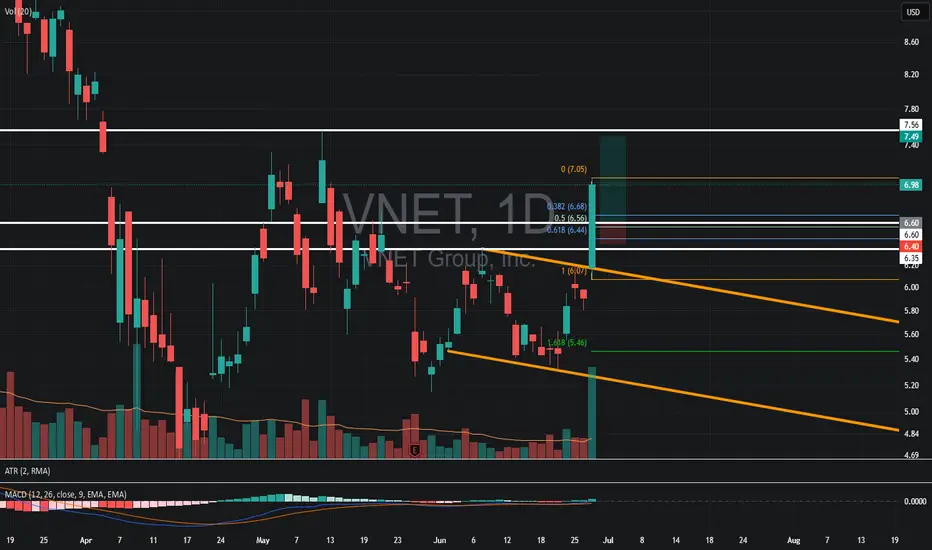
VNET – Watching for a Pullback Buy OpportunityWhy It's on My Radar:
Just broke out of a downward channel with solid volume
MACD curling up — bullish crossover setting up
Not trying to catch a falling knife here — waiting patiently for a clean pullback.
Key Level I’m Watching:
~$6.60 → lines up closely with the 0.50 fib retracement and prior resistance — could flip to support
If price bases there with decent volume, I’ll consider a long.
VNET china name that can pay niceNASDAQ:VNET got hammered due to the regulation talk. Reversing here and can rip over $24

+37% profit on VNET , Did you get some?It takes a lot to make money in the stock market More than nice charts .
This thing has potential to go higher and it could go lower too , so play it safe always .
#Stay_safe .
Trader K


VNET, price exceeded its 50-day Moving Average on Oct 08, 2020This price move could indicate a change in the trend, and may be a sell signal for investors. Tickeron A.I.dvisor found 46 similar cases, and 42 were successful. Based on this data, the odds of success are 90%. Current price $23.07 crossed the support line at $22.76 and is trading between $23.52 support and $22.76 support lines. Throughout the month of 09/08/20 - 10/08/20, the price experienced a +7% Uptrend, while the week of 10/01/20 - 10/08/20 shows a -5% Downtrend.
Bearish Trend Analysis
The Stochastic Indicator may be shifting from an upward trend to a downward trend. Tickeron A.I. detected that in 46 of 54 cases where VNET's Stochastic Oscillator exited the overbought zone, the price fell further within the following month. The odds of a continued downward trend are 85%.
The 10-day Moving Average for VNET crossed bearishly below the 50-day moving average on August 24, 2020. This indicates that the trend has shifted lower and could be considered a sell signal. Tickeron A.I. detected that in 13 of 19 past instances when the 10-day crossed below the 50-day, the stock continued to move higher over the following month. The odds of a continued downward trend are 68%.
Following a 3-day decline, the stock is projected to fall further. Considering past instances where Apple declined for three days, the price rose further in 50 of 62 cases within the following month. The odds of a continued downward trend are 79%.
VNET broke above its upper Bollinger Band on September 29, 2020. This could be a sign that the stock is set to drop as the stock moves back below the upper band and toward the middle band. You may want to consider selling the stock or exploring put options.
The Aroon Indicator for VNET entered a downward trend on September 03, 2020. This could indicate a strong downward move is ahead for the stock. Traders may want to consider selling the stock or buying put options.

$VNET can rise in the next daysContextual immersion trading strategy idea.
21Vianet Group, Inc. provides carrier and cloud-neutral Internet data center services to Internet companies, government entities, blue-chip enterprises, and small-to mid-sized enterprises in the People's Republic of China.
The demand for shares of the company still looks higher than the supply.
This and other conditions can cause a rise in the share price in the next days.
So I opened a long position from $24,14;
stop-loss — $23,24.
Information about take-profits will be later.
Do not view this idea as a recommendation for trading or investing. It is published only to introduce my own vision.
Always do your own analysis before making deals. When you use any materials, do not rely on blind trust.
You should remember that isolated deals do not give systematic profit, so trade/invest using a developed strategy.
If you like my content, you can subscribe to the news and receive my fresh ideas.
Thanks for being with me!


21Vianet Announces US$20 Million Share Repurchase ProgramVNET: 21Vianet Group, Inc.
2019-12-04 06:30:10
21Vianet Announces US$20 Million Share Repurchase Program


VNET Breakout LongAn idea for a long trade on VNET, Showing signs of consolidation and possible uptrend on the 3 Month chart. Wait for a break above the consolidation resistance line, confirmation of uptrend leads to an entry on the second low, placing stop loss at the last low or below the support created by old resistance. Follow uptrend with a trailing stop loss to maximize profits. Refer possibly to MACD & RSI to bolster confidence upon entry if it doesn't show signs of being overbought.


VNET breakoutLooking at chart of VNET today. Looks like a breakout:
1) MACD fast line crosses over slow line.
2) MACD crossover occurs above 0.
3) New 52-week high
4) Increased volume on breakout.
I took a long position on VNET today. (Just a smallish position).
In at $10.60 (just above the high on July 3, and above the previous day's high). My stop-loss is slightly below 13-day EMA (currently at $9.95) so I set my stop loss at $9.75. My target here is unknown. A 10% gain would put it at $11.66, 20% gain at $12.72. I will have a trailing stop-loss on this one to slightly below 13-day EMA.
Good luck out there!

VNET to break out and fill red candleVnet has been bullish under the radar looking to fill a red candle a few months ago.
Bullish VNETlooks like this one is getting ready to rum. i think it may go to 10. IMHO.
Do your own DD.

VNET - Long from current position VNET is forming a fallen-Angel pattern. Got some upward strength as it crossed EMA lines & money-flow turned positive.
We think it can go up to 15.15 or as high as 18.40 in long term.
