Merry Christmas & Happy New 2026 Year — PandorraResearch ThemeMerry Christmas and a powerful New 2026 to all TradingViewers and the entire TradingView community from @PandorraResearch — your super‑duper trader on the charts!
As this year’s final candles close, may your accounts be funded, your spreads be tight, and your slippage be nonexistent. May every tra
Key stats
Related stocks

SPIRAL FOCUS POINT 9/27 PLUS OR MINUS 3 DAYS EVENT The chart posted is the next turn within the spirals as we are nearing fib projections and wave A x 1.382 in the sp 500 6648/6671 . I am very bearish again at each turn a minor top has seen a pull back But now the PUT/Call models are Bell ringing . I have covered my short from friday clos
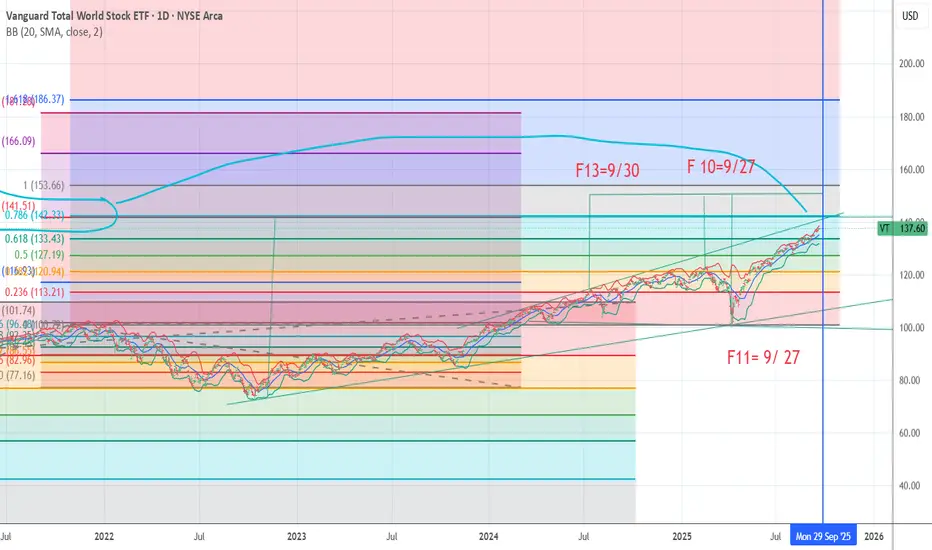
SPIRAL TURN SEPT 27 Plus or minus 1.3 days THE EVENT I am sitting back and relaxed and letting the market fulfill the math . it has been FUN .
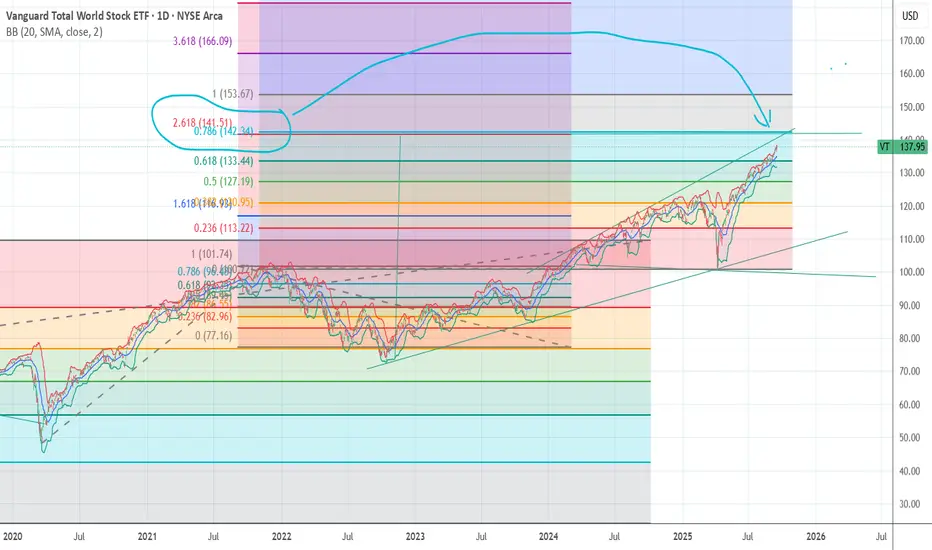
VT BEST CASE IN THE BULL ???The chart posted is the WORLD INDEX and THE BEST CASE and I mean BEST CASE . has formed what some would call a cup n handle and we are now ending the Handle . So There you go the Very BEST bull market For The WORLD Time is running OUT on LONG and I.T. cycles And I mean running OUT . Deflation

Macro Monday 26~Global Indexes Breaking OutMacro Monday 26
Global Index’s Breaking Out
As its Christmas Eve I wanted to do an early release for tomorrow and share something positive and Christmassy but at the same time share something of value, so here is a look at some of the major global ETF index’s and how promising they appear toward

KEEP your eye ON VT The chart posted shows me that we have been in only a BEAR MARKET Rally we have days left within this structure see 1968 1973 As I have stated bear market AVG 2.5 to 3.25 years

World Stock Index Inverse H&SThere’s a ripe inverse head and shoulders pattern on the Vanguard Total World Stock Index ETF. It would appear the index is poised to reach the previous all-time high which is the first target. The 2nd target is the price objective of the H&S pattern. I believe the chart is fairly self explanator

SPY SPXWeekly charts of $PX (top) vs. VT (Vanguard Total World Index - bottom) – fun fact
Generally they move in tandem but there are times when they do not. Just before pandemic sell off and the beginning of the current bear market, $SPX made a higher high but not by $VT (negative divergence), leading to

World stock markets - Looking good.Looks likely we get a good bounce here since we are at huge support levels.


See all ideas
Displays a symbol's price movements over previous years to identify recurring trends.
Frequently Asked Questions
An exchange-traded fund (ETF) is a collection of assets (stocks, bonds, commodities, etc.) that track an underlying index and can be bought on an exchange like individual stocks.
Since ETFs work like an individual stock, they can be bought and sold on exchanges (e.g. NASDAQ, NYSE, EURONEXT). As it happens with stocks, you need to select a brokerage to access trading. Explore our list of available brokers to find the one to help execute your strategies. Don't forget to do your research before getting to trading. Explore ETFs metrics in our ETF screener to find a reliable opportunity.
Yes, VTWAX pays dividends to its holders with the dividend yield of 1.71%.