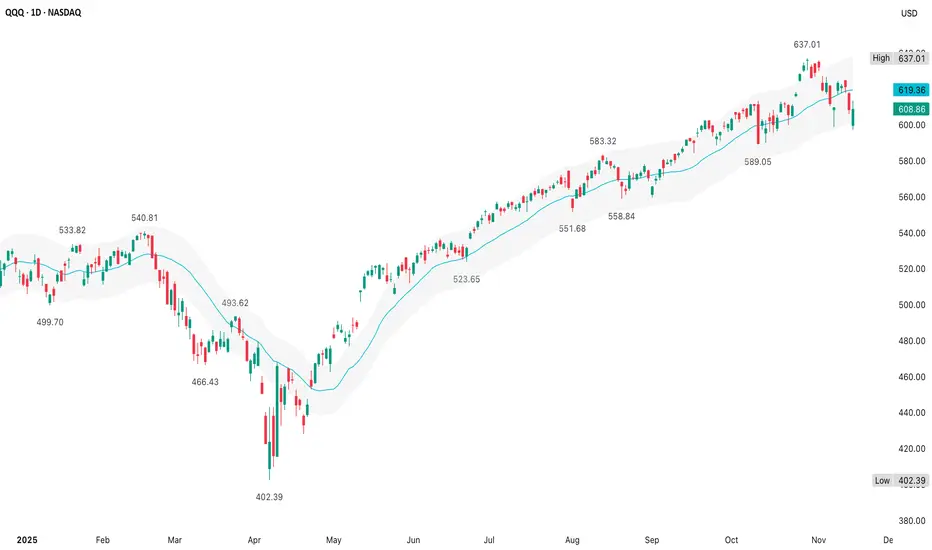
QQQ (14 November)The +/- 3% envelope with the 20d MA works well for mean-reversion strategies since it clearly shows inflection points where price may snap back toward the average
How far is price from its 20d MA & is price near extremes of the 3% bands?
Bollinger Bands adjust dynamically with volatility
Price
Key stats
About Invesco QQQ Trust Series I
Home page
Inception date
Mar 10, 1999
Structure
Unit Investment Trust
Replication method
Physical
Dividend treatment
Distributes
Distribution tax treatment
Qualified dividends
Income tax type
Capital Gains
Max ST capital gains rate
39.60%
Max LT capital gains rate
20.00%
Primary advisor
Invesco Capital Management LLC
Distributor
Invesco Distributors, Inc.
ISIN
US46090E1038
QQQ is one of the most established and actively traded ETFs in the world, albeit one of the most unusual. The product is one of a few ETFs structured as a unit investment trust. Per the rules of its index, the fund only invests in nonfinancial stocks listed on NASDAQ, and effectively ignores other sectors too, causing it to skew massively away from a broad-based large-cap portfolio. QQQ has huge tech exposure, but it is not a 'tech fund' in the pure sense either. The fund's arcane weighting rules further distance it from anything close to plain vanilla large-cap or pure-play tech coverage. The ETF is much more concentrated in its top holdings and is more volatile than our vanilla large-cap benchmark. Still, the fund has huge name recognition for the underlying index, the NASDAQ-100. In all, QQQ delivers a quirky but wildly popular mash-up of tech, growth, and large-cap exposure. The fund and index are rebalanced quarterly and reconstituted annually.
Related funds
Classification
What's in the fund
Exposure type
Electronic Technology
Technology Services
Stock breakdown by region
Top 10 holdings
Markets are flashing MAJOR warning signs…Markets are flashing MAJOR warning signs… NASDAQ:QQQ AMEX:SPY
In this video, we will look at the 21 ema on the Daily charts to review the move since April and where we could go from here.
If you have money in this market, you need to see this ASAP 👇

Qqq.. No crying in the casinoPullback from summer channel top to channel bottom is underway and almost finished..
But go to your weekly and zoom out a decade
Logarithmic
Zoomed in
So yes, we are at the bottom of a 6month channel but we are still at the top of a 15year trendline and I don't think we last above here much

Maybe levels for qqqLevels of support and resistant on QQQ. Levels have been holding very nice. Just trying out new time frames

QQQ But...QQQ has printed a clean staircase of lower highs from $624 to $623 to $621
This typically resolves in a test of the next support zone - which for QQQ is $615, then $610
Momentum indicators are weakening
RSI stalling in the low 50s
Stoch rolled over from the high 70s
Neither shows strong di

Mastering Market Momentum with ONE IndicatorLearn how to use the 21 EMA like a pro!
This video walks you through the exact setup I use — plus a unique twist that helps identify momentum shifts and reversals earlier than most traders spot them.
Whether you’re day trading or swing trading, this indicator can become your foundation for better

QQQ to 618, then 628If all goes well QQQ we should see this hold 598. This will confirm a bull-market is still in play, thus revisiting previous highs at 628-630. Why this price target? Volume Void or inefficiencies are present at 618 and lastly 628. My assumption is price tends to revisit these areas of inefficiencies

Market Condition, Trading Conditions and StrategiesHere are some important terms for traders to understand.
Market Condition refers to the overall long-term trend, where we are in the CYCLE of the Stock Market.
Trading Conditions are identified and traded by using the day over day and week over week trends and trendline patterns within that Cy

Market Focus on QQQ — Bullish Setup Taking Shape!🎯 QQQ ($INVESCO NASDAQ-100) Bullish Swing Trade Setup
The Layered Entry "Thief" Strategy | Profit Playbook 💰
📈 MARKET OUTLOOK
The QQQ (INVESCO QQQ TRUST) is positioned for a bullish swing trade setup. 🚀 This technical analysis focuses on strategic multi-layer entry execution with defined risk/rewar

Big Tech: MSFT, AAPL, META, GOOG Power Up with QQQ (Nov 12-15)Big Tech Momentum: MSFT, AAPL, META, GOOG Move in Sync with QQQ
Market Overview (QQQ + GEX)
The NASDAQ remains structurally bullish as QQQ continues to hold above 620. On the daily chart, price maintains its long-term ascending channel, with buyers defending the lower trendline near 617–620. Gamma

See all ideas
Summarizing what the indicators are suggesting.
Oscillators
Neutral
SellBuy
Strong sellStrong buy
Strong sellSellNeutralBuyStrong buy
Oscillators
Neutral
SellBuy
Strong sellStrong buy
Strong sellSellNeutralBuyStrong buy
Summary
Neutral
SellBuy
Strong sellStrong buy
Strong sellSellNeutralBuyStrong buy
Summary
Neutral
SellBuy
Strong sellStrong buy
Strong sellSellNeutralBuyStrong buy
Summary
Neutral
SellBuy
Strong sellStrong buy
Strong sellSellNeutralBuyStrong buy
Moving Averages
Neutral
SellBuy
Strong sellStrong buy
Strong sellSellNeutralBuyStrong buy
Moving Averages
Neutral
SellBuy
Strong sellStrong buy
Strong sellSellNeutralBuyStrong buy
Displays a symbol's price movements over previous years to identify recurring trends.
Frequently Asked Questions
An exchange-traded fund (ETF) is a collection of assets (stocks, bonds, commodities, etc.) that track an underlying index and can be bought on an exchange like individual stocks.
QQQ trades at 593.42 USD today, its price has fallen −0.85% in the past 24 hours. Track more dynamics on QQQ price chart.
QQQ net asset value is 603.59 today — it's risen 0.25% over the past month. NAV represents the total value of the fund's assets less liabilities and serves as a gauge of the fund's performance.
QQQ assets under management is 398.21 B USD. AUM is an important metric as it reflects the fund's size and can serve as a gauge of how successful the fund is in attracting investors, which, in its turn, can influence decision-making.
QQQ price has risen by 0.95% over the last month, and its yearly performance shows a 19.13% increase. See more dynamics on QQQ price chart.
NAV returns, another gauge of an ETF dynamics, have risen by 0.25% over the last month, showed a 4.70% increase in three-month performance and has increased by 22.22% in a year.
NAV returns, another gauge of an ETF dynamics, have risen by 0.25% over the last month, showed a 4.70% increase in three-month performance and has increased by 22.22% in a year.
QQQ fund flows account for 17.27 B USD (1 year). Many traders use this metric to get insight into investors' sentiment and evaluate whether it's time to buy or sell the fund.
Since ETFs work like an individual stock, they can be bought and sold on exchanges (e.g. NASDAQ, NYSE, EURONEXT). As it happens with stocks, you need to select a brokerage to access trading. Explore our list of available brokers to find the one to help execute your strategies. Don't forget to do your research before getting to trading. Explore ETFs metrics in our ETF screener to find a reliable opportunity.
QQQ invests in stocks. See more details in our Analysis section.
QQQ expense ratio is 0.20%. It's an important metric for helping traders understand the fund's operating costs relative to assets and how expensive it would be to hold the fund.
No, QQQ isn't leveraged, meaning it doesn't use borrowings or financial derivatives to magnify the performance of the underlying assets or index it follows.
In some ways, ETFs are safe investments, but in a broader sense, they're not safer than any other asset, so it's crucial to analyze a fund before investing. But if your research gives a vague answer, you can always refer to technical analysis.
Today, QQQ technical analysis shows the sell rating and its 1-week rating is buy. Since market conditions are prone to changes, it's worth looking a bit further into the future — according to the 1-month rating QQQ shows the buy signal. See more of QQQ technicals for a more comprehensive analysis.
Today, QQQ technical analysis shows the sell rating and its 1-week rating is buy. Since market conditions are prone to changes, it's worth looking a bit further into the future — according to the 1-month rating QQQ shows the buy signal. See more of QQQ technicals for a more comprehensive analysis.
Yes, QQQ pays dividends to its holders with the dividend yield of 0.47%.
QQQ trades at a premium (0.01%).
Premium/discount to NAV expresses the difference between the ETF’s price and its NAV value. A positive percentage indicates a premium, meaning the ETF trades at a higher price than the calculated NAV. Conversely, a negative percentage indicates a discount, suggesting the ETF trades at a lower price than NAV.
Premium/discount to NAV expresses the difference between the ETF’s price and its NAV value. A positive percentage indicates a premium, meaning the ETF trades at a higher price than the calculated NAV. Conversely, a negative percentage indicates a discount, suggesting the ETF trades at a lower price than NAV.
QQQ shares are issued by Invesco Ltd.
QQQ follows the NASDAQ 100 Index. ETFs usually track some benchmark seeking to replicate its performance and guide asset selection and objectives.
The fund started trading on Mar 10, 1999.
The fund's management style is passive, meaning it's aiming to replicate the performance of the underlying index by holding assets in the same proportions as the index. The goal is to match the index's returns.