Natural Gas - Holding Daily SupportNat GAs is holding daily chart support.
The bulls today pierced the 200 MA but failed to close above it.
Inventories on Thursday will likely dictate whether we get the weekly chart downtrend to resume.
Nat gas has volatile price action as its stuck in 2 trend formations.
The daily remains in

The Natural Gas Will Jump from a Support LevelHello Traders
In This Chart Natural Gas HOURLY Forex Forecast By FOREX PLANET
today Natural Gas analysis 👆
🟢This Chart includes_ (Natural Gas market update)
🟢What is The Next Opportunity on Natural Gas Market
🟢how to Enter to the Valid Entry With Assurance Profit
This CHART is For Trader's that
LNG Week 42: 87 BCF Storage Rise Meets Warm Weather Volatility*Due to the platform's features, the charts are arranged in sequence from left to right, from the first to the Eighth chart. The charts were created by our team and based on an analysis from Bloomberg and the EIA data.
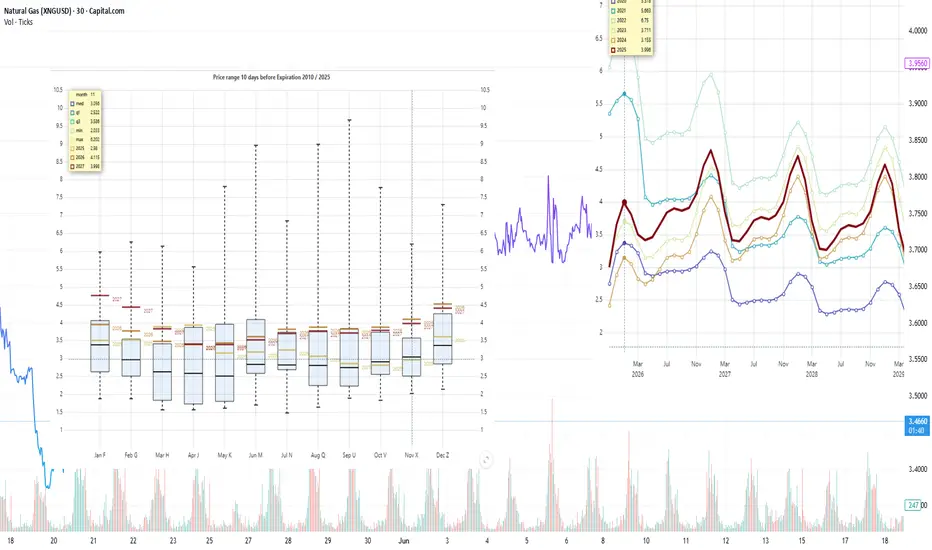
Current prices compared to price dispersion 10 days before expiration by month
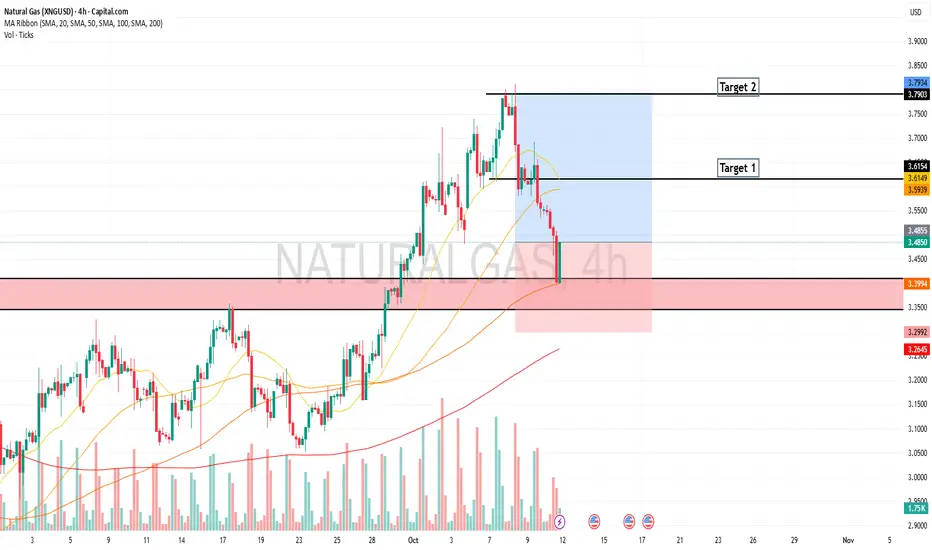
NG: Head shoulders on natural gasHello, dear traders!
What we have: head and shoulders on H4, divergence on H4, shooting star on the weekly timeframe.
Target - the nearest support level.

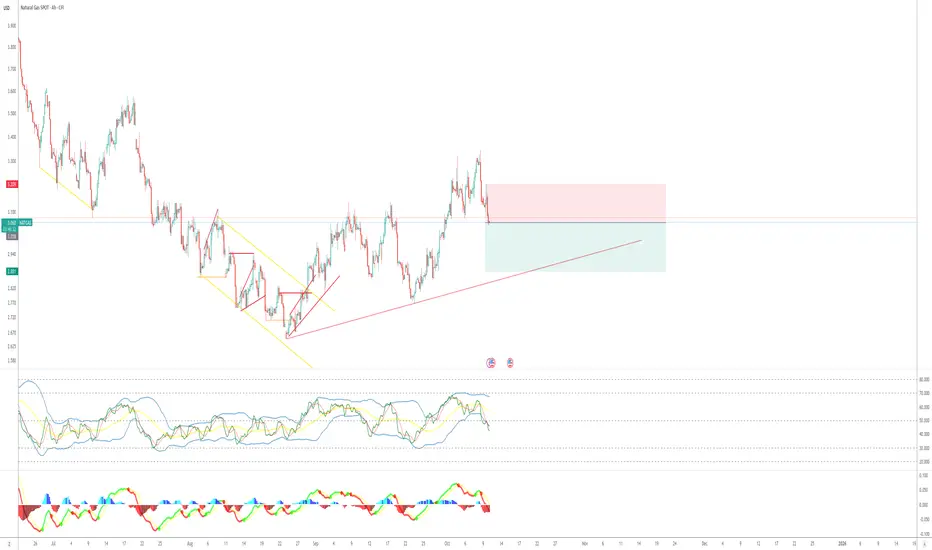
natural gas second buying opportunitywe got a clear trendline breakout on nat gas ##
anticipating now second buy
lets goooo

Natural Gas Full Bear After Inventories!Natural GAs plummeted today on inventory report.
The consensus was for 76BCF build but came in higher at 80BCF build.
This demonstrates less demand and higher production.
The technical picture is slowly starting to breakdown for Nat Gas...the bulls need to do something quick to firm up price o

NATGAS SHORT (A SETUP)A break of structure to the down side indicates a move targeting the bullish trend line. This move has happened before, and the break usually on Thu.
Natural Gas - Epic Trade SetupNatural Gas is potentially setting up a blow off top move into its Thursday inventory report.
This chart pattern rally is looking very similar to what we saw last Thursday when Nat gas had a 6.6% range decline from the high pivot it made off of inventories.
If we get a blow off top move on Thurs

Natural Gas Pummeled on Inventories Natural gas saw continued heavy selling today off the inventory report.
Inventories came in at 80B which is 4Billion higher than the estimate.
This is showing a little bit less of demand pull.
The Weekly 200 MA was the technical rejection zone for Nat Gas.
We will be live trading Nat Gas tom

Heading to $4Still might chop next week, but the greater trend lines and fib retracement are saying we are going back up

See all ideas
Displays a symbol's price movements over previous years to identify recurring trends.