THE UNTOLD STORY OF 2025: The Looming US Natural Gas SqueezeHaving examined the broader oil picture, let's turn our focus to natural gas.
Unlike oil, the US natural gas market is setting up for a potential sharp price increase in the near future. The US gas market is a relatively isolated phenomenon. Even if the rest of the world experiences falling energy prices and a widespread economic crisis, the situation in the US could be the complete opposite. Let's break down why.
From a technical perspective, as with oil, I believe we established an absolute price floor in 2020. The COVID-19 pandemic crushed prices that were already low due to a gas glut caused by the shale revolution and soaring production.
The 2022 price spike, while sharp and emotionally driven by the war in Ukraine and the European energy crisis, failed to reach the peaks seen in international LNG prices. This was simply because the US market is not fully integrated with the global market. LNG export capacity was insufficient to pull massive volumes of US gas abroad; it remained trapped domestically.
Subsequently, prices fell back to their previous lows.
However, we now appear to be seeing the initial waves of a new cycle forming. A falling wedge or ending diagonal pattern currently developing could signal the sharp, explosive move that typically follows such a pattern.
Several fundamental factors support this thesis:
Growing LNG Exports: New LNG export projects are starting to draw more and more gas away from domestic supply.
Soaring Power Demand: Demand for electricity generation from data centers (for cryptocurrency and AI) is rising dramatically.
Stagnant Production: Gas production has plateaued and is not growing.
The End of an Era?: A recent EIA report has sparked debate about the possible end of the shale gas and oil boom in the US, suggesting prime drilling locations are dwindling.
Add an impending financial crisis and the potential for a credit crunch that the Fed may be unable to liquify this time around (a topic for a separate analysis), and you have a recipe for a perfect storm in the US market.
Another critical factor is that US drilling and extraction are highly capital-intensive. Fracking requires significant working capital (equipment, materials) and involves high operational expenditures. This is all financed with debt. For the oil sector to remain profitable, it requires sustained prices above $60 per barrel.
If oil prices fall and production declines—and we know the rig count is already dropping—the production of associated gas will also fall.
If industry financing dries up, a wave of bankruptcies will begin. Highly leveraged small operators will be forced out of business, shutting in their gas production as they go.
US prices would then skyrocket. Major players would begin to acquire struggling smaller companies, snapping up their assets and drilling rights at a discount, positioning themselves for the next cycle.
NATURALGAS trade ideas

Natural Gas fell on bearish EIA data and cooler forecastsNatural Gas fell on bearish EIA data and cooler forecasts
October natural gas tumbled on August 18 after the EIA reported a larger-than-expected 90 bcf storage build, pushing inventories more than 200 bcf above the five-year average. XNGUSD remains under pressure from core fundamentals including supply-demand balances, weather trends, geopolitics, macro conditions, and competing fuel prices.
Further downside came as forecasts showed fewer cooling degree days over the next two weeks. Analysts warned the market is running out of time for late-summer heat to tighten balances, with October often bringing cooling demand offset by weaker heating needs.
Losses accelerated on August 18 as late-September forecasts turned cooler, reducing air-conditioning demand. Meanwhile, near-record U.S. output and elevated rig activity continue to weigh on prices.
XNG/USD Swing Trade Plan – Entry, Stop, and Target Explained🚀 NATURAL GAS (XNG/USD) – Energies Market Wealth Strategy Map ⚡🔥
(Swing Trade Setup – Thief Layered Style)
📊 Plan
✅ Bullish confirmation spotted with LSMA pullback 🟢
✅ Thief’s unique layering entry strategy 🎭 — stacking multiple buy limit orders to sneak into the market like a pro.
Layered Entry Levels:
Buy Limit @ 2.800 🧩
Buy Limit @ 2.850 🧩
Buy Limit @ 2.900 🧩
Buy Limit @ 2.950 🧩
(Feel free to add more layers based on your own risk appetite.)
🛡️ Risk Management
Stop Loss (Thief SL): ⚠️ @ 2.750
(Note: Dear Ladies & Gentlemen – Thief OG’s – this SL is my style. Always set your own SL according to your risk.)
🎯 Target Zone
👮 Police Barricade spotted around 3.300 🚨
Here we have:
Strong resistance wall 🧱
Overbought signals 📈
Potential trap zone
👉 Take your profits before the market police catch you! Escape with your bags full 💼💨
(Note: Dear Ladies & Gentlemen – Thief OG’s – this TP is my style. Always set your own target according to your profit goals.)
🔍 Related Pairs & Correlations
FXOPEN:XNGUSD (Natural Gas) – our main thief play 🎭
BLACKBULL:WTI / TVC:UKOIL (Crude Oil & Brent) 🛢️ – often show energy sector momentum correlation
ICMARKETS:XBRUSD (Brent Crude) – watch for confirmation of energy strength 🔥
SP:SPX / TVC:DXY (S&P 500 & US Dollar Index) – dollar strength can pressure commodities
OANDA:XAUUSD (Gold) – safe haven vs energy volatility ⚡
Correlated markets can confirm direction or signal early reversals. Always watch the energy family together for big moves.
✨ “If you find value in my analysis, a 👍 and 🚀 boost is much appreciated — it helps me share more setups with the community!”
⚠️ Disclaimer: This is a thief-style trading strategy created just for fun & educational purposes. Not financial advice. Trade safe, trade smart.
#XNGUSD #NaturalGas #Commodities #SwingTrade #EnergyMarkets #LayeringStrategy #TradingCommunity #MarketThief #OGStyle
Natural Gas Bearish News TodayNatural Gas crumbled off the inventory report this morning.
Natural gas inventories came in at 90B vs 80B consensus.
This larger than expected build shows a weaker demand for Nat Gas during this seasonal period.
Key things to consider:
1. EU moves to accelerate ban on Russian LNG.
2. New Israel–Egypt pipeline coming online
3. China continues to import from Arctic LNG‑2 despite sanctions
4. Japan’s JERA in talks to buy U.S. shale gas assets
5. Gas storage in Germany & winter supply concerns
6. Western Canada storage nearly full; supply glut
7. Canadian production at record levels, but prices very low

Target ReachedThe target was touched and according to the previous analysis I had provided, the price continued to decline until the time frame of August 12-September 12 and then shot up.
Good luck
NEoWave Chart

XNGUSD ShortXNGUSD is expected to drop from 3.31 USD, confirmed by a Crab harmonic pattern indicating strong bearish momentum, with TP1 and TP2 as key targets.

U.S. Natural Gas rises, but outlook mixedU.S. Natural Gas rises, but outlook mixed
U.S. natural gas futures climbed about 2% to an eight-week high on August 17, supported by lower daily output and stronger demand forecasts for the next two weeks. However, October contracts retreated from a one-week high on Wednesday, settling slightly lower as traders anticipated a larger-than-average build in EIA inventories.
Prices initially spiked midweek on forecasts for late-summer heat across much of the U.S., which is expected to drive up power-sector demand for air conditioning and slow inventory accumulation ahead of the winter heating season. Atmospheric G2 projected above-normal temperatures for September 22–26, with warmer conditions extending into the north-central U.S. from September 27–October 1.
On the supply side, higher U.S. production remains a headwind. The EIA last week raised its 2025 output forecast by 0.2% to 106.63 bcf/day, near record highs, with active natural gas rigs recently hitting a two-year peak.

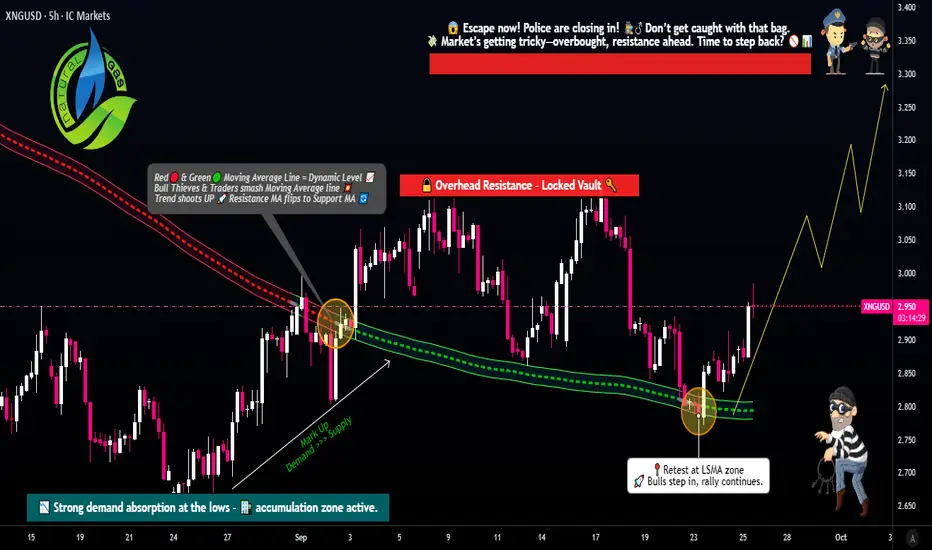
Profit Blueprint on XNG/USD! Is This the Bullish Energy Move?😎 Steal the Show with XNG/USD: The "Thief" Day Trade Blueprint! 🚨
Asset: XNG/USD (Natural Gas CFD) - Energies MarketVibe: A cheeky, calculated heist to snag profits with a slick Ichimoku breakout strategy! 💰
📜 The Master Plan: Ichimoku Kijun Line Breakout
🎯 Confirmed Bull Trend: The price has broken above the Ichimoku Kijun-Sen line, signaling a bullish move in the Natural Gas CFD market. This breakout is our green light to execute the "Thief Strategy" with precision!
🕵️♂️ Entry: The Thief’s Layered Approach
🔍 How It Works: The "Thief Strategy" uses a layering method with multiple buy limit orders to scale into the trade safely, protecting your capital while maximizing profit potential. No fear, just finesse! 😎
Buy Limit Layers:
🥉 2.960
🥈 2.980
🥇 3.000
🏆 3.020
💡 Pro Tip: Add more layers based on your risk appetite and account size for extra flexibility!
Alternative Entry: If you prefer a single entry, jump in at the current market price after the Kijun-Sen breakout confirmation. Your call, Thief OG! 😏
🛑 Stop Loss: Protect Your Loot!
🚨 Thief Stop Loss: Set at 2.900, just below the breakout level to guard against reversals.
Customize It: Adjust your stop loss based on your risk tolerance and strategy. This is your heist—own it!
Note: Dear Thief OG’s (Ladies & Gentlemen), I’m not dictating your stop loss. Manage your risk and keep your profits safe! 💪
🎯 Target: Escape Before the Trap!
🏃♂️ Profit Target: Aim for 3.150, where strong resistance, overbought conditions, and a potential trap await. Cash out before the "police" (market reversal) catch you!
Note: You’re the mastermind here. Take profits at your own discretion—don’t let me cap your gains! 💸
🔗 Correlation & Related Markets to Watch
Natural Gas (XNG/USD) often correlates or reacts with:
ICMARKETS:XBRUSD (Crude Oil Brent) – Energy sector movements can impact gas demand.
FOREXCOM:USOIL (Crude Oil WTI) – Supply/demand shocks in oil can spill into gas pricing.
OANDA:XAUUSD (Gold) – Inflation hedge & safe-haven flows can influence energy sentiment indirectly.
TVC:DXY (US Dollar Index) – A stronger/weaker dollar impacts commodity pricing.
SP:SPX (S&P 500 Index) – Risk-on/risk-off sentiment across markets.
Keeping an eye on these pairs helps confirm energy market momentum and macro sentiment.
Key Correlation Point: Natural Gas prices often lead or lag other energy markets due to supply/demand dynamics and seasonal factors. Confirm your trade with cross-asset analysis for a sharper edge! 📊
🧠 Why This Setup Rocks
Ichimoku Precision: The Kijun-Sen breakout is a reliable signal for short-term bullish momentum.
Layered Entry Safety: The Thief Strategy’s multiple limit orders spread risk and allow scaling without overcommitting.
Risk Management: Clear stop loss and target levels keep your heist disciplined and profitable.
Market Context: Energy markets are volatile, but this setup leverages technical confirmation to ride the wave. 🌊
✨ If you find value in my analysis, a 👍 and 🚀 boost is much appreciated — it helps me share more setups with the community!
#ThiefStrategy #XNGUSD #NaturalGas #Ichimoku #DayTrading #EnergyMarkets #TradingView

XNGUSD for buy Price hit the third touch of the trend line on HTF. Price broke the previous bearish trendline indicating a bullish movement. Our confirmation is the last bullish pinbar retesting the support zone.

Weather vs. Supply: Nat-Gas prices rallyWeather vs. Supply: Nat-Gas prices rally
Natural gas prices surged in mid-October, driven primarily by forecasts for hotter-than-average US weather, which was expected to boost demand for cooling and electricity generation. Supporting this bullish sentiment, data showed US electricity output had increased year-over-year.
However, these gains were tempered by bearish fundamentals. US natural gas storage levels rose more than expected and remained above the five-year average, indicating ample supply. Furthermore, the number of active gas rigs held steady, remaining below their recent peak, while European gas storage levels were also below their seasonal average.

GAS: FROM TRADING SMALL TO A NEW "GOLDEN AGE"?Despite the extremely nuanced wave count on the lower timeframes, we managed to sit on our hands when the market was unclear and only take selective, high-probability opportunities where they presented themselves.
Overall, my base case scenario is that after some minor moves early in the week (TIP: NatGas often continues the previous week's trend into Monday-Tuesday), we'll see a powerful breakout to the upside.
A move down is certainly possible, but we're not factoring it into our plan for now. We'll only shift our focus if the indicators start screamingly loudly about it.
The big picture is painting a very optimistic scenario for gas. It looks like after one more downcycle, the commodity could be poised for a new "golden era" – or at least a very strong year.
The global context is worth a separate deep dive. Right now, many LNG buyers worldwide are signing contracts linked to the US Henry Hub benchmark. It's quite plausible that US gas will become more expensive than oil-indexed gas (the standard in the Middle East, Asia, and for Russian LNG contracts).
Like and comment if you find this topic interesting! If there's enough engagement, I'll put together a dedicated article on this, as I work in the LNG industry myself and this is a subject close to my heart.

NGAS - UniverseMetta - Signal#NGAS - UniverseMetta - Signal
D1 - Formation of potential 3rd wave + retest of trend line. Stop behind minimum of 2nd wave.
Entry: 2.9979
TP: 3.1945 - 3.5475 - 3.7752 - 4.1294
Stop: 2.8858

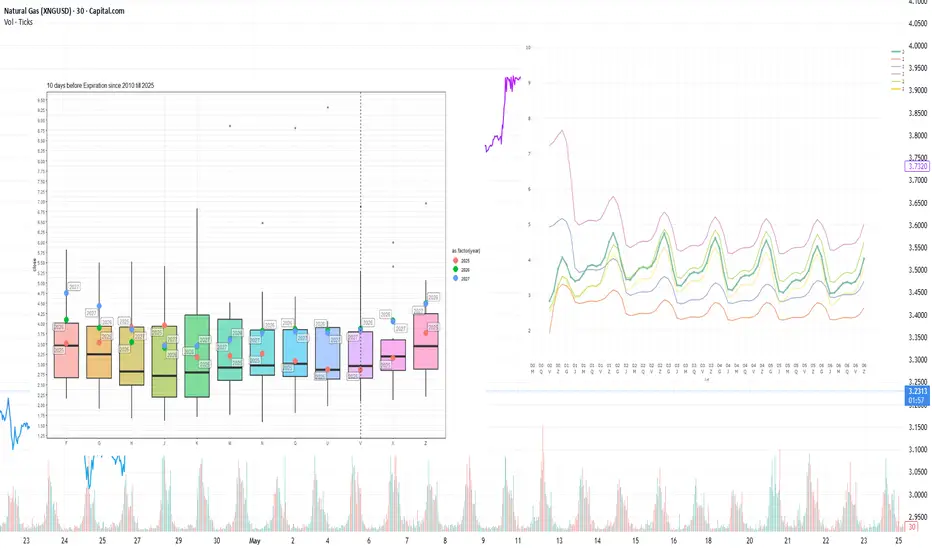
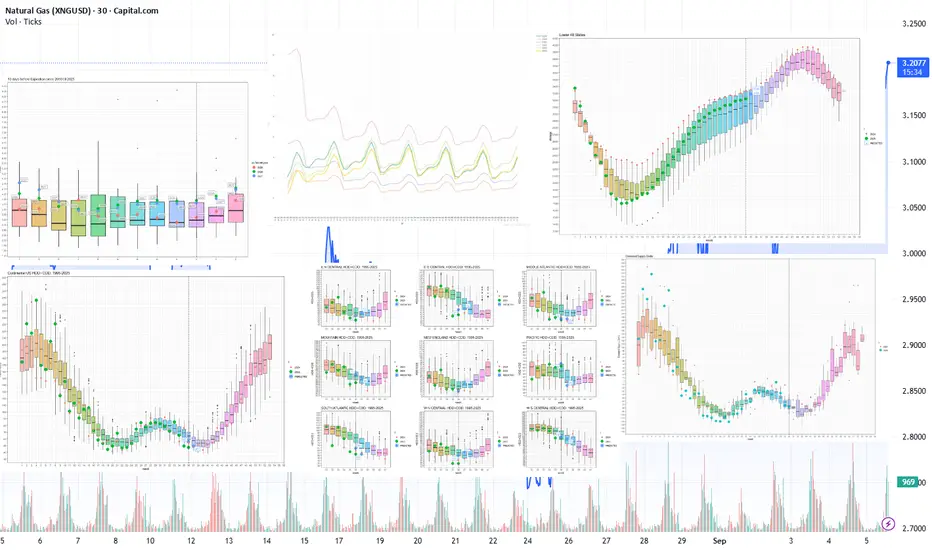
LNG:Storage Inventories Projected to Increase above 2024 Levels.*Due to the platform's features, the charts are arranged in sequence from left to right, from the first to the ninth chart.
Current prices vs. price spread 10 days before expiration by month since 2010
The expiration of the NGV25 contract is occurring near the 15-year median. The subsequent NGX25 contract is currently trading around the 10-day pre-expiration historical average, however, showing elevated volatility. Winter 2026 contract prices remain above the interquartile range.
Current forward curve vs. 2020-2024
The forward curve shape remains stable, increasingly resembling the configurations observed on comparable calendar dates in 2023 and 2024. This pattern is particularly evident in contracts with delivery three years from now or longer, where a pronounced convergence toward historical pricing levels is occurring.
Current inventory and forecast for next week compared to 2019-2024
During Week 38 (September 15–21), storage inventories are projected to increase by +76 BCF, reaching 3,509 BCF — already surpassing 2024 storage levels. Meanwhile, injection rates have slowed due to reduced cooling demand and now align with the five-year median pace. Elevated production remains the primary driver behind inventory growth.
Weekly HDD+CDD total from current NOAA data and forecast for the next two weeks comparing 1994-2024
Across the continent, the current year’s Week 39 is marked by HDD+CDD values significantly below the 30-year historical average. Forecasts for Week 40 suggest continued weakness in these metrics, which is expected to suppress demand further and may reignite downward pressure on prices.
Explanation of the chart: candles represent quantiles for 30 years from 1994 to 2024. Red dots 2024, green 2025, blue prediction 2025.
Weekly HDD+CDD total from current NOAA data and forecast for the next two weeks compared to 1994-2024 by region
Forecasts across key regions align with the broader trend: HDD+CDD values remain below the 30-year historical average.
Weekly cumulative supply/demand differentials compared to 2014-2024
Despite elevated inventory levels and robust production pace, the weekly aggregate supply-demand spread chart for the 2014–2024 period illustrates a key observation: the divergence between demand and supply has widened significantly above the decade-long average and now mirrors the level seen during the same week in 2024. The main factors sustaining strong demand include consistently high LNG exports, steady industrial consumption, and gas-fired power generation.
Number of Days for Deliveries from Storages
The chart illustrates the number of supply days equated to solely storage deliveries, assuming current consumption levels. In February–March 2025, inventories stood at 10–18 days — it’s comparable to or slightly below the historical average. From May through August, coverage increased to 25–35 days, which remains somewhat below the 10-year range. By September 2025, inventories rose to 33 delivery days, aligning with the median but still below the peaks observed in 2015–2016. This moderate level of storage adequacy creates a structurally tighter market, where even minor production disruptions or modest demand spikes can trigger disproportionate price reactions - especially during the late winter to early spring period.
Weather Anomalies (HDD+CDD) and Fundamental Factors
Overall, fundamental factors and weather anomalies are within the expected range, with no systemic deviations, except for isolated declines in LNG exports and Mexican exports, which may temporarily support prices.
Anomalies in Power Generation Sources
Core generation across most sources has evidently stabilized, with remaining key anomalies observed in coal, hydro, and solar output.
This analysis was conducted in cooperation with Anastasia Volkova, analyst of LSE.
NATAG! - MOVE INCOMING!🚨 NATGAS – The Calm Before the Pop? 🚨
Alright traders, let’s break this beast down 👇
🕰 Weekly View
Price just rejected hard from the 3.4 – 3.8 supply zone and has been sliding since. Now we’re parked on the 2.6 – 2.7 liquidity trendline. This is the decision point — bounce or flush into the 2.0s.
📉 Daily Structure
The Elliott Wave count lines up:
Wave (1) topped near 5.0
Wave (2) retraced cleanly
Wave (3) rallied to 4.2
Wave (4) dragged us back to support
Now the big question → do we get a Wave (5) relief rally back into 3.2 – 3.4 supply? 👀
⏱ 4H Breakdown
On the lower timeframe, price is coiling tight. Liquidity is building, stops are stacked, and it looks like a bear trap setup. A bullish push here could rip into overhead supply before the bigger trend resumes.
🎯 Trade Plan
Entry Zone: 2.6 – 2.7 support
TP1: 3.2
TP2: 3.4 – 3.5
SL: Below 2.45 (don’t hang around if it breaks)
This isn’t a macro reversal — just a counter-trend bounce play. Quick in, quick out. ⚡
What do you think?

Natural gas starts week higher on demand outlookNatural gas starts week higher on demand outlook
U.S. natural gas climbed to $3.2, supported by forecasts for above-normal temperatures later this month and steady LNG feedgas flows. Demand is expected to stay light for the next six days but rise in mid-September as heat returns.
Prices also gained on supply concerns amid Kinder Morgan pipeline repairs and the anticipated full restart of Freeport LNG. Forecasts for warmer weather across the eastern and southern U.S. added further support.
Despite strong production near record highs, storage remains 2.2% below last year but 5.6% above the five-year average.

NATURAL Gas short
Sell Limit Entry: 3.069
SL 3.133
TP 3.005
Valuation versus USD index and U.S Bond is overvalued. I expect a drop soon.

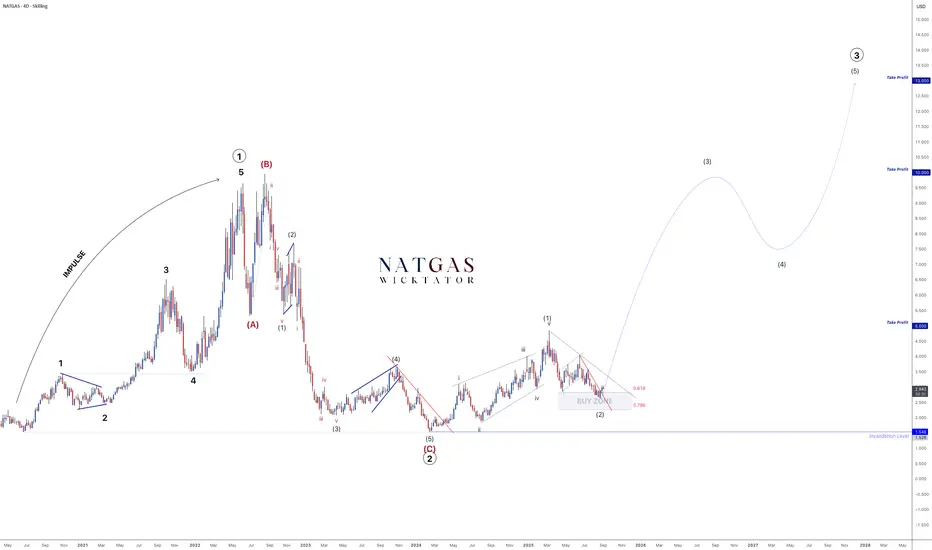
NATGAS – Wave 3 Impulse Confirmed. Multi-Year Rally Started!Our roadmap has played out with precision.
Wave 2 correction is complete, price tapped the buy zone, and the entry is now active.
We’re in the early stages of Wave 3 - historically the strongest and longest Elliott Wave.
🎯 Targets remain:
TP1: 5
TP2: 10
TP3: 13
The impulse has begun - now it’s about riding the wave.
Plan the trade. Trade the plan.
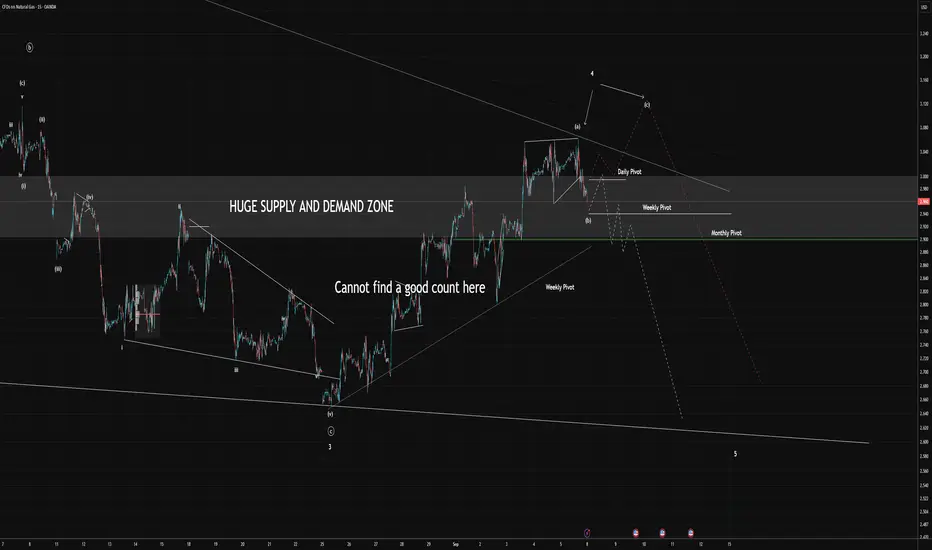
Natural Gas: Ambiguous Wave 4, Key Scenarios for Next WeekNatural Gas could have already completed its 4th wave, or it might extend further. The rally from the low of wave 3 is particularly challenging to count. I spent an hour on it but still couldn't find a clear and reliable wave interpretation.
However, given the low probability of correctly counting any single wave and the highly subjective and variable nature of this method, it's not the most critical thing.
What is important is to focus on the confluence of patterns and wave counts across different timeframes, avoid going against the momentum indicators, and always factor in key reversal points.
It's based on these reversal points that I've built out my approximate scenarios for the start of next week.
LNG in Week 36: Wind Generation Exacerbates Gas Storage SurplusCurrent prices vs. price spread 10 days before expiration by month since 2010
The NGV25 near contract is trading around the median figure but showing high volatility. The next contract, NGX25, as well as the winter 2026 contracts, show moderate contango, but their prices remain within the interquantile range.
Current forward curve vs. 2020-2025
The forward curve shape remains stable and is approaching the configuration of the curves for the same calendar day in 2023 and 2024. This is particularly evident for contracts with delivery dates three years or more in the future. The differences in the short dated contracts are still significant.
Current inventory and forecast for next week compared to 2019-2024
For week 35 (Aug. 25-31), storage inventories are forecast to increase by +68 BCF. Fill rates are consistently above the median for the past five years. Injection rates remain positive due to high production and low consumption, mitigating shortage risks ahead of the withdrawal season.
Weekly HDD+CDD total from current NOAA data and forecast for the next two weeks comparing 1994-2024
In the continent as a whole, in the 36th week of this year, the weather in terms of HDD+CDD is significantly below the average for the last 30 years of observations. In the next week, week 37, HDD+CDD is also forecast to be well below average, leading to lower demand for AC power and increasing downward pressure on prices.
Explanation of the chart: candles represent quantiles for 30 years from 1994 to 2024. Red dots 2024, green 2025, blue prediction 2025
Weekly HDD+CDD total from current NOAA data and forecast for the next two weeks compared to 1994-2024 by region
The projections for the major regions are consistent with the general trend: HDD+CDD rates are below the average of the last 30 years of observations.
Weekly cumulative supply/demand differentials compared to 2014-2024
The supply-demand balance has narrowed below the decade average. Production has been generally declining and is projected to keep declining. Imports from Canada, exports to Mexico, and LNG supply remain stable, however. Electricity demand has declined due to seasonal factors and warmer weather, while industrial sector demand remains at average levels.
Meanwhile, wind generation increased for this period between 2024 and 2025 by a factor of 4, according to MISO grid operator, from 58,487 Mwh in 2024 to 239,952 Mwh in 2025.
According to PJM grid operator the metric rose by a factor of 2 from 3,312 Mwh in 2024 to 70,070 Mwh in 2025, respectively. This compensated some of the gas consumed, thereby exacerbating the gas storage surplus.
So we are now heading for a 150 unit surplus relative to the 5 year median. Importantly, without lowering the production, new risks are emerging pointing to entering the zone of new considerable gas storage excess capacities, thus putting additional downward price pressure.
Seasonally, September is considered one of the quietest months, when air conditioning is not so active and heating is not yet on. Thus, before the start of the pumping season storages accumulate enough surplus volumes. With the data we have now, there is every reason to expect the start of the season to be 200+ surplus, relative to the average.
U.S. Natural Gas holds near 4-week highU.S. Natural Gas holds near 4-week high as storage builds match forecasts
U.S. natural gas stayed near a four-week high Thursday after EIA data showed inventories rose by 55 Bcf to 3,272 Bcf for the week ending Aug. 29, in line with expectations. Stocks remain 2.2% below last year but 5.6% above the five-year average, signaling ample supply despite record LNG exports and strong demand.
Higher production, with dry gas output at 107.1 Bcf/day, continues to pressure prices, while weather forecasts calling for warmer temperatures in mid-September may support short-term demand. LNG flows hit 15 Bcf/day, near record highs, as U.S. exports remain strong amid European and Asian demand.

Natural Gas Surging into Key Moving AverageNatural gas has tagged near term resistance.
We have trimmed and locked in profits on many of the equity trades and the boil trade that we were long.
The entire commodity complex minus oil has been very strong.
Inventory report is tomorrow at 10:30am.
Let see if Nat gas can continue its bullish ascent.
Dont forget to trim profits along the way.

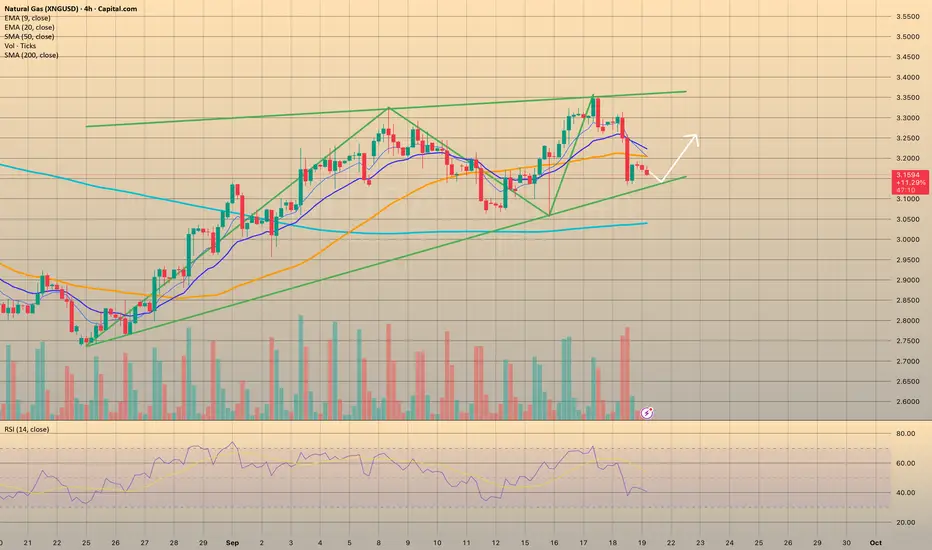
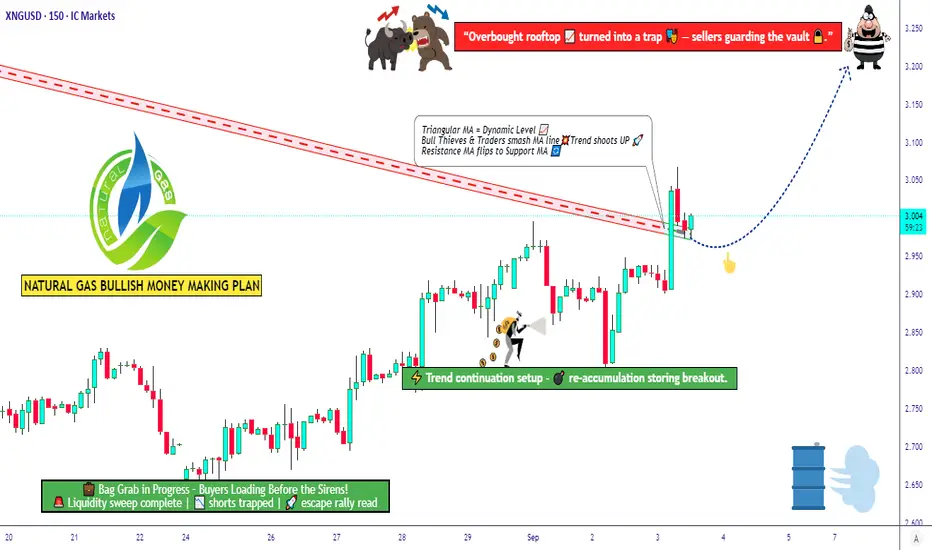
Natural Gas Market Outlook ‖ Bullish Breakout with Risk Control💎 XNG/USD Natural Gas – Thief Trader’s Money Loot Plan (Swing/Scalping) 💎
🎯 Trade Plan (Bullish Setup)
Strategy: Bullish triangular moving average breakout, aligned with Fibonacci 0.382 level.
Entry (Layered Style): Using multiple limit orders (Thief layering strategy). Example entries:
$2.900
$2.950
$3.000
(You may add more layers depending on your risk appetite.)
Stop Loss: $2.800 (Thief SL).
⚠️ Note: Adjust SL based on your own risk tolerance and strategy.
Target Zone: Major seller pressure expected near $3.400 — our escape target set at $3.200.
📌 Reminder: Take profit at your own discretion — you control your loot, not me.
❓ Why This Setup?
✅ Technical Basis: Bullish triangle breakout + Fibonacci 0.382 retracement signals continuation upside.
✅ Layered Entry Advantage: Reduces risk by scaling in across levels, catching volatility without FOMO.
✅ Market Structure: Current consolidation near $2.93 provides a solid base for accumulation.
✅ Sentiment Balance: Both retail & institutional lean bullish, supporting potential breakout momentum.
✅ Macro Tailwinds: Strong LNG export growth and expected winter heating demand underpin the long thesis.
This plan aligns both short-term technicals and long-term fundamentals, creating a high-probability swing/scalping opportunity.
🌟 Natural Gas (XNG/USD) Market Report - September 3, 2025 🌟
📊 Current Price Snapshot
Spot Price: $2.93 per MMBtu (Henry Hub benchmark) 📉
(Holding steady after recent dips, reflecting balanced supply/demand.)
😊 Trader Sentiment Outlook
Retail Traders: 55% Bullish 🟢 | 35% Bearish 🔴 | 10% Neutral ⚪
(Optimism from LNG demand + weather, but some concern on inventories.)
Institutional Traders: 60% Bullish 🟢 | 30% Bearish 🔴 | 10% Neutral ⚪
(Focused on exports & production stability, while cautious on oversupply.)
📌 Overall Mood: Mildly positive — upside potential if weather demand rises.
😨 Fear & Greed Index
Current Level: Neutral (Score ~50/100) ⚖️
Fear factors: Storage 5% above 5-year avg, mild summer demand.
Greed drivers: LNG exports + winter demand expectations.
Market vibe = balanced — neither panic selling nor euphoric buying.
📈 Fundamental & Macro Score
Fundamental Score: 7/10 🟢
Strong LNG shipments (31% growth expected).
Inventories manageable, production +3% YoY.
Key watch: Permian & Haynesville supply shifts.
Macro Score: 8/10 🟢
Rising global energy needs (AI, data centers).
Autumn cooling trend boosts heating demand.
Asia’s growth keeps exports flowing.
🚀 Overall Market Outlook
Bias: Bullish (Long) 🟢📈 — ~60% confidence.
Natural gas could push toward $3.60/MMBtu by late 2025 if balances tighten and exports expand.
Winter could spark extra upside rallies ❄️🔥.
🔗 Related Pairs to Watch
FXOPEN:XNGUSD
NYMEX:NG1!
ICMARKETS:XBRUSD (Brent Crude)
FOREXCOM:USOIL (WTI Crude Oil)
OANDA:XAUUSD (Gold for risk hedge)
TVC:DXY (US Dollar Index – inverse correlation play)
✨ “If you find value in my analysis, a 👍 and 🚀 boost is much appreciated — it helps me share more setups with the community!”
#XNGUSD #NaturalGas #SwingTrading #Scalping #CommodityTrading #EnergyMarkets #Fibonacci #BreakoutStrategy #LayeringStrategy #TradingViewAnalysis #ThiefTrader
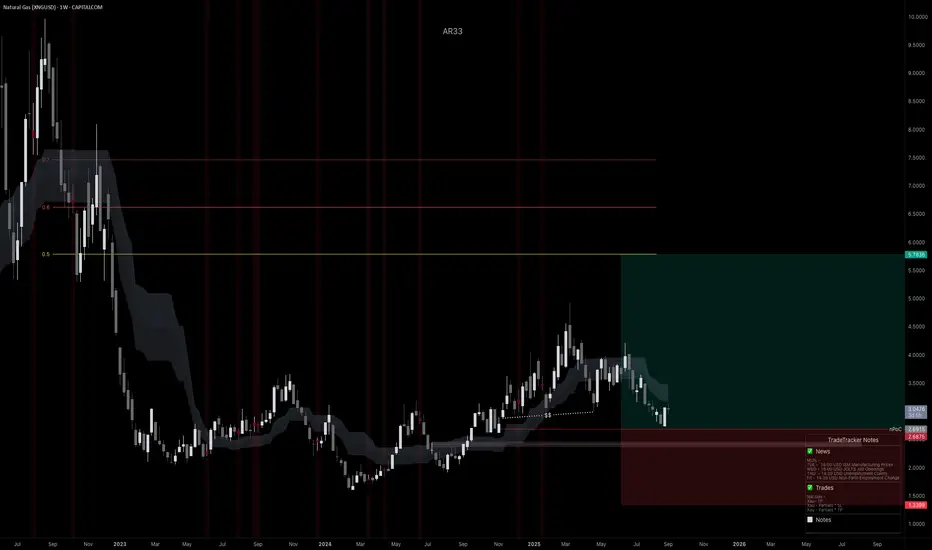
XNGUSD, Accumulation to Expansion? Weekly Long Into Winter RiskI’ve initiated a long on Natural Gas from weekly structure. Price has rotated inside this area since ’23 and is now reacting at a confluence of trendline support + prior demand. The plan is to hold into Q4, when seasonality (heating demand + potential hurricane/LNG disruptions) often provides upside tailwinds. Risk is defined on the weekly chart; I’ll manage around swings and let the position work.
Technicals (Weekly)
• Range base reclaimed: Price is bouncing from the same 2023–2024 accumulation zone (roughly 2.5–3.0).
• Multi-touch trendline support: Current candle is reacting at the rising base trendline; wicks show responsive buying.
• Structure targets: First objective is a move back into mid-range supply; extension aims toward the upper band shown on the chart.
Fundamentals Supporting Long Bias
• Seasonality: Q4 typically brings rising Heating Degree Days across the Northern Hemisphere; winter risk premia often get priced ahead of the draw season.
• LNG pull: Ongoing ramp in global LNG demand + incremental U.S. export capacity tends to tighten the domestic balance on cold forecasts or unplanned outages elsewhere.
• Supply discipline: Gas rig counts have lagged after the 2024 price slump; that slower supply response can tighten later-year balances if weather cooperates.
• Weather & Gulf risk: Peak hurricane season can interrupt Gulf production and processing, periodically supporting price.
• Europe draw season: As EU storage transitions from injection to draws, import needs rise, keeping a bid under seaborne gas.
Trade Plan:
• Entry: From weekly support (see chart).
• Management: Trail below fresh higher lows on the daily; take partials at fib/structure levels; let a runner target the upper band if momentum broadens.
What Breaks the Thesis
• A persistently warm Q4, outsized storage overhang into winter, major LNG outages/delays, or a renewed surge in production that swamps demand.
Note: Please remember to adjust this trade idea according to your individual trading conditions, including position size, broker-specific price variations, and any relevant external factors. Every trader’s situation is unique, so it’s crucial to tailor your approach to your own risk tolerance and market environment.