Historical Trend of NGNG prices goes low in every leap year, According to weekly chart the next low would be 1.4$
NATURALGAS trade ideas

NATURAL GAS...BURN BABY BURN!Nat gas continues to show some short term weakness.
Its now shaping up based off an RSI divergence that Nat gas could make new lows.
The fact that we had a bearish crossover of the 7 MA & 20 MA is never a good sign.
Sellers clearly took control over price and forced it back below the neckline.
The 100% downside move of the head & shoulders that triggered over a year ago is about $0.70

GAS is almost ready for the next moveEurope is full with gas, and the winter is soft, and blah blah blah.
Let's see through technical glasses, 0.886 level is strong level, I expect that gas will reach it, mot probably even brake it, and afterwards we seek for golden pocket and 0.5 fib.
Support and resistance, baby!

Natural gas bottom in? Producer PPI came in at 2x anticipated!Here we see a higher low with a bullish engulfing at historic lows, with the catalyst of The Producer Price Index coming in at twice of what was anticipated. It would be nice to let the day close as an engulfing, though I am in pre-emptively. I have honestly no idea at this point where I intend to exit as I think this low may be in for quite some time, we shall see. Stop loss can be set below swing low or even todays low dependant on your risk tolerance and margin. We can also note that the momentum reversal indicator is about to turn into further positive territory.

Natural Gass PredictionsLooking for potential pivot points at the shapes. I marked some examples from the past. I have an interest in the marked date of 1 Feb '24 (Red Star) and another big event that might happen on this drawing. I am also interested to see if the market goes out of the boundaries marked at 1.45 and 3.666.

NaturalGAS RSI positive divergenceHourly, daily and 15 minute chart frame shows positive RSI divergence Wait for the reversal!


Natural gas LongNat gas forming reversal pattern, with prices at all time low we could find an opportunity for long term investment

Natural Gas LONG TERM TRADE analysisHello Traders
In This Chart NATGAS HOURLY Forex Forecast By FOREX PLANET
today NATGAS analysis 👆
🟢This Chart includes_ (NATGAS market update)
🟢What is The Next Opportunity on NATGAS Market
🟢how to Enter to the Valid Entry With Assurance Profit
This CHART is For Trader's that Want to Improve Their Technical Analysis Skills and Their Trading By Understanding How To Analyze The Market Using Multiple Timeframes and Understanding The Bigger Picture on the Charts

Inverse relation of Bitcoin and Natural Gas!The top of Gas marks the bottom in bictoin, the bottom in gas marks the top in bitcoin.
HINT : Gas has reached flat bottom and about to boom imo.

Gas touches its lowest level = long-term bullish marketGreetings
Dear analysts and traders,
I hope you are doing well and are motivated for the week ahead. I wish you all the success in your business endeavors. Remember that success in trading lies in consistently defining and sticking to your rules.
As someone interested in the Elliott Wave Principle, I find it to be an invaluable tool for market analysis. I have developed my approach by combining this principle with my personal experience and by considering different scenarios that are likely to occur in the market. It should be noted that I do not like to be surprised in the market, and that's why I have different market prospects. I follow them to be sure and recognize the structure that is forming so that I can 100% recognize it.
I will share my analysis with you, but please note that I am not providing any buy or sell signals. My perspective on idea analysis is completely unbiased, so if the idea analysis meets your standards, you can use it as a guide to make an informed decision.
I have attached my previous analysis of the same market so that you can compare and see the differences. All the details of my analysis are clearly labeled, making it easy for you to understand. However, having a basic familiarity with the Elliott Wave Principle theory will help you understand the analytical idea more easily.
I have been studying the Elliott Wave Principle for almost three years now, and over time, my understanding of this knowledge and experience has grown. What I have achieved so far is the legacy of a genius called Ralph Nelson Eliot, and I am really happy with my progress. May peace be upon him.
Thank you for your support so far. I will always remember your kindness. Please share your comments and criticisms with me.
I hope my analysis will be useful to you in your business journey, and I wish you all the best.
Sincerely,
Mr. Nobody

My setup for Natural gas I can see 1.6 very soon on NG.. Will see..
For the past 1 week I can see some declines happening around in the price.

Natural Gas - will you be burned this week? Natural gas looking for a make or break move this week.
Were at an inflection support level where the bulls need to defend price or run the risk for new lows.
Natural Gas resource stocks showing great signs of strength and accumulation.

US Natutal Gas - Bullish BiasUS Natural Gas is in buy position,as on Daily time frame making a bullish divergence and just taking support from 0.5 Fib level.
Targets should be very next resistance which is 2.121 to 2.219.

#Natgas Update#Natgas returns to the previous scenario, in which wave (ii) is complete. Expect a rapid increase from these levels.

Natgas Uodate#Natgas looks solid. Although wave (ii) required relabeling and repositioning, the combination of the leading diagonal in presumed wave (i), moving averages support, and oversold RSI seemed encouraging.

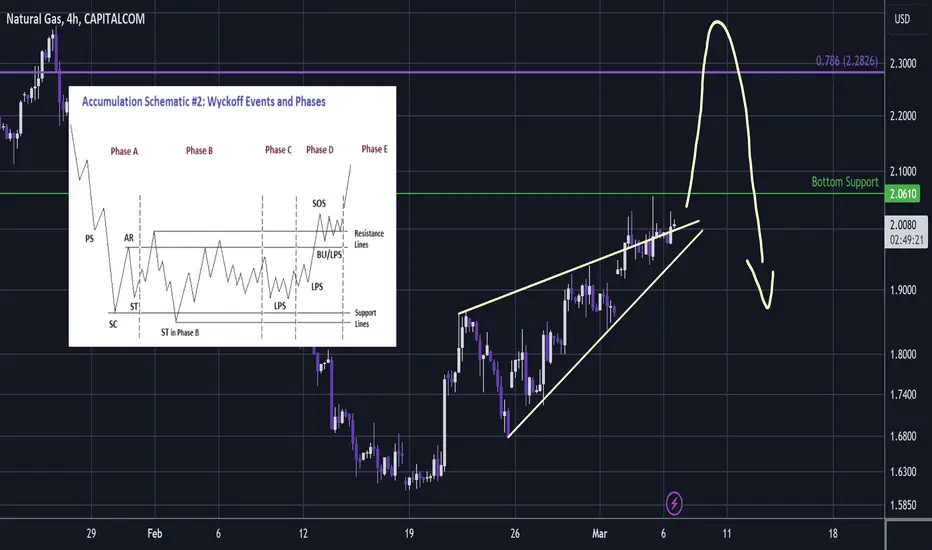
NATURALGAS - Pump Then Dump 🤔NATURALGAS
This is perhaps now the only major asset that we cover that I think perhaps is yet to bottom.
But it looks like it is setting up for a pump.
Ascending wedges are generally bearish but Nat Gas is so wild that it will often pump hard first before dumping down and down.
This is a difficult call but I think that we have not yet seen Wyckoff ST Secondary Test to re-test the low and perhaps hit my lower target on Nat Gas Futures 👍.
Expected bullish Cyclical Behaviour of Natural GasExpected bullish trend found on the basis of bullish divergence in cyclical behavior.

#Natgas update#Natgas looks to be favouring the blue scenario posted previously. The price now needs to pullback to form wave (ii) before next rally.

Natgas . Long-term idea. Risk reward is great !I start to buy some options with 2 year expiration
They are hot right now
Even on Friday when gas dropped a little bit - I saw a big demand for 2026 options
Start from small position right here
Not a spec idea, very long-term,
For people which will not close an position after 5% drop XD

Natural Gas: Has the short squeeze begun?Natural gas saw a massive bullish gap up to start the week.
Our members secured and trimmed some long positions while still keeping majority of shares on the table.
We remain long and bullish. We believe pullback can be bought.

Natgas Bears are slowing downNatgas, with my speedlines contracting I anticipate a slowdown in bearish momentum. Will wait for more price sessions and price to intersect either resistance or support lines before taking any trading decision.

2nd Entry NAT GAS longXNG has completed 3 corrective waves on M30. Will be adding new long positions start of week. Let me know if you have any questions.
