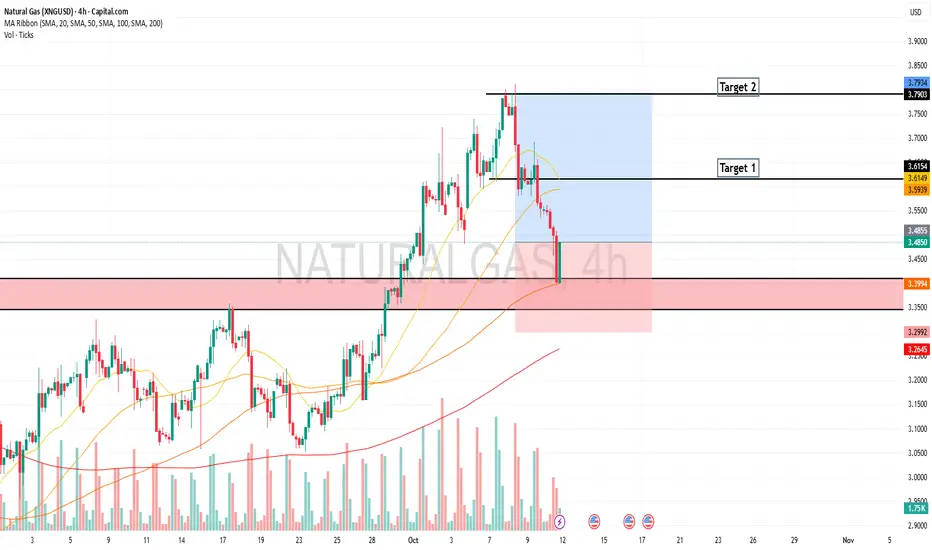
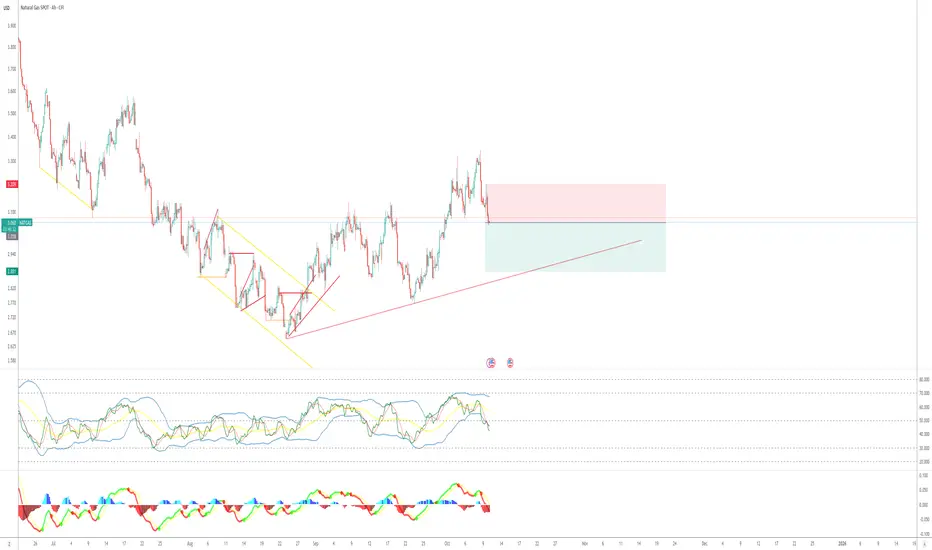
NATGAS Short (A+)Natgas has touched the supply zone within the channel, in a longterm down trend. This provides a great opportunity to sell at the premium price range with a 1R sell market order, and 2R sell limit if it provides a reentry from a higher price.
Technical analysis aligns well with fundamental analysis for positive PMI news on Friday.
Trade ideas
Natural Gas - Horrific Inventory ReportToday Nat gas showed a greater than expected build in inventories.
The consensus was 78B vs 87B actual.
Nat Gas has now triggered a bearish hourly pattern that takes us lower. If we lose the 3.60 area you can be sure we are likely going to target the gap fill.
I'm watching for Natural gas to potentially end the week with a weekly topping tail.
This colder weather report could be a fakeout pump to shakeout shorts.

LNG Week 43: 92 BCF Storage Surge Signals Weather-Driven Shift*Due to the platform's features, the charts are arranged in sequence from left to right, from the first to the Eighth chart. The charts were created by our team and based on an analysis from Bloomberg and the EIA data. This analysis was conducted in cooperation with Anastasia Volkova, analyst of LSE.
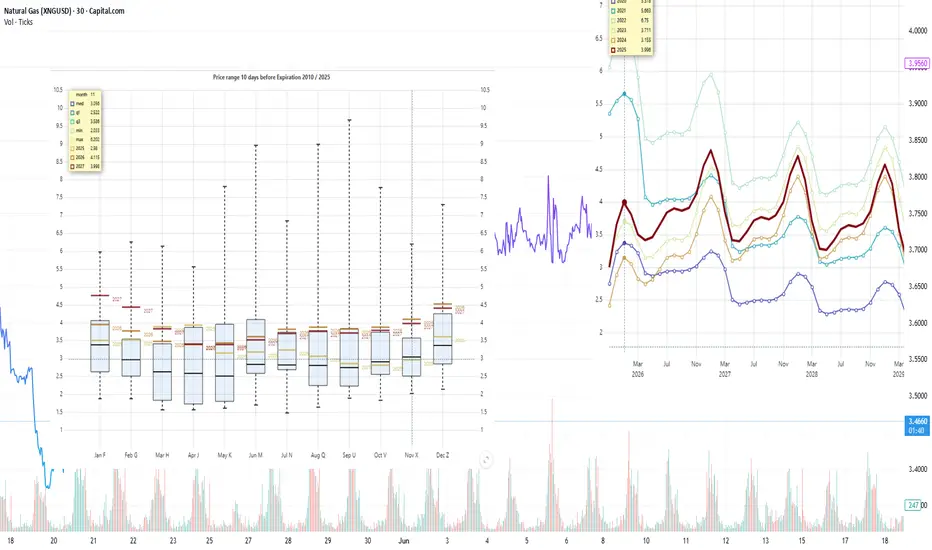
The natural gas market enters Week 43 with a robust storage uplift, as reserves are projected to rise 92 BCF during Week 42 (October 13-20), hitting 3,813 BCF-53 BCF above last year and well above the 5-year median of 74 BCF. The NGX25 contract swings to the upper end of the interquartile range with heightened volatility, while 2026 winter contracts stay above the range, fueled by growth momentum. Weather shifts, with HDD+CDD nearing 30-year averages and a 15-20 point uptick forecast, hint at rising demand. We analyze these trends below.
Current prices compared to price dispersion 10 days before expiration, by month since 2010
The NGX25 contract changed direction and is trading at the upper end of the IQR 10 days before expiration, demonstrating increased volatility. Quotes for 2026 winter contracts supported growth and remain above the upper limit of the interquartile range.
Forward curve compared to 2020-2025
The shape of the forward curve in 2025 shows a steady convergence and is even closer to the configurations recorded in 2023 and 2024 for comparable dates. This trend is particularly evident in contracts with delivery in three years or more, where prices are steadily converging towards historical levels.
Current stocks and forecast for next week compared to 2019-2024
According to the forecast for week 42 (October 13-20), gas reserves in underground storage facilities will increase by +92 BCF, reaching 3,813 BCF, which is 53 BCF higher than the figure for the same period last year. Last week's inventory growth was supported by high production volumes and mild weather conditions.
15-day sliding sum HDD+CDD based on current NOAA data and forecast for the next two weeks compared to 1994-2024
The current values of HDD+CDD accumulated over 15 days have reached the average range for 1994–2024. The forecast for the next two weeks suggests that the values will exceed the average by 15–20 points, which may be a significant driver of growth in the near-term contract.
Accumulated HDD+CDD for 15 days based on current NOAA data and forecast compared to 1994-2024 by region
The current values of HDD+CDD accumulated over 15 days are within the average range for 1994–2024. The forecast for the next two weeks suggests a departure from the current mild weather trend in all regions except WS CENTRAL, WN CENTRAL, MOUNTAIN, and PACIFIC.
Weekly total supply/demand difference compared to 2014-2024
This week, the difference between supply and demand in 2025 continues to be below the average values for 2014–2024, indicating weaker demand or excess supply.
Number of days for delivery from warehouses
The graph shows the number of days of supply from storage alone, based on current consumption levels. In the second half of October 2025, reserves will last for approximately 35 days, which is below the lower limit of the interquartile range. With such moderate reserves, even minor disruptions in production or spikes in demand could cause sharp price reactions, especially in late winter and early spring.
Anomalies in weather (HDD+CDD) and fundamental factors
Overall, fundamental factors and weather anomalies are within the expected range, with the exception of consumption in the residential and commercial sectors, caused by the start of the heating season.

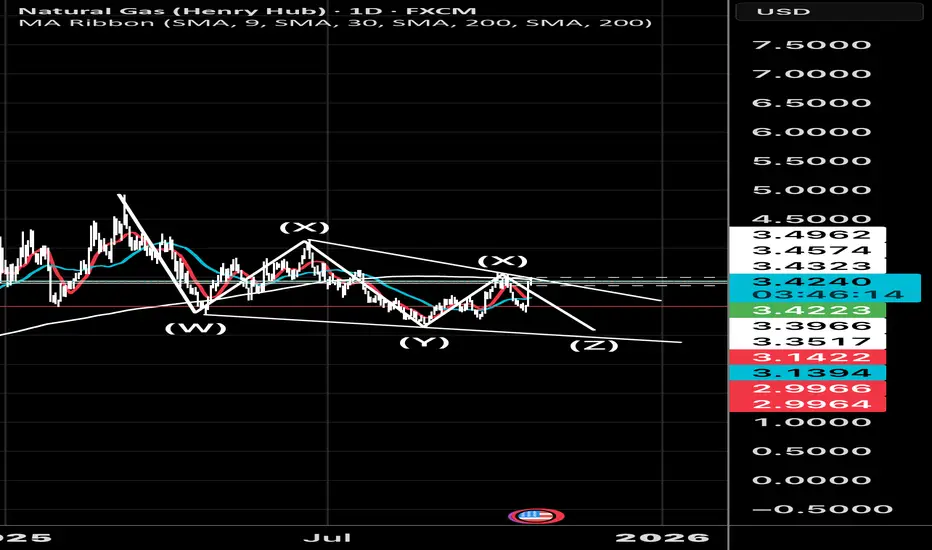
Triple zig zag for a double bottom ?Nat gas looks very much like a triple zig zag. With the last leg down to go. If it happens it looks like a great setup. 👌 let’s see if we fail here
Natural Gas Demolishes Shorts! Will The Move Hold?U.S. natural gas was up sharply today as some colder weather shows up in the temperature forecasts.
The fundamentals based off of previous inventories show slightly lower demand expectations.
This move could be a one off pop, it certainly needs to be reinforced by Thursdays inventory number to be able to sustain itself.
Natural Gas in one fells swoop has almost completed the upside 4 target.
Today we nibbled on an overnight shirt on Nat Gas by going long $KOLD.
This is just a day trade and I'm expecting to close it out withing 1-3 days.

The Natural Gas Will Jump from a Support LevelHello Traders
In This Chart Natural Gas HOURLY Forex Forecast By FOREX PLANET
today Natural Gas analysis 👆
🟢This Chart includes_ (Natural Gas market update)
🟢What is The Next Opportunity on Natural Gas Market
🟢how to Enter to the Valid Entry With Assurance Profit
This CHART is For Trader's that Want to Improve Their Technical Analysis Skills and Their Trading By Understanding How To Analyze The Market Using Multiple Timeframes and Understanding The Bigger Picture on the Charts

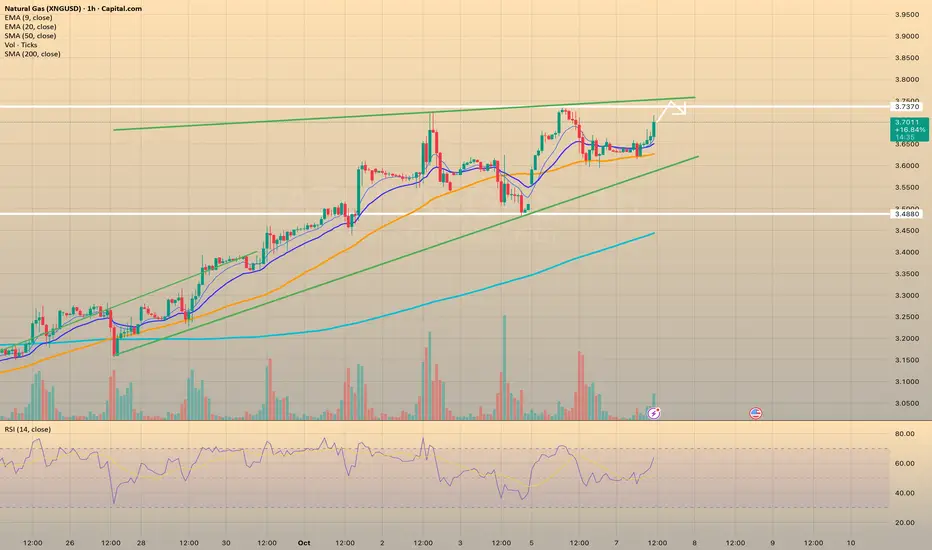
Heading to $4Still might chop next week, but the greater trend lines and fib retracement are saying we are going back up

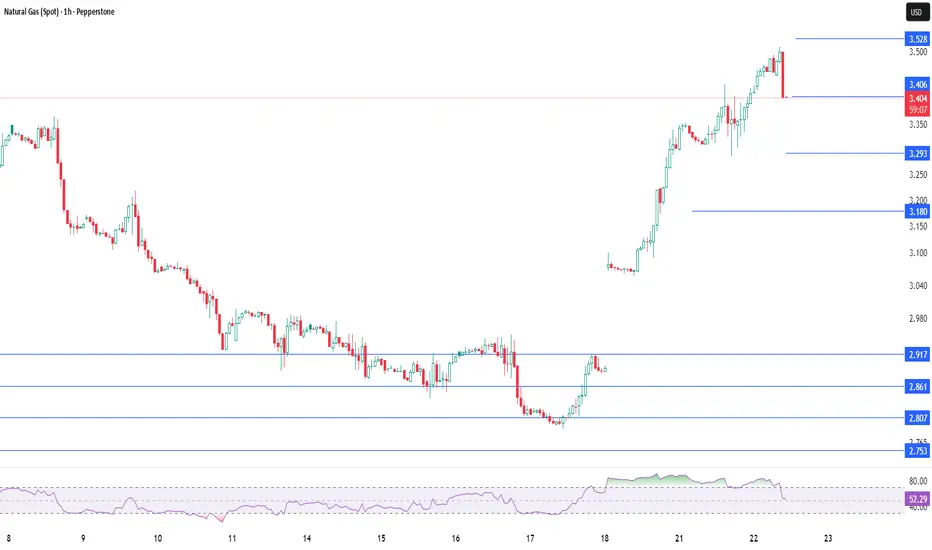
U.S. Natural Gas — mild weather weighs, trend stays bearishU.S. Natural Gas — mild weather weighs, trend stays bearish
U.S. natural gas fell for a third straight session as the latest EIA report showed an 80 Bcf build, leaving inventories 4.3% above the 5-year average. Analysts cite mild weather and an oversupplied market as key drivers.
Production remains near record highs at 107 Bcf/day (+3.8% YoY), while demand has dropped 6% YoY. Despite a slightly smaller-than-expected storage build, fundamentals stay weak.
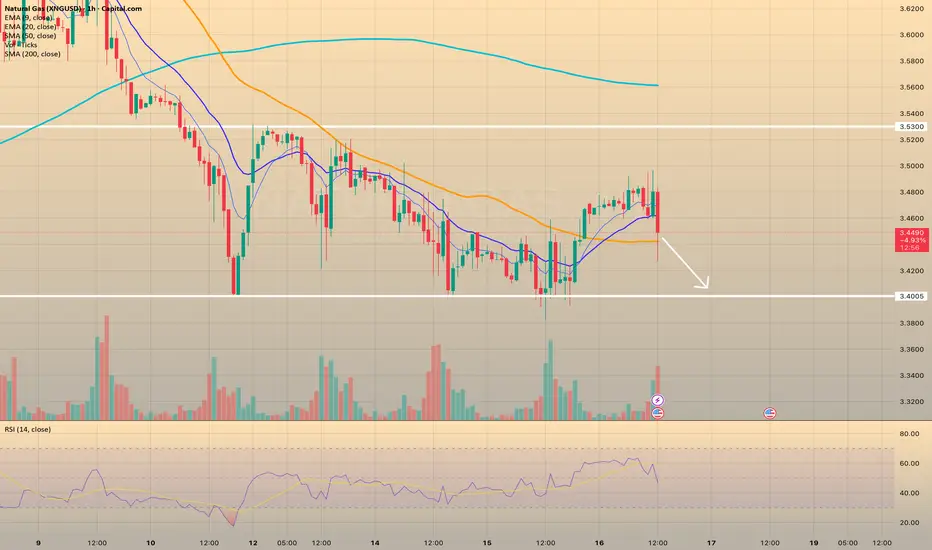
Technically, prices broke below local support at $3.40, confirming short-term bearish momentum. On October 17, natural gas prices bounced back, retracing part of Thursday’s losses. Temporary support emerged near $3.36–$3.35, but the recovery looks like a dead-cat bounce.
Scenarios:
🔻 Bearish (primary): Below $3.40–$3.42, downside targets remain $3.30–$3.25.
🔺 Bullish (alternative): Above $3.42, a rebound toward $3.50–$3.53 is possible, though momentum favors sellers.
In Europe, gas prices stay steady near €32/MWh with 83% storage capacity, while Russian attacks cutting Ukrainian output by ~60% add supply risks heading into winter.

Natural Gas Full Bear After Inventories!Natural GAs plummeted today on inventory report.
The consensus was for 76BCF build but came in higher at 80BCF build.
This demonstrates less demand and higher production.
The technical picture is slowly starting to breakdown for Nat Gas...the bulls need to do something quick to firm up price or we run the risk of the weekly downtrend taking hold.
next key area to watch will be a retest of the 3.30 zone.
Simultaneously you need to be monitoring inter market analysis (ie. watch Nat gas resource stock to see how their price action responds).
We booked profits on a small Boil long scalp today.

LNG Week 42: 87 BCF Storage Rise Meets Warm Weather Volatility*Due to the platform's features, the charts are arranged in sequence from left to right, from the first to the Eighth chart. The charts were created by our team and based on an analysis from Bloomberg and the EIA data.
Current prices compared to price dispersion 10 days before expiration by month since 2010
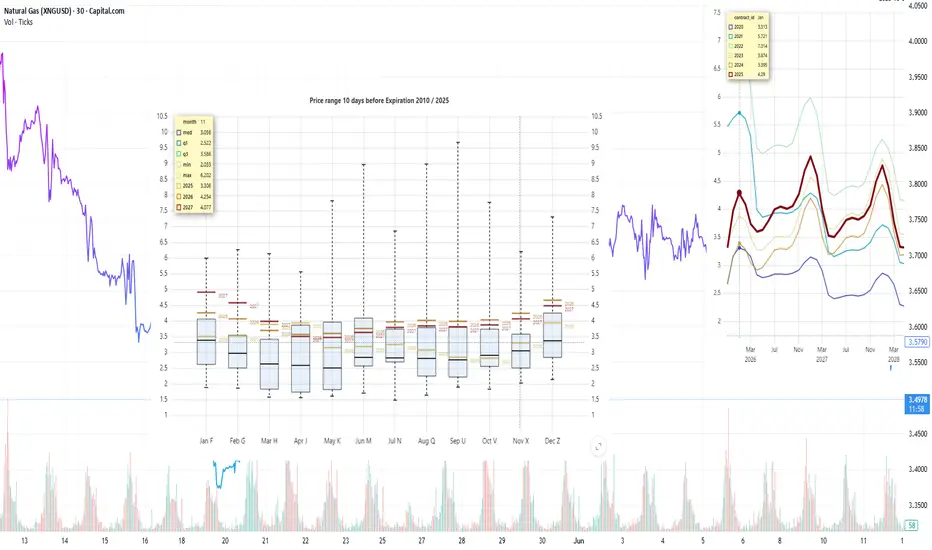
Due to warm weather and high production, the NGX25 contract is trading below its 10-day average and showing increased volatility during this period. Prices for 2026 winter contracts remain above the upper limit of the interquartile range.
Forward curve compared to 2020-2025
The shape of the forward curve in 2025 shows a steady convergence and is even closer to the configurations recorded in 2023 and 2024 for comparable dates. This trend is particularly evident in contracts with delivery in three years or more, where prices are steadily converging towards historical levels.
Current stocks and forecast for next week compared to 2019-2024
According to the forecast for week 41 (October 6-12), gas reserves in underground storage facilities will increase by +87 BCF, reaching 3728 BCF, which exceeds the figure for the same period last year. The growth in reserves is supported by high production volumes and mild weather conditions.
14-day sliding sum HDD+CDD based on current NOAA data and forecast for the next two weeks compared to 1994-2024
The HDD+CDD accumulated over 14 days for all regions remains below the historical averages for 1994–2024, and even taking into account the forecast for the next two weeks, no significant deviation from the current trend of mild weather is expected.
14-day sliding sum of HDD+CDD based on current NOAA data and forecast for the next two weeks compared to 1994-2024 by region
In all regions except WS CENTRAL and PACIFIC, the 14-day cumulative HDD+CDD remains below the historical average for 1994–2024, and the forecast for the next two weeks does not suggest a departure from the current mild weather trend.
Weekly total supply/demand difference compared to 2014-2024
This week, the difference between supply and demand in 2025 is below the average values for 2014–2024, indicating weaker demand or excess supply.
Number of days for delivery from warehouses
The graph shows the number of days of supply from storage facilities alone, based on current consumption levels. By early October 2025, reserves will last for approximately 35 days, which is below the lower limit of the interquartile range. With such moderate reserves, even minor disruptions in production or spikes in demand could cause sharp price reactions, especially in late winter and early spring.
Anomalies in weather (HDD+CDD) and fundamental factors
Overall, fundamental factors and weather anomalies are within the expected range, with no systemic deviations. We do not expect significant price deviations in the current expiration period unless there are radical changes in supply and demand due to weather, production, or export factors.
*This analysis was conducted in cooperation with Anastasia Volkova, analyst of LSE.
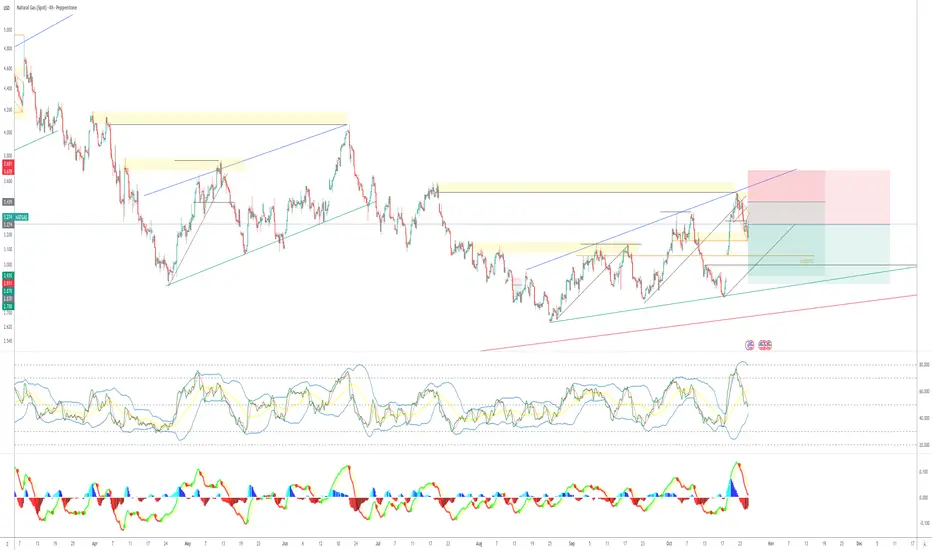
Natural Gas — Pressure persists, but a rebound setup buildNatural Gas (Nov)— Pressure persists, but a rebound setup build
Natural gas futures extended losses to a 3-week low, weighed down by forecasts for warmer-than-normal U.S. weather through late October. Atmospheric G2 expects above-average temperatures across most of the country between October 20–29, limiting heating demand and capping price recovery attempts.
📉 Fundamentals:
- U.S. (Lower 48) dry gas production: 108.5 bcf/day (+5.8% YoY)
- Demand: 71.3 bcf/day (-4.8% YoY)
- Storage levels: +4.5% above 5-year average, with inventories expected to rise +83 bcf this week (EIA consensus)
Active gas rigs: 120 (+2 w/w)
🔥 Geopolitical Context:
European gas futures climbed ~2% after Russian strikes on Ukraine’s gas infrastructure cut ~60% of national output, forcing shutdowns at DTEK and Naftogaz sites. The disruption raised supply concerns at the start of the heating season, with EU storage now at 83% capacity versus 93.2% last year.
📊 Technical Outlook:
Price is consolidating within the $3.40–$3.53 range, forming a short-term sideways channel. RSI is neutral near 44, and momentum remains weak. A break below $3.40 could trigger a slide toward $3.30, while a close above $3.53 may open the way to $3.60–$3.65.
Scenario Outlook
🔻 Bearish scenario (main):
A confirmed breakdown below $3.40 would expose $3.32–$3.30 as the next target zone.
Momentum indicators support potential continuation lower.
🔺 Bullish scenario (alternative):
If buyers reclaim $3.53, we could see a short-covering rally toward $3.60–$3.65, but resistance above remains heavy due to the 200 SMA ceiling.
Summary
Natural Gas remains range-bound but weak, with sentiment tilted bearish due to macro fundamentals (warm weather + ample storage).
Traders should watch for a decisive break of the $3.40–$3.53 zone to define the next directional move.
Natural Gas - Holding Daily SupportNat GAs is holding daily chart support.
The bulls today pierced the 200 MA but failed to close above it.
Inventories on Thursday will likely dictate whether we get the weekly chart downtrend to resume.
Nat gas has volatile price action as its stuck in 2 trend formations.
The daily remains in an uptrend but the weekly remains in a downtrend.
I'm waiting on the sideline until i get the right entry.

NG: Head shoulders on natural gasHello, dear traders!
What we have: head and shoulders on H4, divergence on H4, shooting star on the weekly timeframe.
Target - the nearest support level.

Profit Blueprint on XNG/USD! Is This the Bullish Energy Move?😎 Steal the Show with XNG/USD: The "Thief" Day Trade Blueprint! 🚨
Asset: XNG/USD (Natural Gas CFD) - Energies MarketVibe: A cheeky, calculated heist to snag profits with a slick Ichimoku breakout strategy! 💰
📜 The Master Plan: Ichimoku Kijun Line Breakout
🎯 Confirmed Bull Trend: The price has broken above the Ichimoku Kijun-Sen line, signaling a bullish move in the Natural Gas CFD market. This breakout is our green light to execute the "Thief Strategy" with precision!
🕵️♂️ Entry: The Thief’s Layered Approach
🔍 How It Works: The "Thief Strategy" uses a layering method with multiple buy limit orders to scale into the trade safely, protecting your capital while maximizing profit potential. No fear, just finesse! 😎
Buy Limit Layers:
🥉 2.960
🥈 2.980
🥇 3.000
🏆 3.020
💡 Pro Tip: Add more layers based on your risk appetite and account size for extra flexibility!
Alternative Entry: If you prefer a single entry, jump in at the current market price after the Kijun-Sen breakout confirmation. Your call, Thief OG! 😏
🛑 Stop Loss: Protect Your Loot!
🚨 Thief Stop Loss: Set at 2.900, just below the breakout level to guard against reversals.
Customize It: Adjust your stop loss based on your risk tolerance and strategy. This is your heist—own it!
Note: Dear Thief OG’s (Ladies & Gentlemen), I’m not dictating your stop loss. Manage your risk and keep your profits safe! 💪
🎯 Target: Escape Before the Trap!
🏃♂️ Profit Target: Aim for 3.150, where strong resistance, overbought conditions, and a potential trap await. Cash out before the "police" (market reversal) catch you!
Note: You’re the mastermind here. Take profits at your own discretion—don’t let me cap your gains! 💸
🔗 Correlation & Related Markets to Watch
Natural Gas (XNG/USD) often correlates or reacts with:
ICMARKETS:XBRUSD (Crude Oil Brent) – Energy sector movements can impact gas demand.
FOREXCOM:USOIL (Crude Oil WTI) – Supply/demand shocks in oil can spill into gas pricing.
OANDA:XAUUSD (Gold) – Inflation hedge & safe-haven flows can influence energy sentiment indirectly.
TVC:DXY (US Dollar Index) – A stronger/weaker dollar impacts commodity pricing.
SP:SPX (S&P 500 Index) – Risk-on/risk-off sentiment across markets.
Keeping an eye on these pairs helps confirm energy market momentum and macro sentiment.
Key Correlation Point: Natural Gas prices often lead or lag other energy markets due to supply/demand dynamics and seasonal factors. Confirm your trade with cross-asset analysis for a sharper edge! 📊
🧠 Why This Setup Rocks
Ichimoku Precision: The Kijun-Sen breakout is a reliable signal for short-term bullish momentum.
Layered Entry Safety: The Thief Strategy’s multiple limit orders spread risk and allow scaling without overcommitting.
Risk Management: Clear stop loss and target levels keep your heist disciplined and profitable.
Market Context: Energy markets are volatile, but this setup leverages technical confirmation to ride the wave. 🌊
✨ If you find value in my analysis, a 👍 and 🚀 boost is much appreciated — it helps me share more setups with the community!
#ThiefStrategy #XNGUSD #NaturalGas #Ichimoku #DayTrading #EnergyMarkets #TradingView

The Natural Gas Will Jump from a Support LevelHello Traders
In This Chart Natural Gas HOURLY Forex Forecast By FOREX PLANET
today Natural Gas analysis 👆
🟢This Chart includes_ (Natural Gas market update)
🟢What is The Next Opportunity on Natural Gas Market
🟢how to Enter to the Valid Entry With Assurance Profit
This CHART is For Trader's that Want to Improve Their Technical Analysis Skills and Their Trading By Understanding How To Analyze The Market Using Multiple Timeframes and Understanding The Bigger Picture on the Charts
LNG Week 41: 89 BCF Storage Surge Drives Mild Weather Trends*Due to the platform's features, the charts are arranged in sequence from left to right, from the first to the Eighth chart. The charts were created by our team and based on an analysis from Bloomberg and the EIA data.
Current prices compared to price dispersion 10 days before expiration by month since 2010
The NGX25 contract is trading above its 10-day average and showing increased volatility during this period. Quotes for 2026 winter contracts remain above the upper limit of the interquartile range.
Forward curve compared to 2020-2025
The shape of the forward curve in 2025 demonstrates stability and converges even more closely with the configurations recorded in 2023 and 2024 for comparable dates. This trend is particularly evident in contracts with delivery in three years or more, where prices are converging steadily toward historical levels.
Current stocks and forecast for next week compared to 2019-2024
According to the forecast for week 40 (September 29 – October 5), gas reserves in underground storage facilities will increase by +89 BCF, reaching 3,560 BCF, which exceeds the figure for the same period last year. The growth in reserves is supported by high production volumes and mild weather conditions.
Weekly HDD+CDD sum based on current NOAA data and forecast for the next two weeks compared to 1994-2024
In week 40 of this year, HDD+CDD indicators for the continental United States are still below the average values for the last 30 years of observations, but there has been a significant increase compared to last week's forecast, which is clearly visible in the graph for 2025. The forecast for week 41 also indicates that this trend will continue: a further decline in values relative to historical levels is expected, which may ease pressure on prices by increasing demand and energy prices.
Explanation of the graph: the candles represent quantiles for 30 years from 1994 to 2024. Red dots represent 2024, green dots represent 2025, and blue dots represent the 2025 forecast.
Weekly HDD+CDD sum based on current NOAA data and forecast for the next two weeks compared to 1994-2024 by region
A steady trend is observed in the leading regions: HDD+CDD values in 2025 remain below the historical averages for 1995–2024 in virtually all areas. The lag in indicators corresponds to the generally mild weather of the season and reduced energy demand for heating and cooling, which is recorded in all major regions, but there is an upward trend that has been growing from revision to revision over the last 6 days.
Weekly total supply/demand difference compared to 2014-2024
This week, the difference between supply and demand in 2025 is at the average for 2014–2024, but lower than in 2024.
Number of days of supply from storage facilities
The graph shows the number of days of supply from storage facilities alone, based on current consumption levels. In 2025, February–March reserves will be at 10–18 days, which is comparable to or slightly below average. From May to August, stocks will increase to 25–35 days, which is slightly below the 10-year average. By the beginning of October 2025, the number of days of consumption from stocks will increase to 35 days, which is at the lower end of the IQR. The moderate level of storage adequacy to meet current demand creates a fundamentally tighter market, where even moderate production disruptions or minor spikes in demand can cause disproportionate price reactions, especially in late winter and early spring.
Anomalies in weather (HDD+CDD) and fundamental factors
Overall, fundamental factors and weather anomalies are within the expected range, with no systemic deviations, except for isolated declines in LNG exports from 07-10 caused by technical work at the Sabine terminal.
*This analysis was conducted in cooperation with Anastasia Volkova, analyst of LSE.
natural gas second buying opportunitywe got a clear trendline breakout on nat gas ##
anticipating now second buy
lets goooo

NATGAS SHORT (A SETUP)A break of structure to the down side indicates a move targeting the bullish trend line. This move has happened before, and the break usually on Thu.
Natural Gas Pummeled on Inventories Natural gas saw continued heavy selling today off the inventory report.
Inventories came in at 80B which is 4Billion higher than the estimate.
This is showing a little bit less of demand pull.
The Weekly 200 MA was the technical rejection zone for Nat Gas.
We will be live trading Nat Gas tomorrow if we see another sell day in the commodity.
I'm watching for a liquidity sweep of the daily 200 MA.
Nat Gas Bulls need to defend the 20 MA at minimum.

Natural Gas - Epic Trade SetupNatural Gas is potentially setting up a blow off top move into its Thursday inventory report.
This chart pattern rally is looking very similar to what we saw last Thursday when Nat gas had a 6.6% range decline from the high pivot it made off of inventories.
If we get a blow off top move on Thursday through the 200 Week MA I will look to fade that move.
This will be a live trading scalp idea...not financial advice.
Right now the swing trading trend is still bullish and looking strong.
Dip buyers are still in a favorable position for this commodity.

Gas prices surge on cold forecastsGas prices surge on cold forecasts
On Oct 7 european natural gas jumped to a six-week high, extending a sharp rally as colder weather forecasts and weaker renewable output boosted heating demand expectations. Temperatures in France and Germany are set to fall about 2°C below seasonal norms from mid-October.
The market also reacted to Russia’s largest missile strikes on Ukraine’s gas infrastructure since the war began, heightening concerns over potential supply disruptions. Despite the risks, EU storage remains robust at 82.8% of capacity, with Italy at 93%, France at 92%, and Germany at 76.3%.
In the UK, gas futures climbed also as the Met Office warned of a sharp temperature drop ahead, likely lifting heating demand. Analysts noted that if damage to Ukrainian facilities proves significant, Europe may need to increase pipeline and LNG imports to stabilize supply.
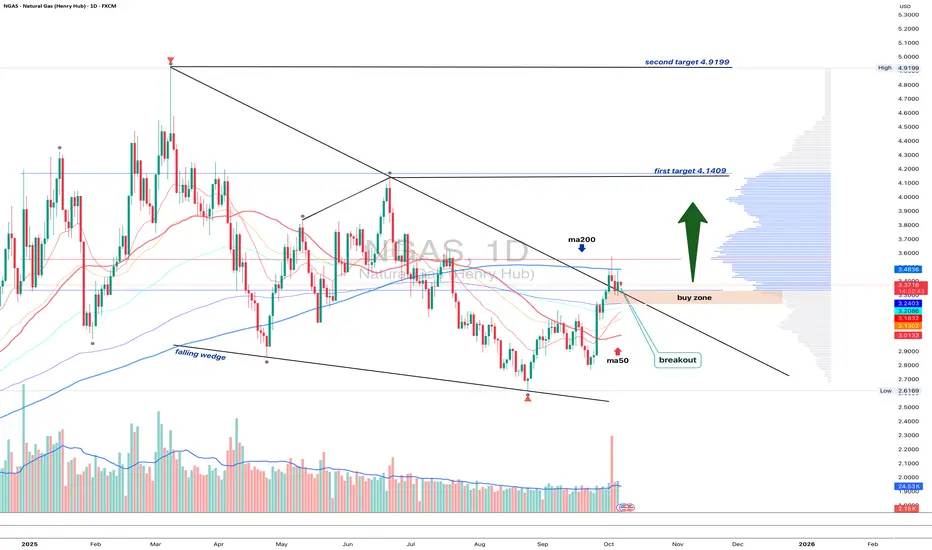
NGAS 1D - bulls waiting for the green lightOn the daily chart, Natural Gas has broken out of a falling wedge, but price remains below the MA200, while EMA still hovers above it - a mixed signal showing short-term hesitation within a longer-term downtrend.
The 3.10–3.20 buy zone remains key - that’s where the retest area aligns with short-term support. If buyers can reclaim the EMA and push above the MA200, the next upside targets are 4.14 and then 4.92.
Volume on the breakout supports growing bullish interest, while fundamentals - like rising seasonal demand - may soon add more fuel to the move.
Tactically , watch how price behaves near MA200. Once EMA flips back on top, momentum could accelerate fast. Until then, the market’s like a gas burner waiting for that click - ignition pending