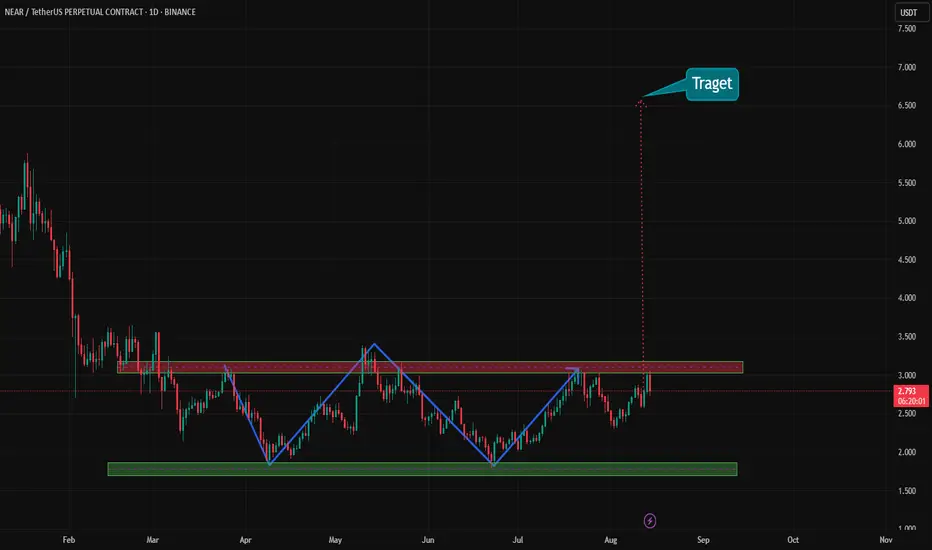
NEAR’s Biggest Move of 2025 Incoming?NEAR has been consolidating for months, carving out a textbook accumulation phase within the broader descending channel. Each previous cycle bottom (marked in red) has acted as a launchpad, and price is once again aligning with the cycle rhythm.
As long as the $2.5 – $2.7 demand zone holds, NEAR remains well-positioned for a potential breakout. A clean push above the short-term descending structure could ignite the impulse leg toward the $5.5 – $6.5 zone, where the next projected cycle top lies.
📌 Key Takeaways:
Structure: Price is respecting the descending channel with repetitive cycle bottoms and tops.
Accumulation: Sideways action suggests smart money is loading up.
Impulse Potential: Breakout could trigger a strong rally into the next resistance zone.
Invalid Level: A daily close back below $2.5 would put the bullish scenario on hold.
Patience is key here ⏳—waiting for confirmation above structure ensures we catch the move, not the noise.
⚠️ Disclaimer: This is not financial advice. Always do your own research and manage risk properly.
📚 Always follow your trading plan regarding entry, risk management, and trade management.
Good luck!
All Strategies Are Good; If Managed Properly!
~Richard Nasr
NEARUSDT.5S trade ideas

NEAR - Bullish structure - medium termCBOE:NEAR - Market Outlook
🔸Medium-term bias: Bullish 📈
🔸Short-term: Neutral
Big resistance area: $2.750 - $2.800
If CBOE:NEAR continues to hold above the $2.60 support, I expect to see a new bullish wave, targeting the $3.00, $3.10 resistance zone, or potentially higher!
Key supports to watch:
$2.55
$2.60
$2.48
It’s safer to wait for a clear move or a retest of lower demand zones if price isn’t ready to break out just yet. Patience can offer better entries!

NEARUSDT 1D#NEAR has formed a symmetrical triangle on the daily chart and is currently holding above the daily SMA200, which is a positive sign. If it breaks out above the triangle resistance, the potential targets are:
🎯 $3.322
🎯 $3.795
🎯 $4.267
🎯 $4.939
🎯 $5.796
⚠️ Always remember to use a tight stop-loss and follow proper risk management.

#NEAR/USDT – Between Bullish Reversal or Bearish Continuation #NEAR
The price is moving within a descending channel on the 1-hour frame, adhering well to it, and is heading for a strong breakout and retest.
We have a bearish trend on the RSI indicator that is about to be broken and retested, which supports the upward breakout.
There is a major support area in green at 2.70, representing a strong support point.
For inquiries, please leave a comment.
We are in a consolidation trend above the 100 Moving Average.
Entry price: 2.73
First target: 2.75
Second target: 2.80
Third target: 2.83
Don't forget a simple matter: capital management.
When you reach the first target, save some money and then change your stop-loss order to an entry order.
For inquiries, please leave a comment.
Thank you.

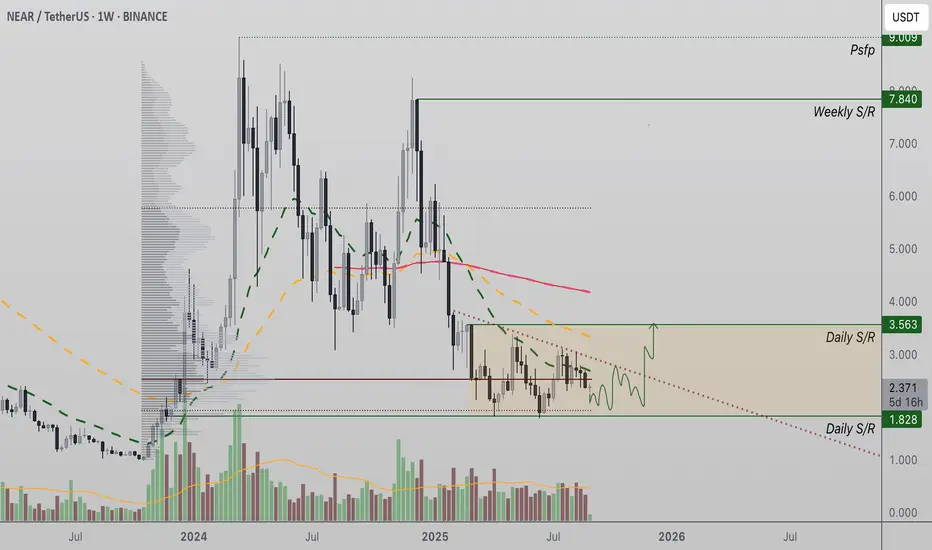
NEAR Protocol Price Coils in Equilibrium, Breakout Toward $7.80 NEAR Protocol is consolidating within an apex structure of higher lows and lower highs. A decisive break of $3.50 resistance with volume could fuel a bullish rotation toward $7.80.
NEAR Protocol is approaching a critical moment on the charts as price action tightens into a converging equilibrium. With both lower highs and higher lows forming, the market has created an apex zone where a breakout will eventually materialize. Support is currently holding at $1.80, while resistance at $3.50 stands as the major barrier before any significant continuation higher.
NEAR Protocol (NEAR) Key Technical Points
- Support at $1.80: The key level that maintains the integrity of bullish structure.
- Resistance at $3.50: A breach here could trigger a breakout from equilibrium.
- Upside Target at $7.80: The next rotational objective if resistance is cleared.
NEAR Protocol has spent the past sessions in a prolonged consolidation phase, forming a classic equilibrium of lower highs and higher lows. This compression of price action highlights the market’s indecision, but also builds the conditions for volatility expansion once either support or resistance is broken.
The $1.80 level remains the most important support in this structure. Each retest of this zone has attracted buying demand, preventing a breakdown and maintaining bullish potential within the broader market structure. On the other hand, the $3.50 resistance level has acted as a dynamic ceiling, rejecting price multiple times. A confirmed breakout here would signal the end of equilibrium and the start of a bullish rotation.
The volume profile provides further insight. Current trading shows average levels of participation, insufficient for a sustained breakout in either direction. For NEAR to rotate toward $7.80, an influx of bullish volume is required, ideally with strong continuation after the breakout. Without this confirmation, false moves and quick rejections remain a risk.
Market structure suggests that once the $3.50 resistance is broken on convincing volume, the probability of a continuation move toward the $7.80 level increases significantly. This target aligns with historical resistance levels and fits within the broader rotational framework of NEAR’s chart.
What to Expect in the Coming Price Action
As long as NEAR Protocol holds above $1.80 support, the equilibrium structure remains intact and biased toward a bullish resolution. Traders should watch closely for a breakout above $3.50, backed by significant volume influx, as this would likely confirm momentum toward $7.80. Until then, price may continue to compress within the apex zone before making a decisive move.
NEAR USDTon 1 hors time frame after choch it's on demand zone
and lower time frame it choch is formed on 5 mintures time frame so taking long psotiion with 1 percen risk.

NEAR/USDT – Between Bullish Reversal or Bearish Continuation?NEAR Protocol (NEAR/USDT) is currently trading at a very decisive point. The chart is showing a clear Descending Triangle pattern: sellers keep pressing the price lower with a series of lower highs, while buyers are defending a strong support zone around 2.325–2.460 (Fibonacci 0.618–0.5).
This is a make-or-break level: NEAR is either preparing for a major bullish reversal, or a breakdown that could extend the bearish trend.
---
🔹 Pattern & Structure Analysis
Main pattern: Descending Triangle (generally bearish, but a breakout above can flip the bias to bullish).
Key Support Zone: 2.325 – 2.460 (Fibo confluence).
Trendline Resistance: descending yellow line that has capped prices for months.
Key Levels to watch:
Critical Support: 2.325 – 2.460
Major Support: 1.793 (previous low)
Resistances: 2.676 → 3.010 → 3.570
Higher Resistances: 4.873 → 6.00 → 6.96 → 8.04
---
📈 Bullish Scenario
Trigger: Daily close above the descending trendline + a clear break of 2.676.
Stronger confirmation: breakout and hold above 3.010.
Upside targets:
Target 1: 3.010
Target 2: 3.570
Extended: 4.873 – 6.00
Extra signal: strong breakout volume + successful retest of broken trendline as support.
Invalidation: if price fails to hold above 2.325 after breakout.
---
📉 Bearish Scenario
Trigger: Daily close below 2.325 (Fibo 0.618).
Downside targets:
Target 1: 1.793 (previous low)
Target 2 (aggressive measured move projection): ~1.08
Extra signal: declining buy volume + strong red candle closing below support.
Invalidation: if price reclaims 2.460–2.676 after breakdown.
---
⚖️ Conclusion
NEAR is standing at a key decision zone.
A bullish breakout above the descending trendline could spark a trend reversal with potential rally toward 3.0 – 3.57.
A bearish breakdown below 2.325 would confirm bearish continuation, targeting 1.79 and potentially lower.
In short, the 2.325–2.460 zone is NEAR’s lifeline — holding above it may trigger a reversal, breaking below it could extend the downtrend.
---
📌 Notes
Always wait for daily close confirmation to avoid false breakouts.
Watch volume for breakout/breakdown validation.
Apply proper risk management (cut loss & position sizing).
#NEAR #NEARProtocol #NEARUSDT #Crypto #Altcoins #CryptoAnalysis #DescendingTriangle #SupportResistance #Fibonacci #BullishScenario #BearishScenario

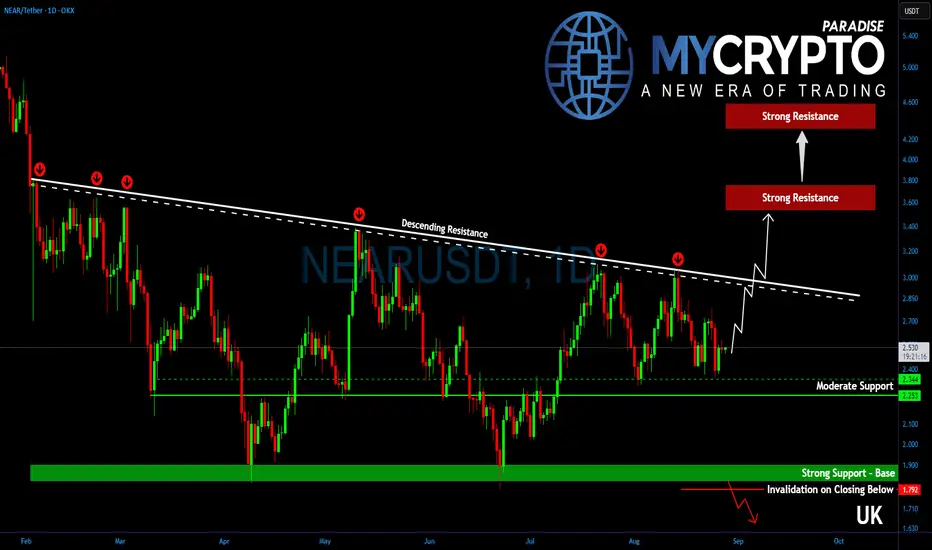
NEAR About to Explode or Collapse? Key Levels to WatchYello Paradisers, have you noticed that #NEAR has been stuck inside this broad descending structure for more than 200 days now?
💎Every time the price tests the resistance trendline, it gets rejected—but here’s the catch: each test is weakening that barrier. How much longer can the sellers keep this lid on before it finally breaks?
💎#NEARUSDT has now reached a critical point and a confirmed breakout above the descending resistance would immediately flip momentum to the bullish side. That would open the path first toward $3.60–$3.80, which also aligns with the 50% retracement zone. While some profit-taking could appear there, the real momentum could still carry NEAR higher.
💎If buyers stay in control beyond that level, the next big target sits at $4.20–$4.40, right at the 61.8% retracement, which historically acts as a powerful magnet for price action.
💎On the downside, the $1.85–$1.95 zone has proven itself as the strongest demand base. This level has been defended multiple times and remains the key line in the sand for bulls. If that support holds, the bigger bullish outlook stays intact.
Paradisers, strive for consistency, not quick profits. Treat the market as a businessman, not as a gambler.
MyCryptoParadise
iFeel the success🌴
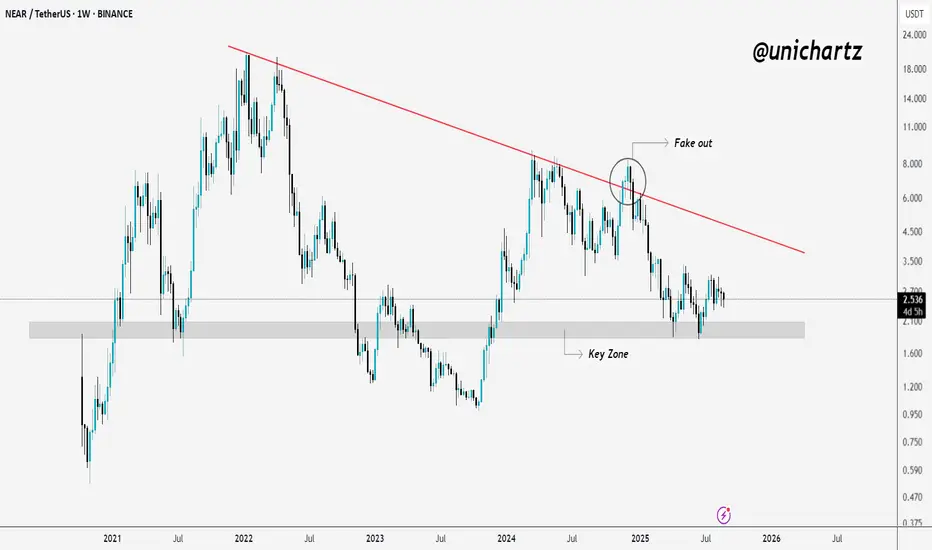
$NEAR at a Decision Point – Will This Support Crack?CBOE:NEAR remains under its long-term downtrend line, with a clear fakeout rejection near $8. Since then, it's been trending lower and is now sitting just above a key support zone that has held multiple times.
If this zone breaks, more downside is likely. But if it holds, NEAR could see a bounce or consolidation, though momentum still favors the bears for now.
DYOR, NFA
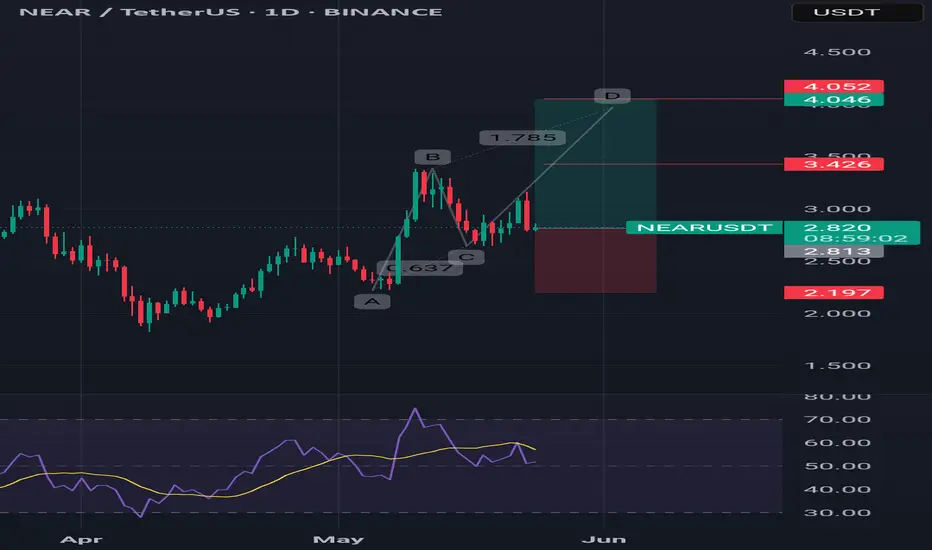
NEAR Setup – Support Zone Long OpportunityAfter a strong 23.5% rally, NEAR has pulled back into a high-confluence area, aligning range support with the 61.80% Fibonacci retracement, creating a favorable long entry zone.
Trade Setup:
• Entry Zone: $2.35 – $2.50
• Take Profit Targets:
🥇 $2.80 – $3.05
🥈 $3.60 – $4.00
• Stop Loss: $2.28

Near protocol = BTD opportunity incoming. NEAR is consolidating, and despite the selling pressure, the price is still within the structure. The question is, do we buy if the price hits the bottom of the range?

NEARUSDT 1H SHORTAfter double top it is going towards its neckline.
And price below jaw give us more chances to break the neck and go towards TP

NEAR : Buy < Hold for $5I have maintained this position with three targets and a specific stop loss.

NEAR USDT TARGET Price (USD)
🎯 Final Long-term Target
8.90 ┤ ⚡ Strong Resistance
6.00 ┤ 🎯 Major Mid-term Target
5.00 ┤
4.50 ┤ ⚡ Resistance
4.00 ┤
3.50 ┤ 🎯 Mid-term Target
3.00 ┤ ⚡ Resistance
2.80 ┤
2.60 ┤ 🎯 Short-term Target
2.46 ┤━━━━━━ 🔹 Current Price / Strong Support
2.20 ┤━━━━━━ ❌ Stop Loss Zone
Accumulation Zone: $2.46 — prime entry for smart money.
Short-term Breakout: $2.60 → $3.00 — early movers will ride the first wave.
Mid-term Momentum: $3.50 → $4.50 → $5.00 — follow the whale flows, strong upward push.
Long-term Surge: $6.00 → $8.00 → $10.00 — massive liquidity inflows can trigger parabolic moves.
💎 Key Points
NEAR has a growing ecosystem & adoption — perfect for whales to accumulate silently.
Low risk, high reward whale-friendly zones.
Clear roadmap from support → resistance → targets — no guesswork.
🐋 Whales are circling — the next breakout could be explosive. Accumulate now or miss the rocket! 🚀

NEAR USDT Double Top Pattern in PlayNEAR USDT Double Top Pattern in Play
On the daily chart, NEAR/USDT has formed a clear double top pattern. Alongside this, a bearish divergence has also developed, suggesting weakness in upward momentum. At the moment, price is sitting near the key support zone around 2.3.
Support at 2.3 and the Bounce Possibility
If NEAR manages to hold this 2.3 support, a bounce could follow toward the 2.85 resistance area. This zone will act as a critical decision point. A rejection here would likely confirm the double top pattern and bring back selling pressure.
Break of 2.3 Could Lead to 1.8 Retest
On the flip side, if the 2.3 support fails, the double top comes into full effect, and NEAR could slide further down to the 1.8 area, where it has found strong support in the past. Until then, the focus remains on whether the current bounce can push through 2.85 or not.

I think Near is getting ready for takeoffI think that after a downward wave, the e leg of the triangle will be completed.

$NEAR IdeaStacked BBs near the GP of the swing high to low, not a bad place to look to long if we get it. Applying small risk.

NEARUSDT Bullish Rebound Setup From Pullback SupportAI Trade Setup Analysis
Timeframe: 2H (Two Hour)
Position Type: Long (Buy)
Entry Point: 2.7800
Positioned exactly between the stop loss and take profit zones, providing an optimal entry after a corrective pullback in an overall bullish move.
Stop Loss (SL): 2.5500
Placed below the recent swing low to protect against a deeper retracement. Risk is approximately -8.27% from entry.
Take Profit (TP): 3.3000
Target set at a key resistance level, offering a potential upside of around +18.71% from entry.
Risk/Reward Ratio: 2.26
A solid setup with more than double the reward potential compared to the risk.
Technical Outlook:
NEARUSDT has pulled back after a strong upward impulse and is now hovering near a prior support zone. This area could serve as a springboard for a rebound toward the next resistance at 3.3000 if buying pressure resumes.
Bullish Scenario: Sustaining price action above 2.7800 could trigger renewed upward momentum, targeting 3.3000.
Bearish Invalidation: A drop below 2.5500 would negate the bullish setup and suggest further downside potential.
Summary:
This trade setup is designed to capitalize on a potential bullish continuation from pullback support, with a defined stop below structural support and a target at the next major resistance.

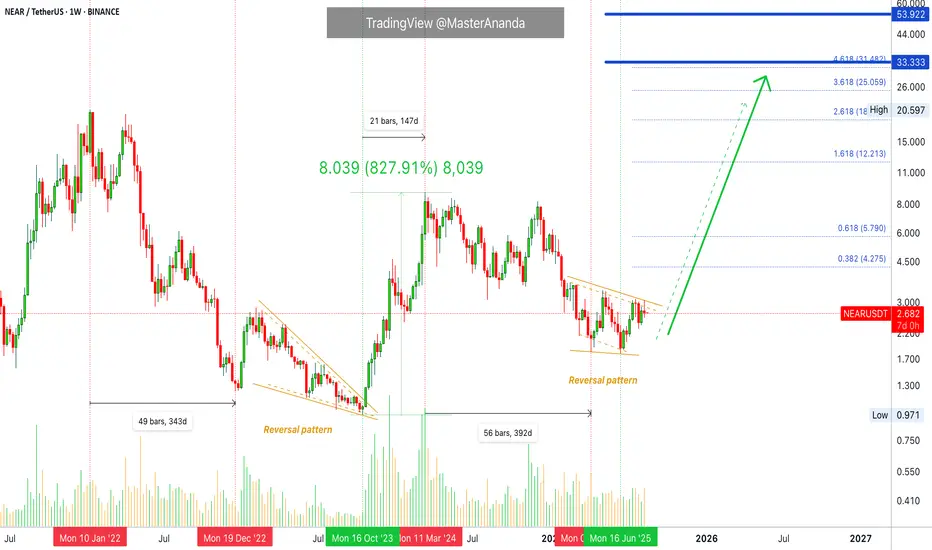
NEAR Protocol 2025 All-Time High & Technical AnalysisNEARUSDT previous all-time high happened January 2022. A year long bear market produced a reversal pattern between 2022 and 2023. This reversal pattern produced a 828% strong bullish wave between October 2023 and March 2024, 147 days.
The same dynamics are now present on this chart. NEARUSDT peaked March 2024 and started a very strong bear market. Between March 2024 and April 2025 we have 392 days. I am using the first low to match the 2022 bear market.
A reversal pattern is now present on the chart, same as 2022-2023. Here is the sequence:
1) Bullish wave.
2) Bear market (long-term correction).
3) Reversal (consolidation) pattern.
4) New bullish wave.
This chart looks similar to LINK but before the bullish breakout. What one does, the rest follows.
NEARUSDT is looking good. The last four weeks have been neutral. Here is another hidden signal. NEARUSDT closed four weeks but there is basically no change in price; more consolidation.
Four weeks and the action continues to happen at resistance. The local resistance of the reversal pattern.
From here on we can see a strong bullish advance. You can look at the pairs that are moving ahead such as XRP, ETH, ADA and BTC. All these hit a low in April followed by a bounce. Then another low in June followed by strong growth.
NEAR Protocol is bullish long-term. The bullish cycle for this project started October 2023. The recent low in June 2025 is a long-term higher low and we are about to experience a long-term higher high; a new all-time high.
Namaste.
NEAR LONG 1. Chart Context
Pair: NEAR/USDT Perpetual (Bybit)
Timeframe: 1H
Indicators: Multiple Moving Averages (different colors), horizontal support/resistance levels, daily/weekly/monthly opens.
Setup: A long (buy) position with risk-to-reward defined.
2. Key Levels Marked
Monday High: Around 2.787 – resistance from earlier in the week.
Weekly Open: ~2.749
Daily Open: ~2.744
Monday Low: ~2.620 – support zone.
Monthly Open: ~2.559 – deeper support.
These opens and highs/lows are used as liquidity and directional bias levels.
3. Trade Setup
Entry: Near 2.721 (current market price at time of setup).
Stop Loss: Below Monday Low (~2.620) → protects against downside break.
Take Profit: Around 3.044 → aiming for previous high / liquidity above resistance.
4. Risk-Reward Ratio
Risk (stop): ~0.10 (2.721 → 2.620)
Reward (target): ~0.32 (2.721 → 3.044)
Risk:Reward ≈ 1:3 (strong setup in terms of R:R).
5. Strategy Behind It
Price is consolidating near Daily/Weekly Open → neutral zone.
Long bias likely comes from expectation that liquidity above Monday High will be taken before a reversal.
Moving averages are flattening → showing consolidation, so the trader is betting on upside breakout.
Stop below Monday Low avoids getting caught in a fakeout.
✅ Summary:
This setup is a long trade from 2.721, targeting 3.044 with a stop at 2.620. It’s based on liquidity levels (opens, highs, lows) and offers a clean 1:3 risk-reward ratio. The trader expects NEAR to push above Monday High before testing lower levels.

NEARUSDT?Hi,
Find price range 2.88-2.78
Is a good range for buys
NEAR past down trendline (1h)
All the best
Not a guru

Near Coin is forming a W Pattern on the 1D Chart💰 #The Near Coin is forming a W Pattern on the 1D Chart.
💵 Tp 1 : $ 3.29
💵 Tp 2 : $ 4.36
💵 Tp 3 : $ 5.17
💵 Tp 4 : $ 5.94
💵 Tp 5 : $ 6.55