NOW $600s Soon? Keep Watch!As you can tell, $566 is a key price in the past few months.
We have seen double top bounces from $566 resistance.
If we get past this level, say around $570, we can definitely see this stock going to $600.
Be wary, this stock has shot back down from $566, so this is very important to see how the price moves in the upcoming days.
Things to note, Daily chart, RSI showing overbought, we may get a slight dip once past $566.
Currently have no position.
Please let me know what you guys think in the comments. Let me know other stocks I can post. Thank you!
NOWS trade ideas

RSI very over bought! needs to cool off a bitlooks like a potential double top scenario here on NOW, bears are trying to take it lower now and profit taking may begin. look for a test of 560 or lower in short term if we continue to see weakness after the rejection. goodluck! dont forget to like and follow if you enjoy my ideas <3

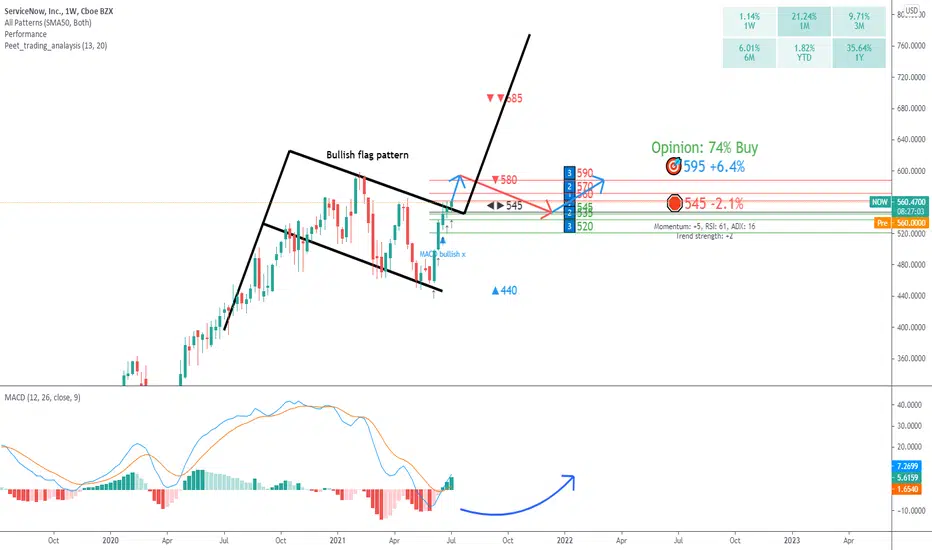
NOW: bullish flag pattern?Upside price momentum supports the bullish trend direction.
Increasing trend strength also supports the bullish trend.
RSI leaves enough room for further upside price potential.
Recent Bullish MACD crossover acts as further support.
A price action below 545 will change the trend direction to bearish.
$NOW Cup with Handle Watchlist - Updated.ServiceNow $NOW is an excellent example of the double bottom / Shake-out Plus 3 CANSLIM Style trade.
While I missed that trade, the entry would have been between $485.64 to $508.76. That would have coincided well with he Gap up on June 9th when you also had a pocket pivot volume day. Even if one would have waited to reclaim the 200 DMA it would be close to the buy range and still an outstanding entry.
However, I missed that trade and I have an unbendable rule of not chasing price.
There looks to be a new opportunity forming. $NOW has formed a Cup Formation. There seems to be a reversal or stalling candle on June 24 (Closing in the lower range). Today there was some selling with price closing once again in the lower range of the day. I am hopeful that that will continue down for another 5% to 10% over the next 4 or 5 days. If it were to do that, it would be a textbook Cup with Handle formation. (And by the way, a retest of the original entry area, also quite common, hence the shake-out of weak hands.)
I’ll be watching this next week. The proper buy point would be $558.85, just over the high of June 9th. However, I look for early entries and would buy when it breaks above the short-term downtrend line (if it performs near to how I’ve drawn the future downtrend.
I hope this helps. These are my ideas and not investing / trading advice.

Looking for $NOW to pullback and make a "High Handle".Here's one for the watch list. I missed the break of the downtrend trade and I will not chase. I like ServiceNow as a company and the growth expected in the future.
I am looking for this to pullback and create a handle on the latest cup formation. That would create a much needed shake-out of weak hands so the stock would be able to advance further with little selling resistance.
And, if you look at the chart it also came out of a classic double bottom. "Ants" are also present on the chart. These indicate that the stock has upside momentum. These and other great indicators are available on @TradingView and programmed by @JohnMuchow .
I left older uptrend lines in tact. Why? because I think there is a chance this will get back to it's older trend line. If that "were" to happen $NOW would be a big winner. ALL TBD. Ideas, not investing / trading advice.

Service Now Inc (NOW) Short Setup #2 My April short worked out well, and I fully exited at my last profit target. Just opened another short here, as I like the risk/reward once again. Stop loss is a must as always.

Trading Idea - #ServicenowSHORT
ENTRY: 467.00 USD
TARGET: 389.00 USD (+16% profit)
STOP: 516.00 USD
ServiceNow, Inc. is a provider of cloud computing solutions that define, structure, manage, and automate services for global companies. The company offers a range of cloud-based services that automate the workflow within and between departments in a company.
1.) 463.00 USD is the support that needs to fall to get a more precise SHORT signal! Keep an eye on that!


ServiceNow (NOW) Is About To Go On A TEARNOW does not have any resistance until $550, so it should be a straight shot to that level.


$NOW with a Bearish outlook following its earnings #Stocks The PEAD projected a Bearish outlook for $NOW after a Negative Under reaction following its earnings release placing the stock in drift D
If you would like to see the Drift for another stock please message us. Also click on the Like Button if this was useful and follow us or join us.


ServiceNow looks like it will test 330$After the very weak signals, servicenow is ready to go very deep to 330$ in the next months, where it may be a good cheap buy trade.
But actually it is a clear short.

ServiceNow (NOW) Whispered In My Ear "Short Me Now"My entry and profit targets on ServiceNow. I can do these short setups all day. Longs too, but I have a special fondness for pulling off shorts in a crazy bull market. Not financial advice.

Technical analysis for short term opportunity The stock is going up trend from the beginning of 2020 , also there is an earning at the end of the month, this is not a financial advise ,but it’s something to look at


ServiceNow Inc. Target @$880 261.8% date dec 7, 2022 bullishServiceNow Inc.
Bought 10 NOW @$560 Target @$880 261.8% date dec 7, 2022

NOW - good candidate for a vertical call spreadNote the high volume shelf at $513 and lesser one at $528
Looks like a good candidate for a Vertical Call Spread around the Feb Fib Retracement 50% line (bracket $553 with a $30 or $50 spread; 530/580 for example)
Continued weakness in NDX over the next 10 trading days may offer chance for "legging into" a spread. (Buying the lower side first, then selling the top side of the spread on a bounce or rally)
Suggest moving out on the calendar (August perhaps).

bounce off support! time to run previous resistance is now acting as support here, long 570 stop loss 555 and target 600 in the short term :)
