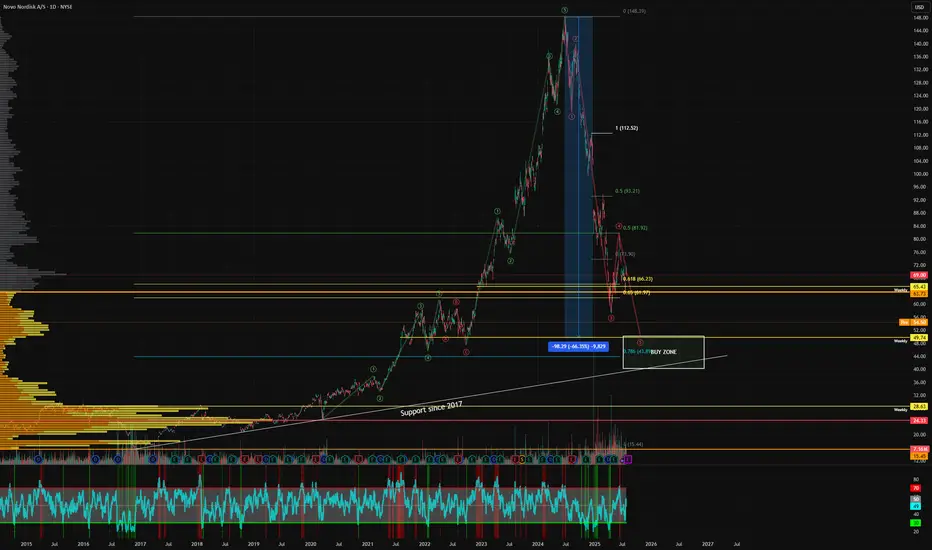
$NVO Accumulating long term compounder! - Previously, I have shorted NYSE:NVO when it was in $75-85 when moat was weakening and then went long around $58 to $75 for 40% on the long side. Everything is documented in my two posts.
- People are asking me if NYSE:NVO is cheap or not. After cutting guidance, I believe most of the estimates for EPS about NYSE:NVO are way off which would be revised downwards.
- At the same time, I believe NYSE:NVO has kitchen sinked their guidance because of new CEO transition which is very common in the publicly traded company.
- NYSE:NVO might not be cheap after cutting guidance honestly but not overvalued either.
- NYSE:NVO could be a dead money for some time 6 months, 1 year or 2 years who knows?
- But I know that weight loss industry in general is growing overall at least till 2030 and beyond.
- Some concerns I have is NYSE:NVO leadership is getting challenged by NYSE:LLY so it could be possible that NYSE:NVO might get lesser piece of the pie. However, overall piece is growing along with it so NYSE:NVO should continue to grow but at a lower rate than earlier.
- Net free cash flow should grow and company might return on investment to shareholders via share buybacks?
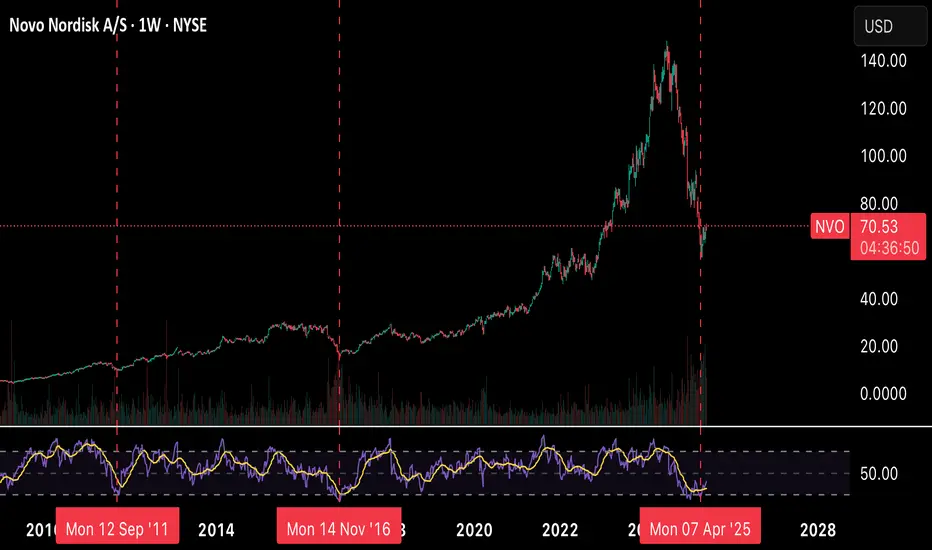
- Finally, I am buying NYSE:NVO in increments and have bought first lot of shares in $50.xx and will continue to add more if it drops more. I think NYSE:NVO can test 200 monthly moving average @ $35.
- I have marked the accumulation box in the chart for your reference.
Trade ideas
$NOVO_BNovo Nordisk has had a tough time over the past 13 months, with its stock falling significantly. The main reason is growing investor concern that the explosive growth in sales of Wegovy and Ozempic may be slowing down, especially as competition heats up — particularly from Eli Lilly. Just a few days ago, Novo cut its full-year growth forecast, which confirmed some of those market worries.
At the same time, they announced a leadership change. Current CEO Lars Fruergaard Jørgensen is stepping down, and from August 7, Mike Doustdar will take over. He’s been with Novo since 1992 and has led the company’s international operations with great success. He’s also completed executive education at Harvard, and he’s widely seen as a strong, action-oriented leader with global experience.
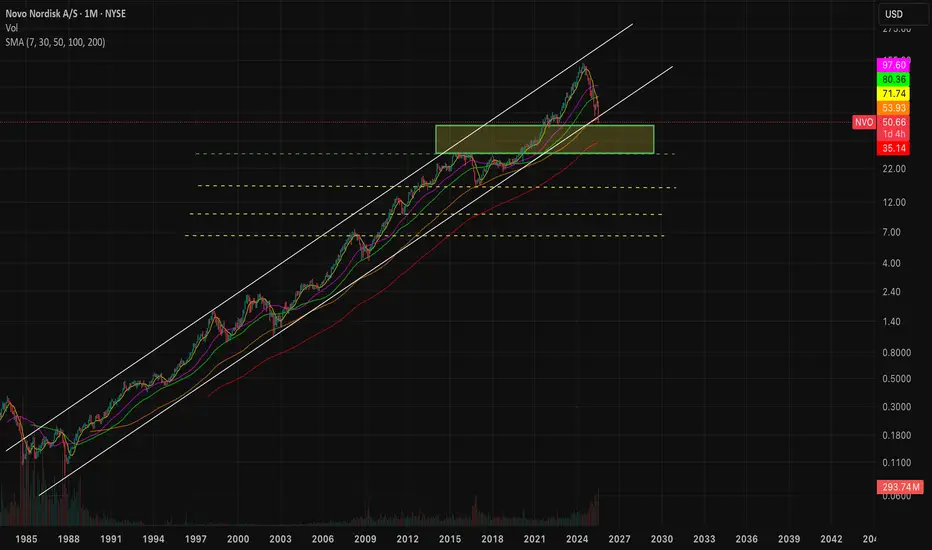
Looking at the chart the price has almost always swayed up and down within this tunnel. Occationally falling to the trendline bellow.
Now we are at the trendline below - Meaning we are at an absolute panic state. One og the biggest pharma companies in the world - who in a matter of 5 years will bring a weight loss pill to this world - is ready for a new start.
Still somewhat of a falling knife - so be careful. But keep an eye out for a speedy return upwards.

NVO Could Bounce Back Soon ?!NVO dropped hard (over 20%) mainly because of a legal issue. I think this is temporary and will get solved with time. The stock is now super oversold and sitting on strong support around $52–53.
• Entry: $52–54
• Target 1: $56.90
• Target 2: $66.40
• Stop Loss: $50
If the issue clears, we could see a strong rebound and possibly a full recovery of this drop.
Is Novo Nordisk a buy? Novo Nordisk $NYSE: NVO plummets 22% on July 29, wiping out $57.5B in market value!
Here's what's happening and how I see it.
Here’s the breakdown on why the stock hit its lowest since Nov 2022:
Slashed 2025 Guidance: Sales growth cut to 8–14% from 13–21%, operating profit to 10–16% from 16–24%. Weak U.S. demand for Wegovy & Ozempic, plus competition from cheaper compounded GLP-1 drugs (i.e. grey market), cited as key issues.
CEO Shake-Up: Lars Fruergaard Jørgensen out, Maziar Doustdar in as CEO effective Aug 7. Investors worry Doustdar’s limited U.S. experience could hurt Novo’s edge in its biggest market (57% of sales).
Competition: Eli Lilly’s Zepbound (20.2% weight loss vs. Wegovy’s 13.7%) & Mounjaro are stealing market share. Compounded GLP-1s from Hims & Hers add pricing pressure.
Here's what I see:
There's a strong bearish sentiment, but the stock is very underpriced.
Considering the current stock price, EPS is at an all-time high. This means investors get more earnings for their stock.
P/B, P/E, and P/S ratios are at the lowest level since 2017! This is despite revenue growth of 25%+ for 3 consecutive years.
Operating margins are still quite healthy.
The company still has a very significant share (over 50%) of the GLP1 drugs worldwide.
The valuation of this company is now at the best level of the last 7-8 years.
There might be more volatility ahead, but I see the recent price drop as an opportunity to buy a pharma giant at a big discount, giving investors a margin of safety.
Quick note: I'm just sharing my journey - not financial advice! 😊

ALL-IN NOVO!!!We have reached a significant demand zone from which we shall accumulate some buy orders. Expecting this stock to turn around from this zone and break into new all-time-highs.

NVO-All InNVO currently at the all time historical 100 monthly SMA trendline, with Weekly bullish divergent on the RSI
This is a rare price structure, with fundamentally great risk to reward. Expecting a trend reversal soon.
Pray this will played out as planned.
😬🙏

Novo Nordisk on Fire Sale!This megaphone pattern below support makes me think this 20pe ratio stock is looking to reclaim support and run back up to $158.
Good luck!

NVO-Bought more hereDoubled down right here,
Testing the all time support trendline 100 monthly SMA.
$NVO offers solid risk to reward for long term buyers! - I had previously called out that NYSE:NVO would have more pain to come when it was in $85-90s I have attached the link with this post for my reader's reference.
- Now, I am turning bullish on this name given these prices and compressed multiples for the growth prospects it offers.
Fundamentally,
Year | 2025 | 2026 | 2027 | 2028
EPS | 3.93 | 4.78 | 5.41 | 5.97
EPS growth% | 25.41% | 21.60% | 13.19% | 10.24%
For a quality name growing EPS > 20% deserves a fair forward multiple of 25.
| Year | Bear (fp/e = 15) | Cons. Base (f. p/e = 20) | Base (fpe = 25) | Bull Case (fpe=30)
| 2025 | $58.95 | $78 |. $98.25. |. $117.9
| 2026 | $71.7 | $95 |. $119. |. $143.4
| 2027 | $81.15 | $108 |. $135 | $162.3
| 2028 | $90 | $119 |. $149.25 | $179.1
As you can see, If you buy NYSE:NVO under $60 then you will be making money even if multiple remains compressed i.e bear case. Only thing you have to do is hold and returns would amplify once there is optimism back in the market which will lead to multiple expansion.
My fair value for NYSE:NVO for this year is $78 based on the conservative base case.

Final Drop?This looks like the final puke of wave 5. It could end up anywhere between $40-50. I have taken a position at $50 and I intend to load up more if we retest the historical support trendline.
Not financial advice, do what's best for you
NVO Are we about to make trend reversal here?The Price action of NVO has been retested and bounce up from the 100 monthly EMA trendline.
With previous weekly bullish enhulfing candle.
So far possibly price structure for trend reversal to the upside, let see how this will play out.

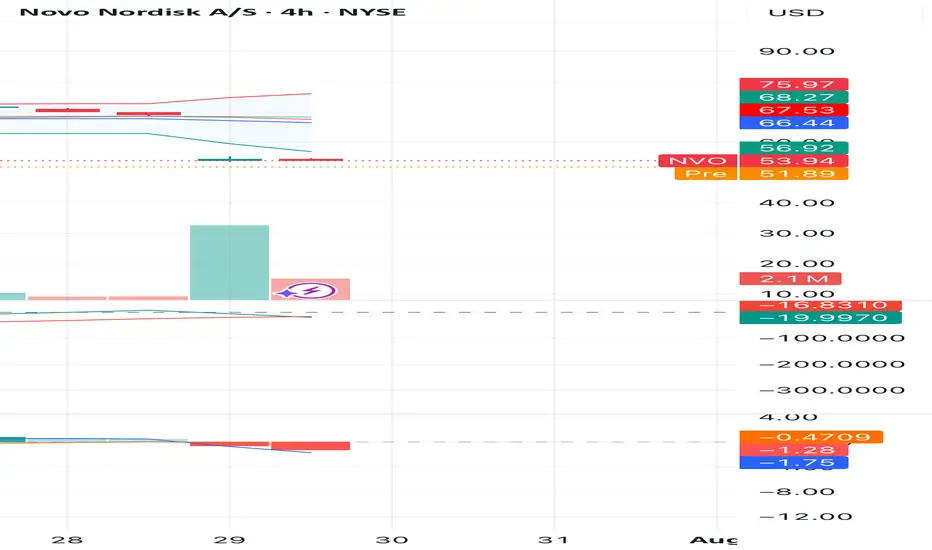
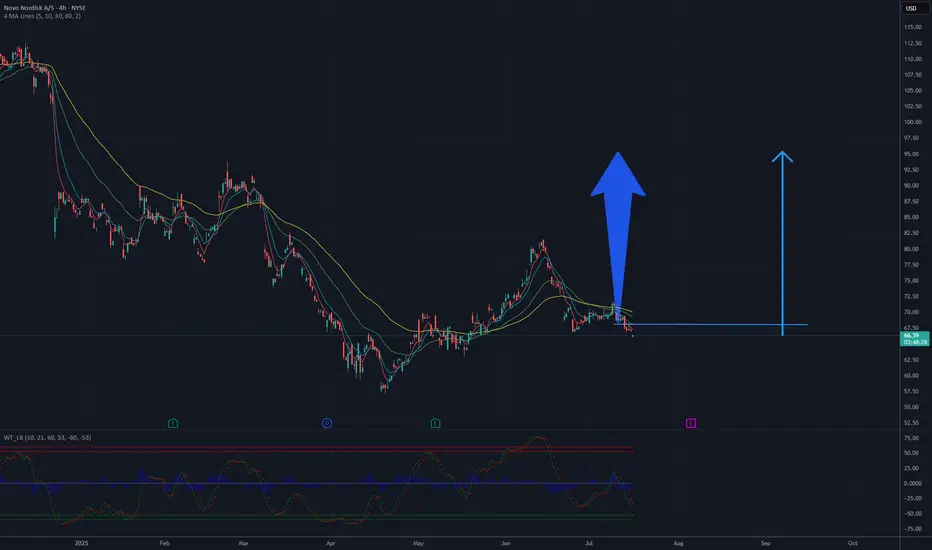
Potential Upside Move in Novo Nordisk Stock Toward the $90–$100 Based on the 4-hour chart of Novo Nordisk A/S (NYSE: NVO), the stock has undergone a strong downward correction from above $165, but is now showing signs of a potential technical bottom near the $65 level. Price action has stabilized, and oscillators indicate oversold conditions, suggesting a possible trend reversal.
The chart shows a short-term consolidation after a bounce, and the moving averages (MA 5/10/30/60) are converging — a setup that often precedes a bullish breakout. The $90–$100 area aligns with former support-turned-resistance zones, making it a natural target for a corrective upward move.
Conclusion: If the current momentum holds and the price breaks out of the local consolidation, a move toward the $90–$100 range appears likely as part of a broader rebound following the extended downtrend.
Potential TP : 90-95 USD
NVO: Trend Continuation With 4.74 R/R SetupNovo Nordisk ( NYSE:NVO ) is showing classic strength — bouncing off the cloud, reclaiming structure, and flashing early signs of momentum rotation. This is how you catch continuation trades without chasing.
📊 Technical Breakdown
Ichimoku: Price reclaimed the top of the cloud and is now building above it. Kijun and Tenkan are aligned. This is the first real bullish structure since the March breakdown.
MACD: Histogram curling upward. We’re not fully bullish yet, but the pressure is shifting back to buyers.
R1 Pivot ($81.31) is the first big test. A clean break above that opens the path toward R2 and beyond.
🎯 Trade Specs
Entry: $71.58
Target: $93.33 (+30.44%)
Stop: $67.00 (–6.42%)
Risk/Reward: 4.74 — elite-level skew for a high-quality name

Cup & Handle to 81$ (and much more)Breakout successful from the red descending channel where we had left it in the previous idea.
The price is now completing the 'handle' of the pattern in question.
Resistance is around $81.5, and a close above it, accompanied by strong volume, could push the price back toward $100

NVO to 107 USDTechnical Analysis Summary – NVO
After a prolonged downtrend, the stock established a potential reversal structure:
Wave 1: Initial impulsive rally, marking the first significant move against the prevailing bearish trend.
Wave 2: Healthy corrective pullback that retraced precisely to the 61.8% Fibonacci level of Wave 1, which is a classic depth for a Wave 2 retracement in Elliott Wave Theory.
The price also tested and bounced off the 200-day Simple Moving Average (SMA) on the first attempt, confirming this zone as key technical support.
A hidden bullish divergence formed: while the price created a higher low, the momentum indicator (RSI) printed a lower low. This suggests that sellers exhausted their strength and the primary trend may resume.
Premarket action showed the stock trading about +2% higher, indicating early buying interest and potential momentum continuation.
The projected target for Wave 3, assuming the scenario unfolds, is approximately $107, derived from the 161.8% Fibonacci extension of Wave 1. This also coincides with historically important resistance.
Overall, this setup combines:
✅ A clear Elliott Wave structure (Wave 1-2-3),
✅ Confluence of major support levels (61.8% retracement and the 200-day SMA),
✅ A hidden bullish divergence signaling continuation,
✅ A strong premarket move suggesting institutional interest,
✅ And supportive fundamentals behind the price action.
This is an example of a technically robust scenario with favorable risk/reward characteristics. Traders will watch for confirmation through volume expansion and a breakout above recent swing highs to validate the start of Wave 3.

$NVO Trade Idea – Potential Bullish Reversal Setup📊 Market Structure Insight
After a clear downtrend marked by consecutive Lower Highs (LH) and Lower Lows (LL), NYSE:NVO is beginning to show early signs of a trend reversal.
🔹 Recent price action has shifted into a Higher High (HH) and Higher Low (HL) formation – a classic sign of bullish momentum building.
🔹 Price is consolidating above a major demand zone (~$60–68), which previously acted as strong support. Buyers are showing interest here again.
🔹 The RSI is rebounding from oversold territory, indicating growing bullish pressure and a potential momentum shift.
📈 Upside Scenario (Projection)
If the current HL around $67 holds, we could see a continuation of the uptrend targeting key levels:
TP1: $90 – Initial resistance / possible gap fill
TP2: $120 – Mid-supply zone and structure resistance
TP3: $147 – Macro supply zone and previous all-time high
🎯 Trade Setup
Entry Zone: $67–70
Stop Loss: Below $60 (beneath key support)
Targets: $90 / $120 / $147
⚠️ Invalidation
Breakdown below $60 would invalidate this bullish setup and signal possible continuation of the previous downtrend.
💡 Watch for confirmation on the next HL / HH combo. A clean breakout above recent highs would further validate the bullish case.

NOVO expected to reach ATH during 2026Based on EW count and general knowledge about the company, it is expected that Novo will get back to the top (approx x2 from here) during 2026. Lets see

NVO Soaring Towards TargetsOur NVO call debit spreads and LEAPS options soaring towards targets at the 233 EMA here.
Beautiful thing when fundamentals, valuations and technicals align.
Impulse move from the bottom gave us a hat trick - triple green tags (white circles) for bullish A+ momentum signals into a consolidation period in which we built our position and added on the consolidation breakout

NVO bounce off of Ozempic launch AVWAPOzempic launched Feb 5 2018. Anchoring our VWAP to that date we get our confirmation of a strong anchor from the COVID bounce, indicating institutional buying at that level. Over 7 years later, we get another opportunity.

Novo Nordisk: Massive buying opportunityNovo has been struggling big time, december and march hit especially hard.
American institutions have held large positions in Novo, and this was felt when they had to sell off due to risk management with the looming tariffs.
However, the sheer devaluation & importance of their export, is going to create a massive wave following a risk-on environment, which i firmly believe is coming.
One of the few large EU based firms worth investing heavy in.

nvo bullish long Long Setup Idea – Not Financial Advice - AH
This is a long trade setup based on my personal analysis.
The entry, stop-loss, and target levels are outlined for educational and illustrative purposes only.
📈 Entry:
🛑 Stop Loss:
🎯 Target(s):
Disclaimer:
I am not a financial advisor. This idea is shared for educational purposes only and should not be considered investment advice. Always do your own research and manage your risk accordingly. Trading involves significant risk and can result in the loss of your capital.
AH

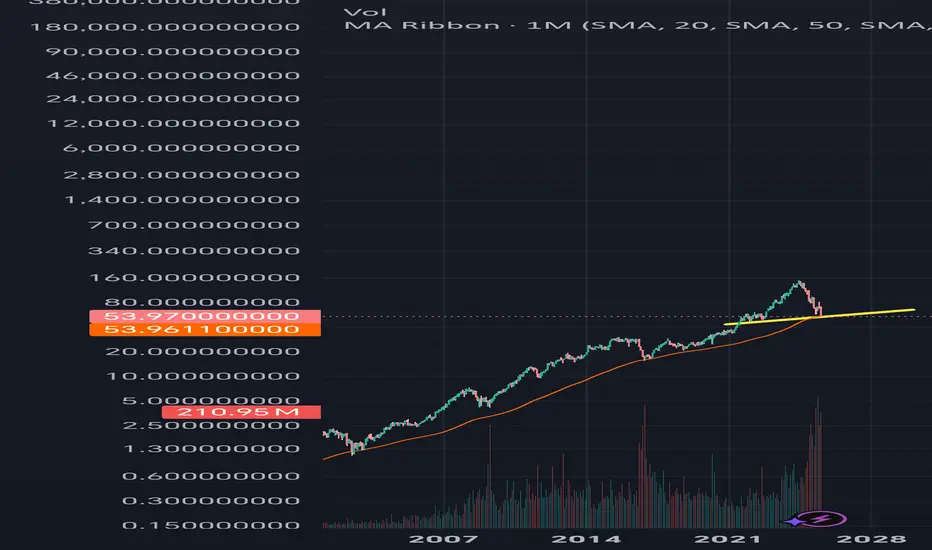
NVO Exhibits High Monthly Volume Amid Downtrend – SHortNVO Exhibits High Monthly Volume Amid Downtrend – Potential Accumulation Phase
📉 Post:
Novo Nordisk (NVO) has experienced a significant decline from its 52-week high of $148.15 to a recent low of $57.00. However, the monthly chart reveals an unusually high trading volume, which may indicate accumulation by institutional investors.
Key Observations:
High monthly trading volume, suggesting potential accumulation.
Current price: $71.50.
52-week range: $57.00 – $148.15.
Trading below the 209-day EMA, indicating a bearish long-term trend.
While the increased volume could signify a shift in sentiment, it's essential to wait for confirmation through a break above key resistance levels before considering a bullish position.
Not financial advice – just sharing my technical perspective.
#NVO #NovoNordisk #StockAnalysis #TechnicalAnalysis #EMA200 #VolumeAnalysis #PotentialReversal

The most profitable drug known to man. Liquid goldThe title speaks for itself self.
Weekly RSI retesting a 10yr low.
Ozempic (GLP1) is and will continue to be the most profitable drug known to man.