NEO now has parabolic potential on the daily chartI have no emotional attachment to this coin one way or another. If you look back a few weeks ago, we shorted it to the low 11s. However, given the recent resurgence of those lows, NEO clearly has a shot at a parabolic movement upwards. Maybe it will coincide with the platform upgrade to 3.0. It is very important to have a stop loss, maybe if the coin dips under 10 (break of parabolic advance) for a few consecutive daily closes, because these things can go either way. The R/R definitely favors a heavy long here.
Trade ideas

NEO | USDPerfectly rejected off the $12 resistance i had setup, failed to break and close above. Hit Entry price zones again, will not buy atm till further confirmation. Same Chart , not edited!
FA : NEO has bullish news and upcoming projects, can help boost the price, Right now can be a swing long term play, can take upto a Month ( End of March , if we go sideways).
Lower End: If we fail to hold, and see more of sell off on all crypto, we can see NEO above $8.25 ish. Lets see !

Neo/USDMy prediction of NEO/USD. This is not financial advice.
From what I can see, if you are interested in Neo for mid/long term at these prices aren't bad and set buy ladders at the fib retrace lines if it does fall lower.
Current trend line support is the green one, longer time frame support and resistance are the red lines. If you're longing, set stop loss underneath green trend line support if it doesn't hold, the worst case scenario would be the white squiggly line. Chart is invalid if red support line breaks.

#NEO (30min) I can't say this looks very impulsive.The move is sideways with many overlaps ... Breaking red line = down the dumpster

NEO Coin Undervalued. Bull Run Incoming!NEO has been in a downtrend for a few years after the ICO bubble, and after being in accumulation phase for most of 2019, I believe we are on track to a massive bull run (alt season)

NEO Analysis (Requested)I am proud to say that one of my followers requested me to make a chart for the first time! It's a big milestone for me :)
Shoutout to @dgknsmk for following my charts successfully (quote).
Thanks man!
So, the thing is that many of the crypto charts look almost identical.
I personally try to publish only charts which I would act on and to be honest at the moment I wouldn't buy NEO as I do not see a good setup.
There are many bullish things, and some bearish things which is in most charts, but for me to buy I'd like to see us above the 21 EMA and then down to confirm it as support and bounce from it - then I'd consider going into NEO with a stoploss below the 21 EMA.
Also I wouldn't do long term for now I'd play it level by level - box to box.
On the right screen you can see the 4 levels and we are in the middle of two of them, so I'd wait for us to go into one of them to make a decision.

NEO fibonacci RSI growth expectedDear all !
Expecting RSi growth formation at the end of March/April, that can lead to price hype.
Buy zone = 10.43$-13.00$
after testing fib resistance 13.0$ and approved RSI up trend there is possibility to grow to the level of cca 15$
If we cant get over 13.0$ resistance i expect a fall to the level of cca 8.8$-7.5$, where we'll test another support
I feel positive about NEO so keep finger crossed

NEO Symmetrical Triangles?A symmetrical triangle has formed between trendlines on the NEOUSD pair. This is a bullish symmetrical triangle as the first impulse wave was bullish which upon breakout of the triangle will lead to a second wave. A few H&S patterns can also be identified but I haven't listed these as their impact on daily charts is minimal.

Great opportunity to Buy NEOUSD medium termMy strategy is to combine several techniques at once:
+ Price channel and trend line: help me identify the direction of the price,
+ Supply - demand: help me identify the reversal position,
+ Elliott wave: help me determine the cycle of price,
+ Candlestick patterns and price action: Help me enter the order at the right time.
............

NEOUSD Long Enter at 9.19usd.NEOUSD Long Enter at 9.19usd. In the exchange rate, we try to trade the rule that the ATR closes with a symmetric motion of the wave sequence. I've written about this set of rules many times. It is based on the simplest and fastest way to identify a wave amplitude near the ATR closing values when constructing an exchange rate (either). If the same amplitude is obtained for both closing values (long direction, short direction), then it is very likely that an accumulation phase will occur. If the symmetric backtesting theory is correct, the exchange rate may turn north again from 9.19 usd. Then I expect a higher rise to the level of 19.50 usd.


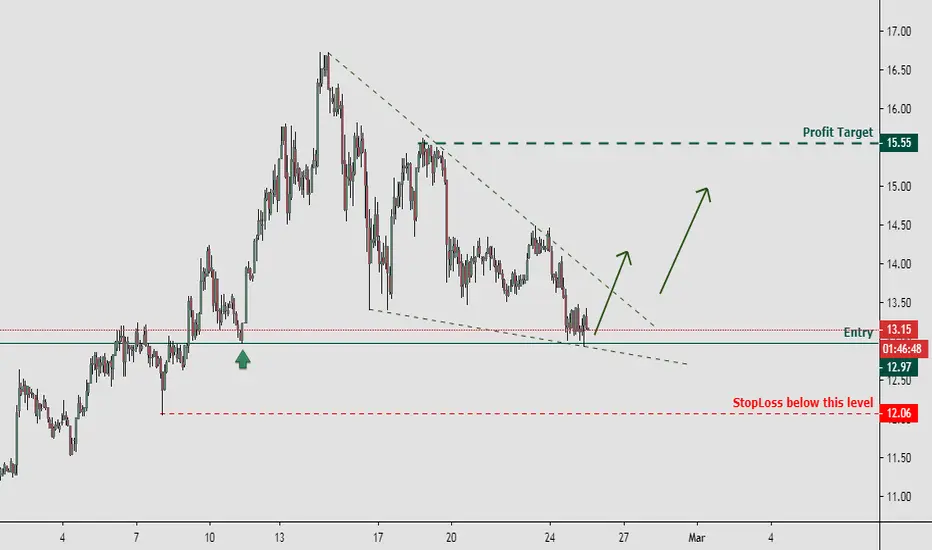
NEO/USD | Trade Idea | Swing Long In this Trade, we can see Neo on NEO/USD pair found a temp bottom and bounced. From previous S/R, this price point will play a crucial role. I have been holding Neo for long term, this is a trade setup I might take.
In the Next few hours or days, if Neo can find support from $10.50 - $11 and not break under but a retest bounce, we will see Neo go above $14-16 retesting Resistance again, can take a month to play out.


Neo weak strengthNeo is showing weak strength on the RSI where it broke the support line which could indicate a further push down towards 10$ where we will be looking for the uptrending channel to hold support.
8.65$ is another level to watch for. Could potentially be a good place to pick up some for a long position.
Neo has been consolidating in a range for almost 1,5 years in the range of 5-20$.
I personally believe a crypto run will come sooner than later and the recent attention and small rallies we had all across the crypto board could be a testament for a break out is on the horizon.
(YTD at their recent peak level)
BTC 53%
Litcoin 120%
Zcash 190%


NEO- Making lower highs, ShortNeo looks terrible. Unless it can retake the trend line, which will prove to be difficult, this is a short down to 11s against the US dollar.

NEOUSD - 12HIf we can't hold support price might drop to the next trend line (12.63)
If we hold support ; 14.35 - 15.60 - 16.77 - 18.00


$NEOUSDBITFINEX:NEOUSD
Great example of polarity change big plus is hidden divergences on indicator.
Up trend should resume soon.

NEOUSD further rise.NEOUSD further rise. The exchange rate builds a rising wave system. My analysis assumes that we are nearing the end of a 2: 1 fractal copy. You can see that the correction fractal is currently being duplicated twice. Therefore, I assume that once this is completed, the exchange rate will return to north again. Target price 18.93usd
