NEO can reach 30$ for SureNEO is in an Ascending Channel. The Price has a Ranging movement But it is Slowly Increasing. So Right now The Price is at The Bottom Of The Channel and There is also a Hidden Bullish Divergence (+HD) On MACD as well Which Means the Price has To Increase From This Point. we can Expect the Price to Reach 30$ once again.
_ _ _ _ _ _ _ _ _ _ _ _ _ _ _ _ _ _ _ _ _ _ _ _ _ _ _ _ _ _ _ _ _
Thank you for seeing idea .
Have a nice day and Good luck
Trade ideas


NEO - My Trading Plan in a picture!Hello TradingView Family / Fellow Traders. This is Richard, as known as theSignalyst.
NEO is overall bullish trading inside the red channel and now approaching the lower trendline acting as non-horizontal support.
Moreover, the green area is a horizontal Support.
So the highlighted purple circle is a very strong area to look for buy setups as it is the intersection of support in green and the red trendline.
As per my trading style:
I will be looking for potential bullish reversal setups on lower timeframes (like a double bottom , trendline break , and so on...)
And for the bulls to take over from a long-term perspective, we will need a break above the gray area covering the entire range / structure.
Unless NEO breaks the green zone downward aggressively, t hen it will become resistance again and a movement till the lower support would be expected (12.5 - 15.0)
Always follow your trading plan regarding entry, risk management, and trade management.
Good luck!
All Strategies Are Good; If Managed Properly!
~Rich

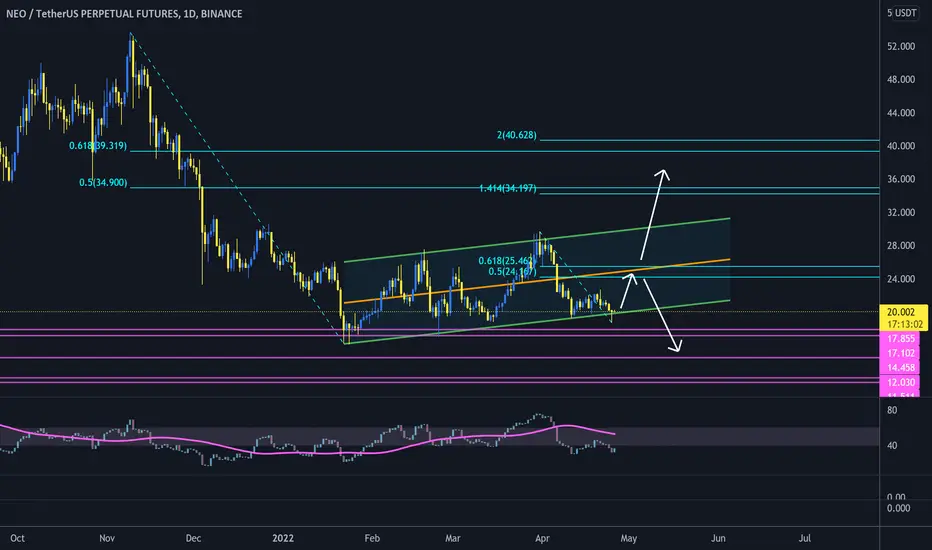
NEO at lower line of ascending channel#NEO/USDT
$NEO hold the lower lone of ascending parallel channel.
🐮 price can head up to middle line of channel that is the same with resistance zone between 0.5 and 0.618 fib levels of last swing down.
break out from upper line will increase price to resistance zone between $35 and $40
🐻 rejection from middle line of channel can drop price to lower line again and break down from lower line will decrease price toward $17 and $14.
Neo Its time you took the redpillWell, Bitcoin has taken us for a ride Padawan, Totally oversold, what does this mean- Deploy the ghost protocol.

NEOUSDT bottom found? ready to reverse?The price is testing the lower trendline of the ascending channel and the monthly support on 20.76$
on the lower timeframe, the price is creating a bear flag on it and the market got a rejection from the supply zone.
How to approach?
The price confirmed the 0.886 Fibonacci level as valid support on the daily static support on 19.7$. So if the price is going to have a breakout from the supply zone and ascending 4h channel, According to Plancton's strategy , we can set a nice order
–––––
Keep in mind.
🟣 Purple structure -> Monthly structure.
🔴 Red structure -> Weekly structure.
🔵 Blue structure -> Daily structure.
🟡 Yellow structure -> 4h structure.
–––––
Follow the Shrimp 🦐


💡Don't miss the great buy opportunity in NEOUSD @Neo_BlockchainTrading suggestion:
". There is a possibility of temporary retracement to the suggested support line (21.74).
. if so, traders can set orders based on Price Action and expect to reach short-term targets."
Technical analysis:
. NEOUSDT is in an uptrend, and the continuation of the uptrend is expected.
. The price is above the 21-Day WEMA, which acts as a dynamic support.
. The RSI is at 63.
Take Profits:
TP1= @ 23.57
TP2= @ 25.31
TP3= @ 27.28
TP4= @ 28.71
TP5= @ 30.53
SL= Break below S2
❤️ If you find this helpful and want more FREE forecasts in TradingView
. . . . . Please show your support back,
. . . . . . . . Hit the 👍 LIKE button,
. . . . . . . . . . Drop some feedback below in the comment!
❤️ Your support is very much 🙏 appreciated!❤️
💎 Want us to help you become a better Forex / Crypto trader?
Now, It's your turn!
Be sure to leave a comment; let us know how you see this opportunity and forecast.
Trade well, ❤️
ForecastCity English Support Team ❤️

💡Don't miss the great buy opportunity in NEOUSD @Neo_BlockchainTrading suggestion:
". There is a possibility of temporary retracement to the suggested support line (21.74).
. if so, traders can set orders based on Price Action and expect to reach short-term targets."
Technical analysis:
. NEOUSDT is in an uptrend, and the continuation of the uptrend is expected.
. The price is above the 21-Day WEMA, which acts as a dynamic support.
. The RSI is at 63.
Take Profits:
TP1= @ 23.57
TP2= @ 25.31
TP3= @ 27.28
TP4= @ 28.71
TP5= @ 30.53
SL= Break below S2
❤️ If you find this helpful and want more FREE forecasts in TradingView
. . . . . Please show your support back,
. . . . . . . . Hit the 👍 LIKE button,
. . . . . . . . . . Drop some feedback below in the comment!
❤️ Your support is very much 🙏 appreciated! ❤️
💎 Want us to help you become a better Forex / Crypto trader ?
Now, It's your turn !
Be sure to leave a comment; let us know how you see this opportunity and forecast.
Trade well, ❤️
ForecastCity English Support Team ❤️

Trend is your friend?Neo has bounced once again from this yearly trendline.
Depending on what happens with BTC this occasion might be a deal breaker for a long proposal.
NFA.

NEO is the true matrixlooking for the quick double to $40 range simple, as the market picks up this thing will rage to $1000 plus easily
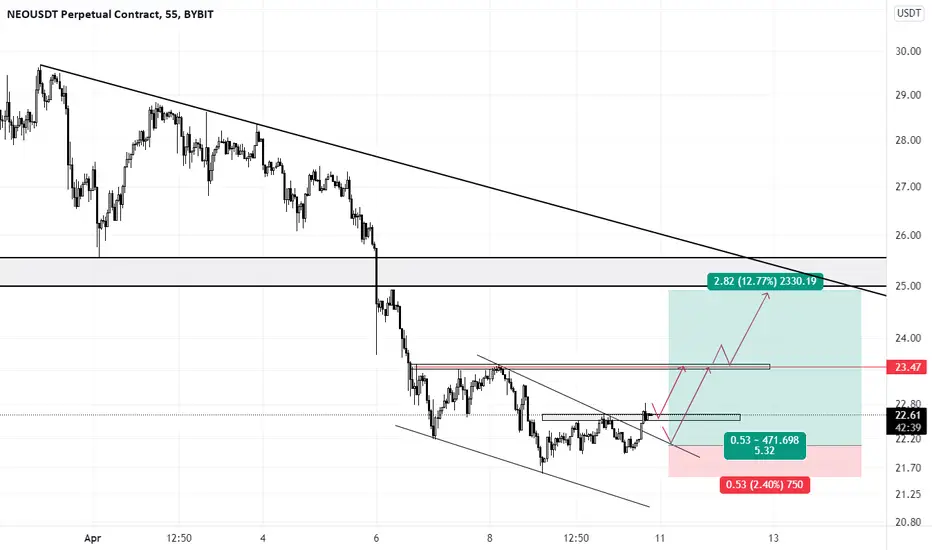
NEO triangle breakout 📐NEO seems to be ready to break up this triangle 📐 and if successful I think there is chance for run to 33 and even higher.
ENTRY : local high @ 23.8
STOPLOSS (SL) : local low @ 21.8
TARGET (TP) : height of the triangle projected from midpoint of the local range (BUY STOP-LIMIT - SL) @ 33.3
REWARD RISK RATIO (RRR) : 5
INVALIDATION : when SL level hit
Check my other stuff in related ideas.
Please like👍, comment🗣️, follow me✒️, enjoy📺!


NEO's bullish Trend Explained.NEO was in an Ascending Triangle & Recently The Break out Has Happened.So This Means the Price can Increase Freely.an Important Resistance Sits at 29.64$ If The Price manages To break this Resistance, The way to 38$ has No Difficulties. Since The Pattern is the Ascending Triangle, It means We Can Expect The Price To Increase as Much as The Measured Price Movement(AB=CD)
_ _ _ _ _ _ _ _ _ _ _ _ _ _ _ _ _ _ _ _ _ _ _ _ _ _ _ _ _ _ _ _ _
Thank you for seeing idea .
Have a nice day and Good luck

NEOUSDT & NEOBTC GANN Hello traders,,,
Today I will show you my idea about NEOBTC& NEOUSDT
NEOBTC is now having a Gann trend support and it is really important that NEOBTC stays above this resistance or we might go back to old prices, if new could stay above this support (2 daily close)
we might go to 0.000577 then 0.000599 and last target is 0.000682
If this scenario happened this will affect at NEOUSDT because if NEO get bullish versus BTC ,, NEOUSDT will go bullish too
so if NEOBTC go bullish our target at NEOUSDT 25.39 then 27.2 and our last target is 28.69 :)
NEOUSDT is now having a golden resistance (0.618) using fib extension if NEOUSDT could break this resistance with good volume we might see our targets
and now for RSI in both charts there is NO DIVERNGES that mean that our ascending channel is not strong enough to make the price go bearish BUT IT COULD HAPPEND IF WE NEO DOES NOT BREAK RESISCTANCE
Conclusion:
If NEOBTC get bullish NEOUSDT is likely to have the same.
This analysis has done by using Gann methods and Fib extension and RSI indicator & chart pattern
if you have any other opinion please feal free to share it in the comments below ,,,,,
Remember in this oscillatory market try to enter with volume
Have a nice day :))

NEOUSDTHello Crypto Lovers,
Mars Signals team wishes you high profits.
As you can see the price has successfully broken through the white resistance line and is currently directing towards thre second resistance area on ist way. We consider a forthcomming pullback to the first support line before approaching the identified resistance areas once again.
Warning: This is just a suggestion and we do not guarantee profits. We advise you analyze the chart before opening any position.
Wish you luck

#Neo #Bitcoin #LQR #TOBTC The price has corrected after hitting the ceiling of the specified ascending channel. In case of loss of support 26.41, the price can continue to correct until 24.17, then go to re-test the Bullish Channel line .
Supports: 26.41 ... 24.17
Resistaces: ma 200


DO NOT WORRY, WE HAVE JUST VERY NICE PuLLBACK up FOR NEO/USDTHI,
Today we have very nice pullback up for NEO/USDT, So U can investing on NEO/USDT with "leverage 50" with 18% of your asset !!!

BUY NEONEO is one of the best Alts in crypto market. I expect a good uptrend in coming weeks for this coin.
Ehsan.F
