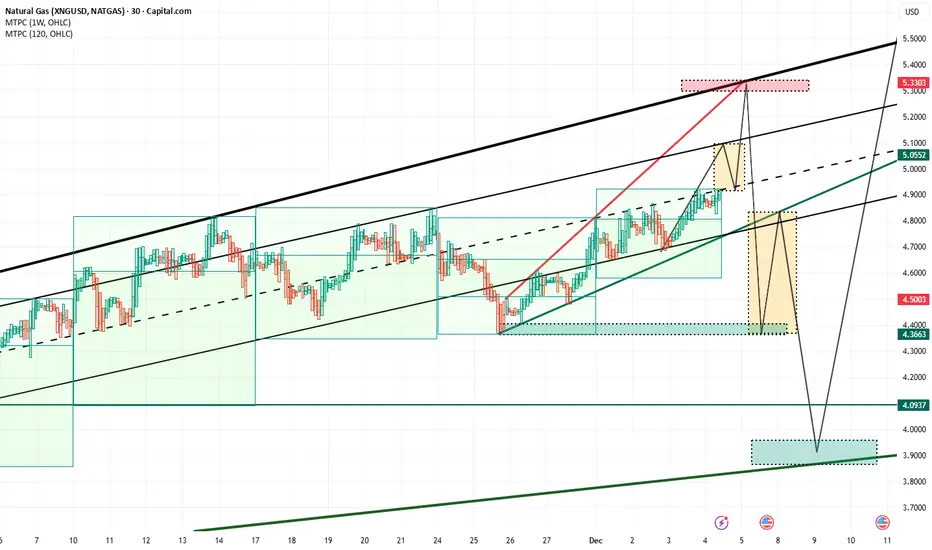
Weekly reverse CandleA push toward the upper channel boundary and the key resistance area at 5.30–5.33 USD remains the dominant scenario. An interim dip is possible on the way up, with a potential retracement forming anywhere between 5.08 and 4.92 USD.
If the price reaches the 5.30–5.33 USD zone on Friday and gets rejec
About Natural Gas (Henry Hub)
Natural Gas (NGAS) is a fossil fuel formed from plants and animals buried underground and exposed to extreme heat and pressure. Natural gas is used domestically for cooking, as a power source, in agriculture, and in industrial manufacturing. Natural gas prices fluctuate constantly depending mainly on production issues, stockpiles, weather conditions, economic growth, crude oil prices, and more recently coal. Natural gas is commonly measured in MMBtu, with 1 MMBTu equaling 1 million BTU (British Thermal Units).
Natural Gas Analysis- Although the seasonality is bullish for NG (due to Dec–Jan peak demand) and there’s a ~70% probability of December closing higher than Nov, with historical average gains of 15–25%.
- However, based on the 2-week chart, it is observed that price has already front-run winter demand
- It has recent

the Big Picture, and the next Friday weekly HammerFrom a technical perspective, Natural Gas is nearing a high-conviction inflection point. The weekly hammer that will be formed into Friday’s close (12.12.2025) indicates a potential shift in market structure following the optimal accumulation zone around 4.9. This configuration favors a sharp, impul
Natural Gas Price Nears Three-Year High in Early DecemberNatural Gas Price Nears Three-Year High in Early December
In mid-November, analysing the XNG/USD chart, we noted a rise in natural gas prices, outlined a system of trend channels, and suggested a possible pullback scenario.
Indeed, since then (as indicated by the arrow), U.S. gas prices retreated


Natural Gas Wave Analysis – 25 November 2025
- Natural Gas falling inside impulse wave (1)
- Likely to fall to support level 4.200
Natural Gas recently reversed from resistance area between the long-term resistance level 4.800 (former top of the shooting star from May) and the upper daily Bollinger Band.
This resistance area was further st

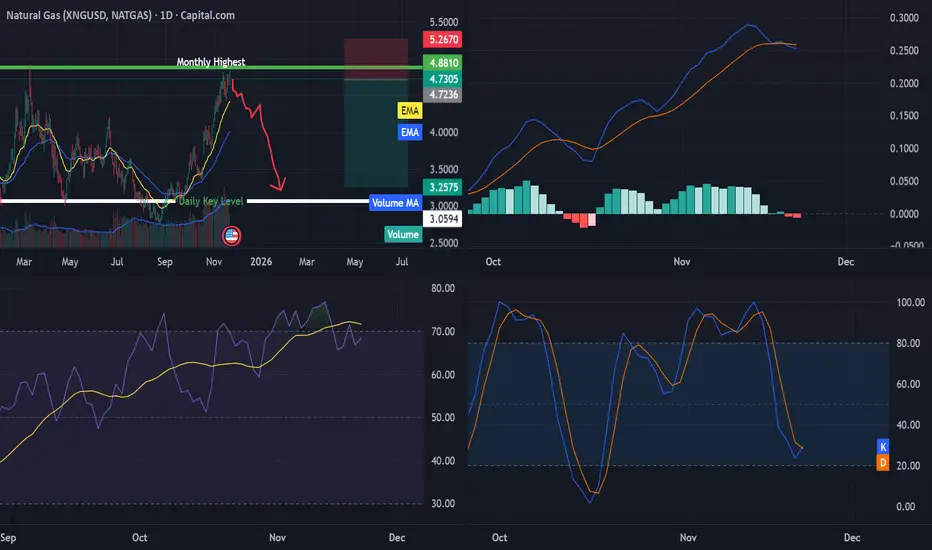
Natural Gas (NG) – Multi-Timeframe Technical AnalysisNatural Gas (NG) – Multi-Timeframe Technical Analysis
Monthly (1M)
Price has pushed into the 4.80 zone, which corresponds to the previous major monthly high. The last three monthly candles are bullish, showing strong upward momentum, but NG is now entering a significant historical resistance area.
History might repeat itself on Natural GasNatural Gas in a breakout. Just a potential scenario to look for.

LNG: $5 Jan. Futures as Cold Snap & Record Exports Drain Storage* Due to the platform's features, the charts are arranged in sequence from left to right, from the first to the ninth chart. The charts were created by our team and based on an analysis from Bloomberg and the EIA data. This analysis was conducted in cooperation with Anastasia Volkova, analyst of LSE

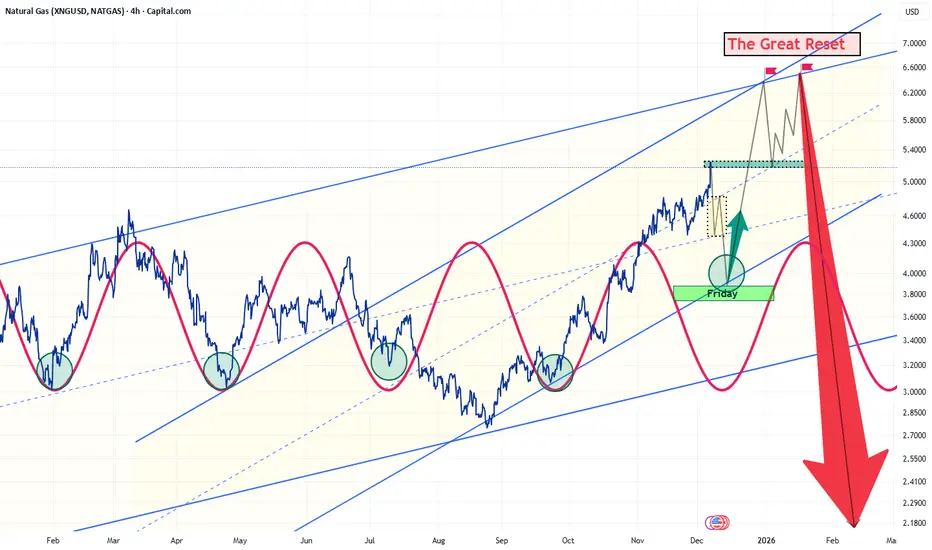
Multi-Cycle Alignment Points to Sharp DownturnThe chart presents a sophisticated multi-cycle composite model overlaid on the prevailing Natural Gas trend. Notably, all four cycles will converge during the January–February 2026 window, creating a concentrated alignment that signals the likely emergence of the second major peak.
When multiple cy

See all ideas
Displays a symbol's price movements over previous years to identify recurring trends.