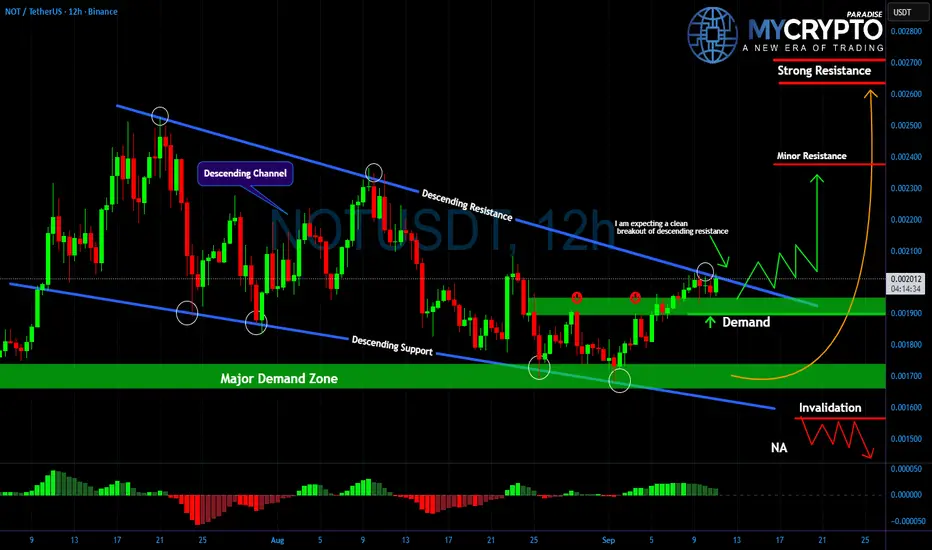
NOTUSDT: Silent Accumulation Before the Next Big BreakoutYello, Paradisers are you paying attention to what’s happening on NOT right now? While most traders are distracted, the price action has been quietly building pressure inside a textbook descending channel, and the breakout signs are now impossible to ignore.
💎After several weeks of heavy compressio
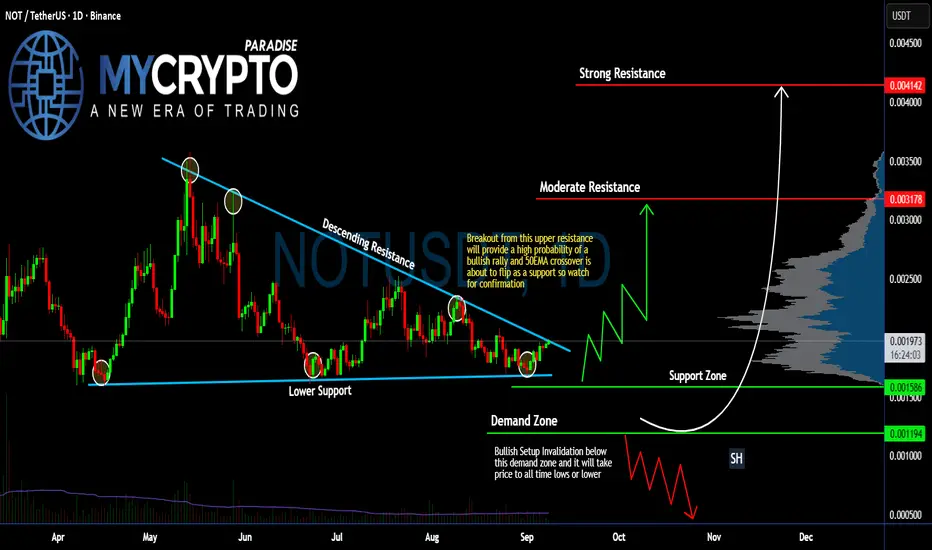
#NOT Ready to Make Massive Bullish Move | Must Watch for Bulls Yello, Paradisers! Is #NOTcoin about to explode into a bullish breakout, or is this just the calm before a brutal shakeout? Let’s break it down on #NOTUSDT:
💎After months of consolidation, #NOT has been trading inside a descending triangle, with clear descending resistance pressing price down and l
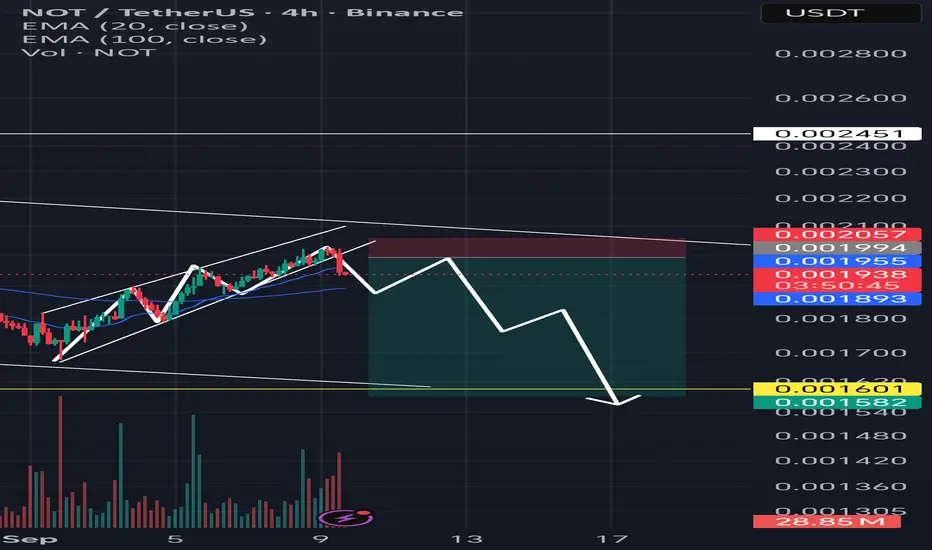
Notcoin chart update!!Hello everyone
I expected that price break the trendline
So it did it.
Now any trying to going up is pullback
But remember there is no certain in trade
I expect the price to go back up.
I'm waiting to see signs of a pullback.
Otherwise, I will not enter the position.
Explanation of the Basic Trading Strategy
Hello, fellow traders!
Follow me to get the latest information quickly.
Have a great day.
-------------------------------------
To understand the charts, the basic trading strategy is the concept used.
Let's look at an example.
---------------------------------------------------------
The OB
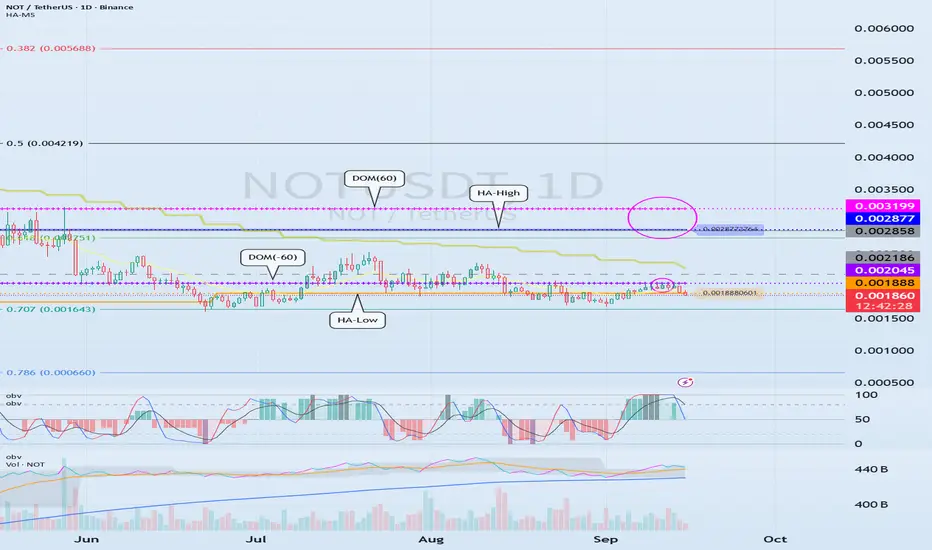
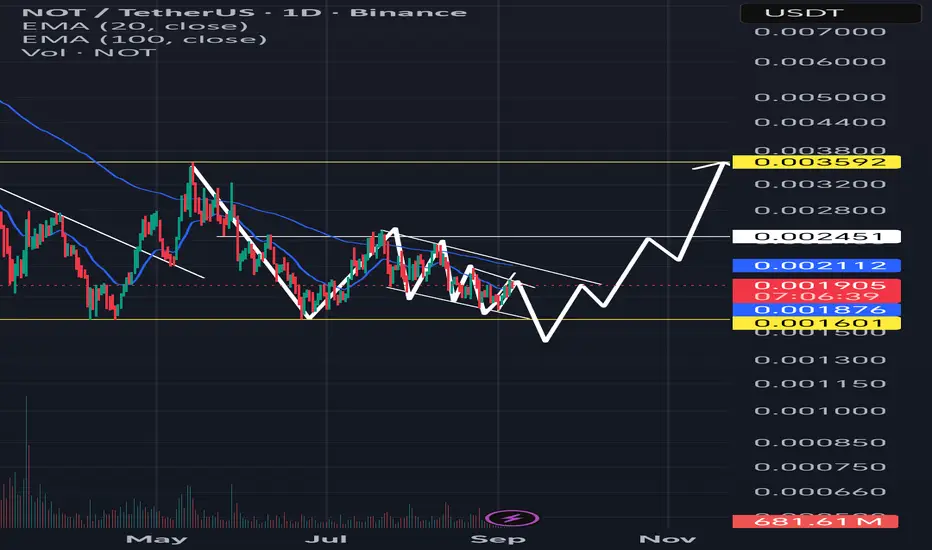
NOTUSDT 1D idea!!Hello everyone
I think notcoin has a liquidity level at 0.0016 that needs to hunt
Because everyone thoughts 0.0016 is strong support and their SL is under that level
Before strat rally to ATH,price will hunt their SL and start going up.
I'll be waiting for that moment
My entery=other's SL
NOTUSDT 4H ANALYSIS!! Hello everyone
according to notcoin chart, A dubble top formed here.
As i expect notcoin price get low, this pattern gives more credence to my previous analysis.
If price break trend line, we can enter a short position on it's pullback
I'm analyzing step by step nothing is certain.
If it fails,

NOT 1D Analysis – Key Triggers Ahead💀 Hey , how's it going ? Come over here — Satoshi got something for you !
⏰ We’re analyzing NOTCOIN on the 1-DAY timeframe timeframe .
👀 On the daily timeframe of Notcoin, we can see that Notcoin is one of Telegram’s well-known airdrops, and many Telegram users got familiar with Notcoin through it
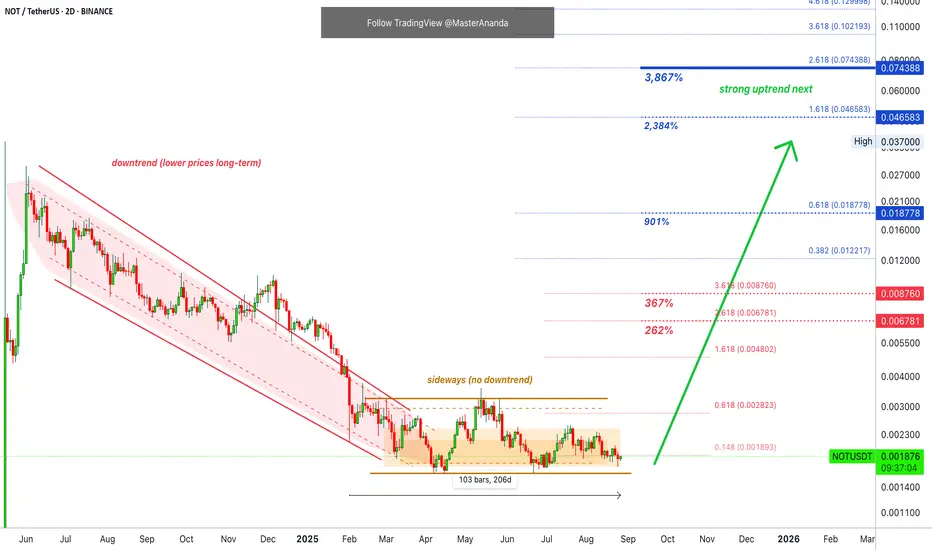
Notcoin · Futures Trading Trade-NumbersNotcoin is doing great right now, truly, trading at bottom prices/the opportunity buy zone. It has now been 205 days with NOTUSDT moving sideways.
The current price range has been active only twice, ever in the life of this project, and briefly. Between late June and early July, and also in April.
not usdt bazi mikonim Price (USD)
0.032 ┤ 🎯 Final Short-term Target
0.025 ┤ ⚡ Resistance / Mid-term Target
0.020 ┤ 🎯 Mid-term Target
0.015 ┤ 🎯 Short-term Target
0.0020 ┤━━━━━━ 🔹 Current Price / Strong Support
Attention Whales 🚨
Notcoin (NOT) is tra

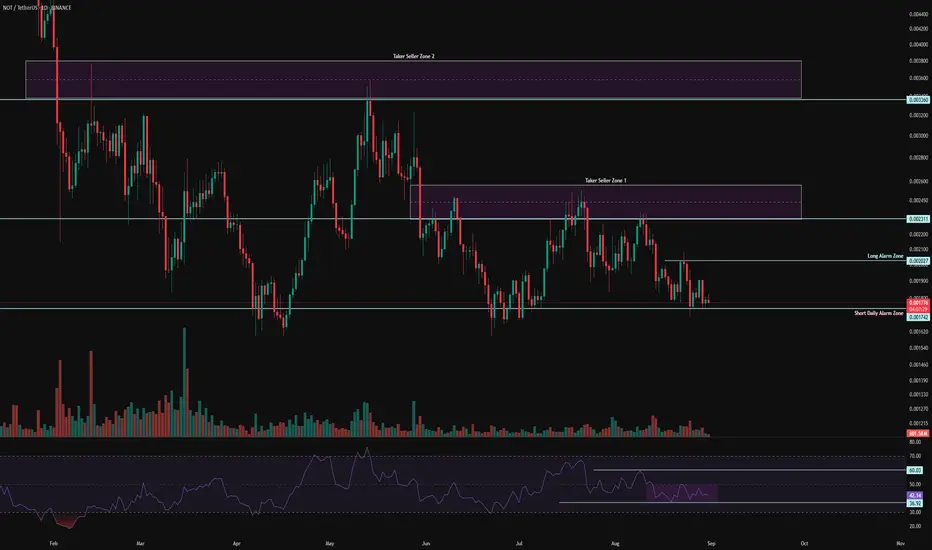
NOTUSDT — Descending Triangle Support! Breakout or Breakdown?Currently, NOT/USDT is trading at a decisive point after a long downtrend. The chart clearly forms a Descending Triangle, a classic pattern that often signals bearish continuation, but under certain conditions can turn into a bullish reversal if a strong breakout occurs.
---
🔎 Pattern & Context
See all ideas
Summarizing what the indicators are suggesting.
Oscillators
Neutral
SellBuy
Strong sellStrong buy
Strong sellSellNeutralBuyStrong buy
Oscillators
Neutral
SellBuy
Strong sellStrong buy
Strong sellSellNeutralBuyStrong buy
Summary
Neutral
SellBuy
Strong sellStrong buy
Strong sellSellNeutralBuyStrong buy
Summary
Neutral
SellBuy
Strong sellStrong buy
Strong sellSellNeutralBuyStrong buy
Summary
Neutral
SellBuy
Strong sellStrong buy
Strong sellSellNeutralBuyStrong buy
Moving Averages
Neutral
SellBuy
Strong sellStrong buy
Strong sellSellNeutralBuyStrong buy
Moving Averages
Neutral
SellBuy
Strong sellStrong buy
Strong sellSellNeutralBuyStrong buy
Displays a symbol's price movements over previous years to identify recurring trends.