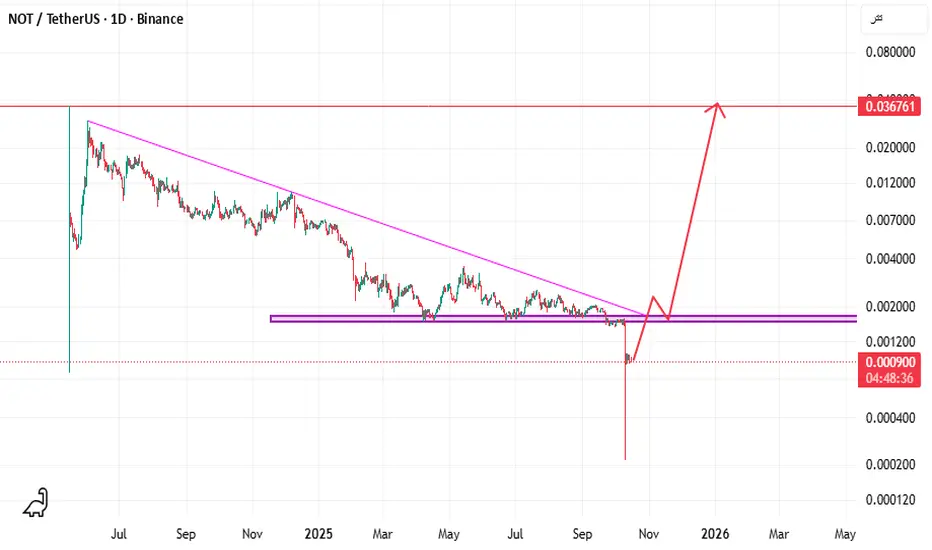
NOT/USDT PUMP IN COMING!NOT/USDT PUMP IN COMING!
Buy The dip NOTCOIN
Notcoin is now good for long-term investment with the goal specified in the image, be careful not to miss it.
NOTUSDT 1D#NOT is trading within a falling wedge pattern on the daily chart. In case of a breakout above the wedge resistance and the daily SMA50, the potential targets are:
🎯 $0.001908
🎯 $0.002183
🎯 $0.002406
🎯 $0.002628
🎯 $0.002944
🎯 $0.003347
⚠️ Always remember to use a tight stop-loss and maintain prope

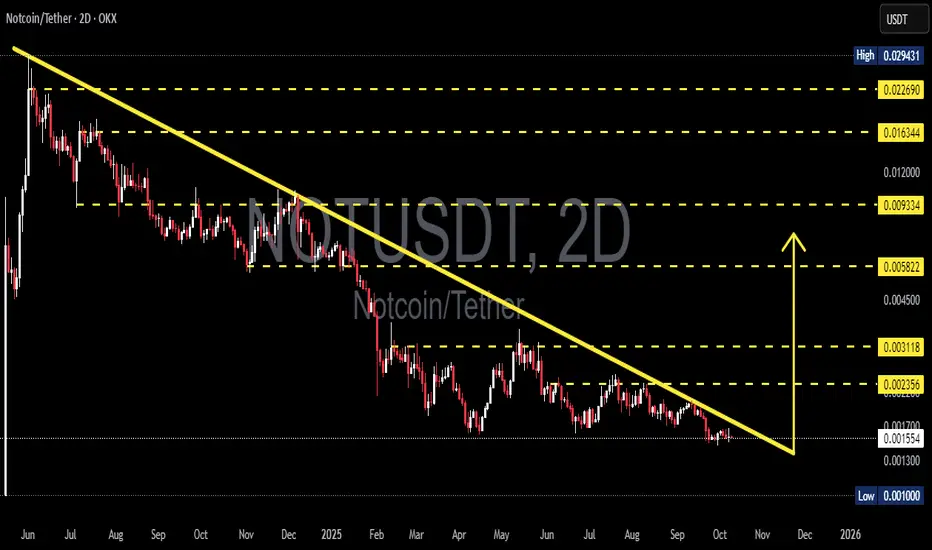
NOT/USDT — Descending Triangle: One Move Away from Expansion?The 2D chart of NOT/USDT reveals a descending triangle formation — a classic compression pattern signaling that the market is reaching a major decision point. For months, price action has been trapped under a falling trendline (yellow), forming a series of lower highs, while buyers continue to defen
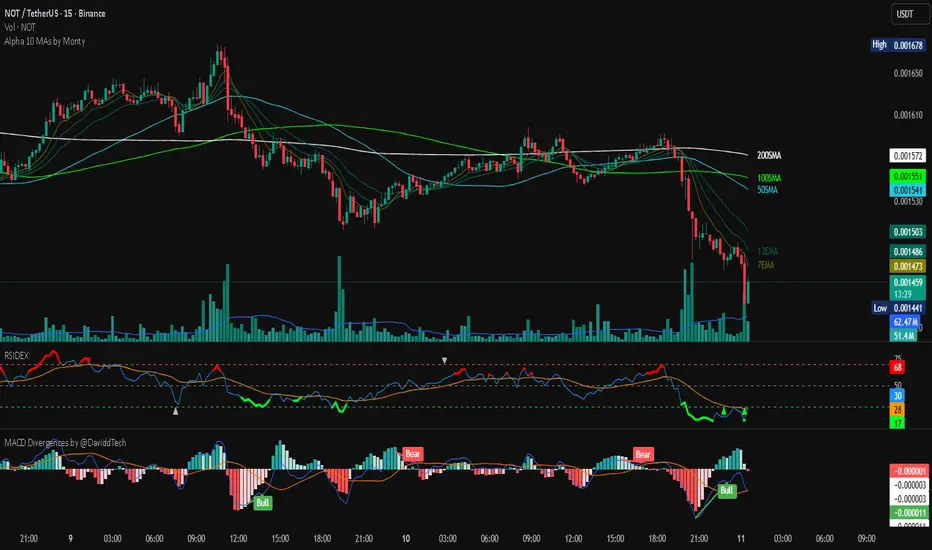
notusdt, bullish diversionnot is making clear bullish diversion on RSI and MACD on most TF, daily, 4hrly and 15 min chart. Trying to hold the drop of btc, as soon as btc stables it will show good gains.
NOT - 10% UP - TP4 HITI forgot this one: #NOT + 10% up from the range low 🔥
TP4 HIT ✅
32/33 Win trade yesterday on my personnal scalp strategy✅🏆
Absurd!!!
Follow for more! I'll share soon! 👍💥

NOTCOIN; BUY SIGNALHello friends
Given that the price has reached the specified support and the price is supported by buyers and the specified resistance has been broken, we can buy in steps with risk and capital management and move to the specified targets.
*Trade safely with us*

NOTUSDTI waiting for breakout of trendline for buy. So is 0.001650 key-levels and 0.001800$ next level for breakout and buy.
Please control risk management because BINANCE:NOTUSDT
IN is meme_coin in crypto.

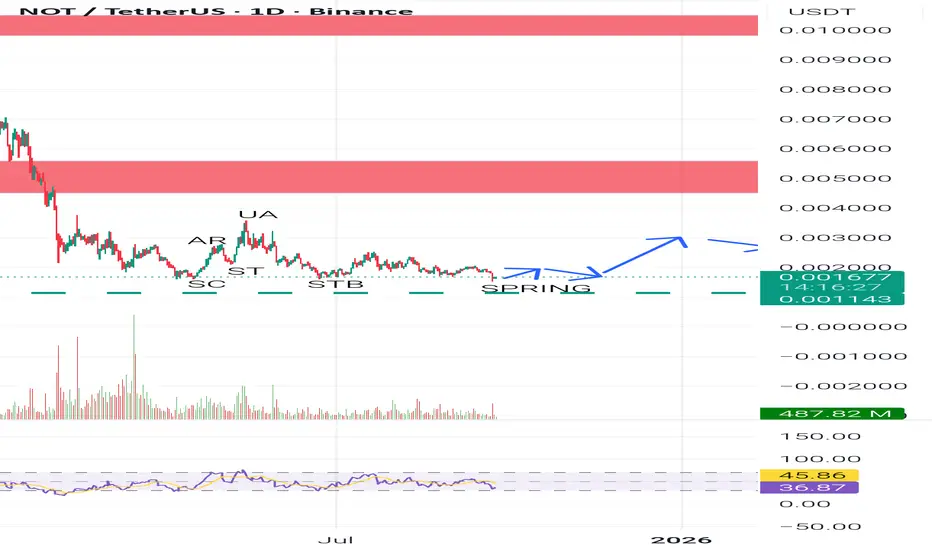
NOT USDTAfter a long downtrend, we see weakness in the downtrend. Looking at the patterns made by the trend, we can conclude that the Wyckoff pattern is being executed

NOT USDTAfter a long downtrend, we see weakness in the downtrend. Looking at the patterns made by the trend, we can conclude that the Wyckoff pattern is being executed.
Notcoin 4H UPDATE!!!! Hello everyone
As i expected notcoin hunt the0.0016 level.
I had placed long order at that level
It's activated now.
But for more safety, i entered with leverage 5.i don't wanna miss this opportunity for more greed😅
Best of luck to all traders.

See all ideas
Summarizing what the indicators are suggesting.
Oscillators
Neutral
SellBuy
Strong sellStrong buy
Strong sellSellNeutralBuyStrong buy
Oscillators
Neutral
SellBuy
Strong sellStrong buy
Strong sellSellNeutralBuyStrong buy
Summary
Neutral
SellBuy
Strong sellStrong buy
Strong sellSellNeutralBuyStrong buy
Summary
Neutral
SellBuy
Strong sellStrong buy
Strong sellSellNeutralBuyStrong buy
Summary
Neutral
SellBuy
Strong sellStrong buy
Strong sellSellNeutralBuyStrong buy
Moving Averages
Neutral
SellBuy
Strong sellStrong buy
Strong sellSellNeutralBuyStrong buy
Moving Averages
Neutral
SellBuy
Strong sellStrong buy
Strong sellSellNeutralBuyStrong buy
Displays a symbol's price movements over previous years to identify recurring trends.