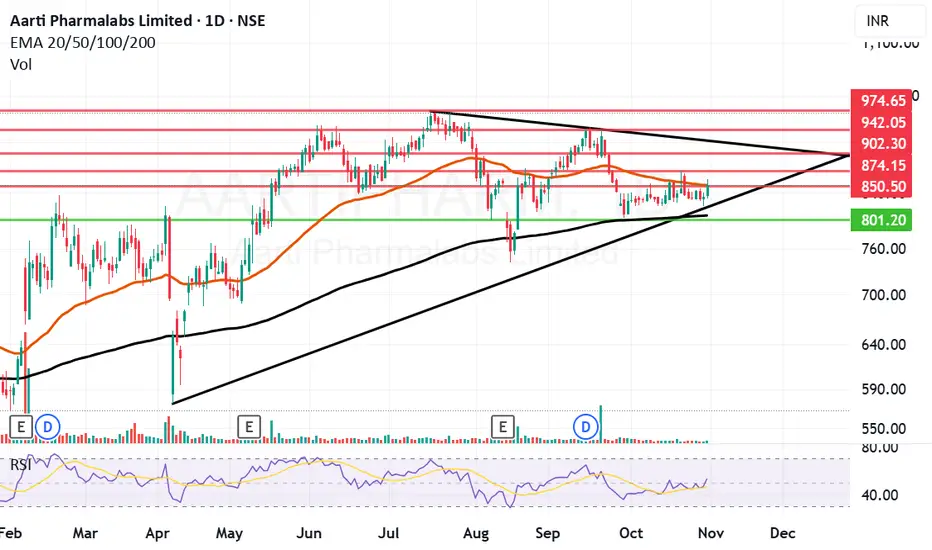
Aarti Pharmalabs trying to breakout after consolidation?Aarti Pharmalabs Ltd. engages in the manufacture and sale of pharmaceutical and nutraceutical products. It offers active pharmaceutical ingredients, pharmaceutical intermediates, new chemical entities, and xathine derivatives.
Aarti Pharmalabs Closing price is 851.95. The positive aspects of the company are Annual Net Profits improving for last 2 years, Companies with Low Debt and FII / FPI or Institutions increasing their shareholding. The Negative aspects of the company are high Valuation (P.E. = 26), High promoter stock pledges, Declining Net Cash Flow: Companies not able to generate net cash, Promoter decreasing their shareholding, Companies with growing costs YoY for long term projects and MFs decreased their shareholding last quarter.
The momentum in the stock can built if there is a closing above 851 Historical Resistance in the stock will be 874 and 902. PEAK Historic Resistance in the stock will be 942 and 974. Stop loss in the stock should be maintained at Closing below 801.
Disclaimer: The above information is provided for educational purpose, analysis and paper trading only. Please don't treat this as a buy or sell recommendation for the stock or index. The Techno-Funda analysis is based on data that is more than 3 months old. Supports and Resistances are determined by historic past peaks and Valley in the chart. Many other indicators and patterns like EMA, RSI, MACD, Volumes, Fibonacci, parallel channel etc. use historic data which is 3 months or older cyclical points. There is no guarantee they will work in future as markets are highly volatile and swings in prices are also due to macro and micro factors based on actions taken by the company as well as region and global events. Equity investment is subject to risks. I or my clients or family members might have positions in the stocks that we mention in our educational posts. We will not be responsible for any Profit or loss that may occur due to any financial decision taken based on any data provided in this message. Do consult your investment advisor before taking any financial decisions. Stop losses should be an important part of any investment in equity.
Trade ideas
Aarati Negative The company's recent quarterly results (Q1 FY26) showed a significant drop in key financial metrics.
Aarti pharma Aarti pharma is in organic uptrend. Looking good at cmp for a positional hold! Expecting target of 995.

AARTI PHARMALABS LTD S/R Support and Resistance Levels:
Support Levels: These are price points (green line/shade) where a downward trend may be halted due to a concentration of buying interest. Imagine them as a safety net where buyers step in, preventing further decline.
Resistance Levels: Conversely, resistance levels (red line/shade) are where upward trends might stall due to increased selling interest. They act like a ceiling where sellers come in to push prices down.
Breakouts:
Bullish Breakout: When the price moves above resistance, it often indicates strong buying interest and the potential for a continued uptrend. Traders may view this as a signal to buy or hold.
Bearish Breakout: When the price falls below support, it can signal strong selling interest and the potential for a continued downtrend. Traders might see this as a cue to sell or avoid buying.
20 EMA (Exponential Moving Average):
Above 20 EMA(50 EMA): If the stock price is above the 20 EMA, it suggests a potential uptrend or bullish momentum.
Below 20 EMA: If the stock price is below the 20 EMA, it indicates a potential downtrend or bearish momentum.
Trendline: A trendline is a straight line drawn on a chart to represent the general direction of a data point set.
Uptrend Line: Drawn by connecting the lows in an upward trend. Indicates that the price is moving higher over time. Acts as a support level, where prices tend to bounce upward.
Downtrend Line: Drawn by connecting the highs in a downward trend. Indicates that the price is moving lower over time. It acts as a resistance level, where prices tend to drop.
Disclaimer:
I am not a SEBI registered. The information provided here is for learning purposes only and should not be interpreted as financial advice. Consider the broader market context and consult with a qualified financial advisor before making investment decisions.

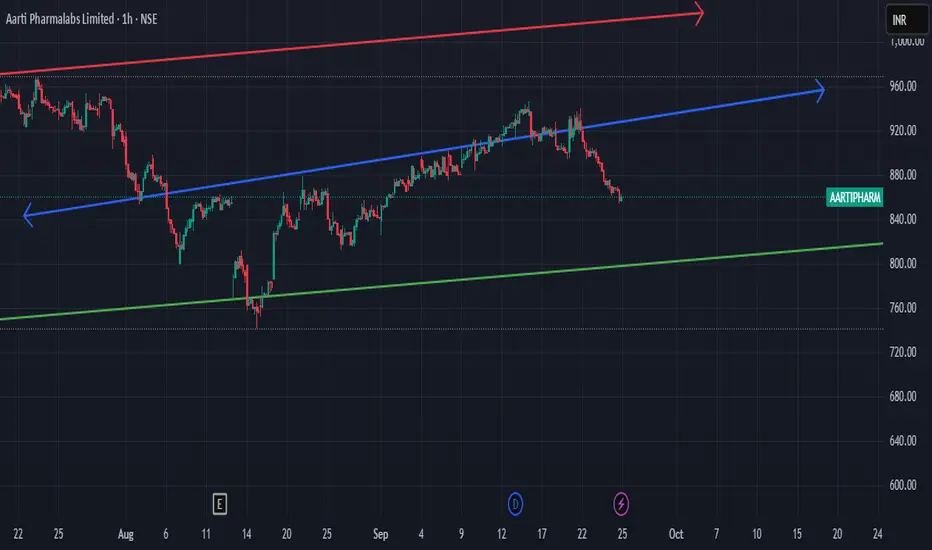
Arti Pharma - Good base The levels and logic for buy trade is given...Even with Overall market is weak. this stock is holding its gain. Poised to give bo above buy levels

$aartipharmabounce or die zone here
added since my earlier entry was messed up on it and i recon this should run it back so long term play for me
close below H4 200 ema no bueno and opens up the door for red line below

Aarti Pharma labs-Nice BreakoutAarti Pharma labs-Nice Breakout
Capital to be deployed -20k
Investing Price-675-685
Breakout Price -669
Stoploss -559
Targets -1150
#chennai #StockMarketindia #StockToWatch #StocksInFocus #stockstowatch #StocksToTrade
#aartipharmalabs

Darvas Box Strategy - Breakout StockDisclaimer: I am Not SEBI Register adviser, please take advise from your financial adviser before investing in any stocks.
Stock has given break out , buy above the High and do not forget to keep stop loss best suitable for swing trading. Keep this stock in watch list.
Target and Stop loss Shown on Chart. As stop loss is Big we keep Target 1:1
Be Discipline, because discipline is the key to Success in Stock Market.
Trade what you See Not what you Think.

Aarti Pharmalabs Limited (APL) BreakoutSector: Pharmaceuticals
Industry: Pharmaceuticals - Indian - Bulk Drugs & Formln
Median PE:-34.9
EPS in Rs:-24.86
NOTE:-
All the information provided is for educational and informational purposes only. .
I am NOT a SEBI registered advisor or a financial adviser.

AARTIPHARMSupport and Resistance Levels: In technical analysis, support and resistance levels are significant price levels where buying or selling interest tends to be strong. They are identified based on previous price levels where the price has shown a tendency to reverse or find support.

Aarti Pharmalabs Ltd
TARGET AND STOPLOSS IN CHART
Market Cap
₹ 4,170 Cr.
Current Price
₹ 460
High / Low
₹ 476 / 235
Stock P/E
22.0
Book Value
₹ 183
Dividend Yield
0.00 %
ROCE
16.1 %
ROE
13.2 %
Face Value
₹ 5.00
Promoter holding
46.3 %
EPS last year
₹ 21.4
EPS latest quarter
₹ 5.72
Debt
₹ 207 Cr.
Pledged percentage
0.00 %
Net CF
₹ -58.3 Cr.
Price to Cash Flow
15.8
Free Cash Flow
₹ 143 Cr.
Debt to equity
0.12
OPM last year
17.6 %
Reserves
₹ 1,612 Cr.
Price to book value
2.51
Int Coverage
14.2
Price to Sales
2.25

📈 Analysis of AARTIPHARM: A Bullish Opportunity Awaits? 📈Hello, fellow traders! 👋
Today's spotlight is on AARTIPHARM . After closely observing its four-hour time frame, here's what caught my attention:
1️⃣ Major Trend: The stock is confidently striding in an upward direction. Each stride it takes, it glances back at its support, reassuring itself before surging upwards again.
2️⃣ Pattern Recognition: The recurring 'higher high' formation suggests a consistent bullish behavior.
3️⃣ Support Check: It's gearing up to greet its support level once again. A friendly wave or a hug? Let's find out!
4️⃣ Moving Average: The 200-day moving average is waving right at its entry price. A potential bullish beacon?
5️⃣ Upward Direction: This can be the wind beneath our trading wings, providing additional strength for our strategies.
🚀 Takeaway: All these factors hint towards a trade opportunity that we might not want to miss. But as always, tread with caution and ensure your research backs your moves.
❓ Your Thoughts: Have you been tracking AARTIPHARM? What's your take on its current position? Drop your insights below!
🔔 Stay Tuned: I'll be back with more insights and analyses. Don't forget to follow for timely updates.
Until the next trade, keep those charts ringing and strategies sharp! 📊
Warm regards,
Alpha Trading Station


Base on Base breakout the stock retested after a base-on-base consolidation, the stock broke out with huge volume and decent fallow up with good volume is a good sign to enter the stock.
