ADANI PORTS S/R for 4/10/24Support and Resistance Levels:
Support Levels: These are price points (green line/shade) where a downward trend may be halted due to a concentration of buying interest. Imagine them as a safety net where buyers step in, preventing further decline.
Resistance Levels: Conversely, resistance levels (red line/shade) are where upward trends might stall due to increased selling interest. They act like a ceiling where sellers come in to push prices down.
Breakouts:
Bullish Breakout: When the price moves above resistance, it often indicates strong buying interest and the potential for a continued uptrend. Traders may view this as a signal to buy or hold.
Bearish Breakout: When the price falls below support, it can signal strong selling interest and the potential for a continued downtrend. Traders might see this as a cue to sell or avoid buying.
20 EMA (Exponential Moving Average):
Above 20 EMA(50 EMA): If the stock price is above the 20 EMA, it suggests a potential uptrend or bullish momentum.
Below 20 EMA: If the stock price is below the 20 EMA, it indicates a potential downtrend or bearish momentum.
Trendline: A trendline is a straight line drawn on a chart to represent the general direction of a data point set.
Uptrend Line: Drawn by connecting the lows in an upward trend. Indicates that the price is moving higher over time. Acts as a support level, where prices tend to bounce upward.
Downtrend Line: Drawn by connecting the highs in a downward trend. Indicates that the price is moving lower over time. It acts as a resistance level, where prices tend to drop.
RSI: RSI readings greater than the 70 level are overbought territory, and RSI readings lower than the 30 level are considered oversold territory.
Combining RSI with Support and Resistance:
Support Level: This is a price level where a stock tends to find buying interest, preventing it from falling further. If RSI is showing an oversold condition (below 30) and the price is near or at a strong support level, it could be a good buy signal.
Resistance Level: This is a price level where a stock tends to find selling interest, preventing it from rising further. If RSI is showing an overbought condition (above 70) and the price is near or at a strong resistance level, it could be a signal to sell or short the asset.
Disclaimer:
I am not a SEBI registered. The information provided here is for learning purposes only and should not be interpreted as financial advice. Consider the broader market context and consult with a qualified financial advisor before making investment decisions.
Trade ideas

Adaniports Ltd view for Intraday 12th September #ADANIPORTS Adaniports Ltd view for Intraday 12th September #ADANIPORTS
Buying may witness above 1453
Support area 1430. Below ignoring buying momentum for intraday
Selling may witness below 1411
Resistance area 1430
Above ignoring selling momentum for intraday
Charts for Educational purposes only.
Please follow strict stop loss and risk reward if you follow the level.
Thanks,
V Trade Point

ADANIPORTS SELL SIDE - FLAGAdani Port has formed a flag pattern on the sell side in the 30-minute chart, indicating a potential continuation of the downtrend. This bearish flag pattern suggests that the stock may experience a further decline in price, making it a sell signal for traders.

Adaniports view for Intraday 27th August#ADANIPORTS
Adaniports view for Intraday 27th August
Buying may witness above 1493
Support area 1475. Below ignoring buying momentum for intraday
Selling may witness below 1475
Resistance area 1493
Above ignoring selling momentum for intraday
Charts for Educational purposes only.
Please follow strict stop loss and risk reward if you follow the level.
Thanks,
V Trade Point

ADANI PORT & SEZ LTDSupport and Resistance Levels:
Support Levels: These are price points (green line/share) where a downward trend may be halted due to a concentration of buying interest. Imagine them as a safety net where buyers step in, preventing further decline.
Resistance Levels: Conversely, resistance levels (red line/shade) are where upward trends might stall due to increased selling interest. They act like a ceiling where sellers come in to push prices down.
Breakouts:
Bullish Breakout: When the price moves above resistance, it often indicates strong buying interest and the potential for a continued uptrend. Traders may view this as a signal to buy or hold.
Bearish Breakout: When the price falls below support, it can signal strong selling interest and the potential for a continued downtrend. Traders might see this as a cue to sell or avoid buying.
20 EMA (Exponential Moving Average):
Above 20 EMA: If the stock price is above the 20 EMA, it suggests a potential uptrend or bullish momentum.
Below 20 EMA: If the stock price is below the 20 EMA, it indicates a potential downtrend or bearish momentum.
Disclaimer:
I am not a SEBI registered. The information provided here is for learning purposes only and should not be interpreted as financial advice. It's important to remember that while these indicators can be useful, they are not foolproof. Always consider the broader market context and consult with a qualified financial advisor before making any investment decisions.

ADANIPORTS INR 1,587.85 TO 19,689 INR IN 12 YEAR FORWARDSGot bored today ! thinking of doing some analysis reports for Adani ports curiously He ha :)

Adani Ports Approaching Key Resistance Level
Adani Ports is nearing a crucial resistance at 1613.50.
Potential bullish breakout observed.
Strong uptrend sustained since October 2023.
Positive Q1 results could fuel further upward momentum.
RSI close to 70, indicating strength but approaching overbought territory.


Adaniports Intraday level for 24th July #ADANIPORTS Adaniports Intraday level for 24th July #ADANIPORTS
Buying may witness above 1517
Support area 1500. Below ignoring buying momentum for intraday
Charts for Educational purposes only.
Please follow strict stop loss and risk reward if you follow the level.
Thanks,
V Trade Point

Review and plan for 8th July 2024Nifty future and banknifty future analysis and intraday plan in kannada. Stocks to watch included.
This video is for information/education purpose only. you are 100% responsible for any actions you take by reading/viewing this post.
please consult your financial advisor before taking any action.
----Vinaykumar hiremath, CMT

ADANI PORTSIt appears that Adani Ports is currently approaching the support level of 1450. It is expected to experience an upward movement from this level.

ADANI PORTS S/R Support and Resistance Levels: In technical analysis, support and resistance levels are significant price levels where buying or selling interest tends to be strong. They are identified based on previous price levels where the price has shown a tendency to reverse or find support.
Support levels are represented by the green line and green shade, indicating areas where buying interest may emerge to prevent further price decline.
Resistance levels are represented by the red line and red shade, indicating areas where selling pressure may arise to prevent further price increases. Traders often consider these levels as potential buying or selling opportunities.
Breakouts: Breakouts occur when the price convincingly moves above a resistance level (red shade) or below a support level (green shade). A bullish breakout above resistance suggests the potential for further price increases, while a bearish breakout below support suggests the potential for further price declines. Traders pay attention to these breakout signals as they may indicate the start of a new trend or significant price movement.
Disclosure: I am not SEBI registered. The information provided here is for learning purposes only and should not be interpreted as financial advice. It is important to consult with a qualified financial advisor before making any investment decisions. Tweets neither advice nor endorsement.

ADANI PORTS S/R for 18/6/34Support and Resistance Levels: In technical analysis, support and resistance levels are significant price levels where buying or selling interest tends to be strong. They are identified based on previous price levels where the price has shown a tendency to reverse or find support.
Support levels are represented by the green line and green shade, indicating areas where buying interest may emerge to prevent further price decline.
Resistance levels are represented by the red line and red shade, indicating areas where selling pressure may arise to prevent further price increases. Traders often consider these levels as potential buying or selling opportunities.
Breakouts: Breakouts occur when the price convincingly moves above a resistance level (red shade) or below a support level (green shade). A bullish breakout above resistance suggests the potential for further price increases, while a bearish breakout below support suggests the potential for further price declines. Traders pay attention to these breakout signals as they may indicate the start of a new trend or significant price movement.
Disclosure: I am not SEBI registered. The information provided here is for learning purposes only and should not be interpreted as financial advice. It is important to consult with a qualified financial advisor before making any investment decisions. Tweets neither advice nor endorsement.

sell at zone - intraday
- expecting small fall from this level
ENTRY
- entry can be taken in two ways
1. place sell order at limit price , marked 0.58 level
2. look for selling confirmation in smaller time frame inside the zone.
STOP LOSS
- if candle close is above 0.618 level.
TARGET
- mark fib retracement from C to latest swing high
- TGT - 0.236

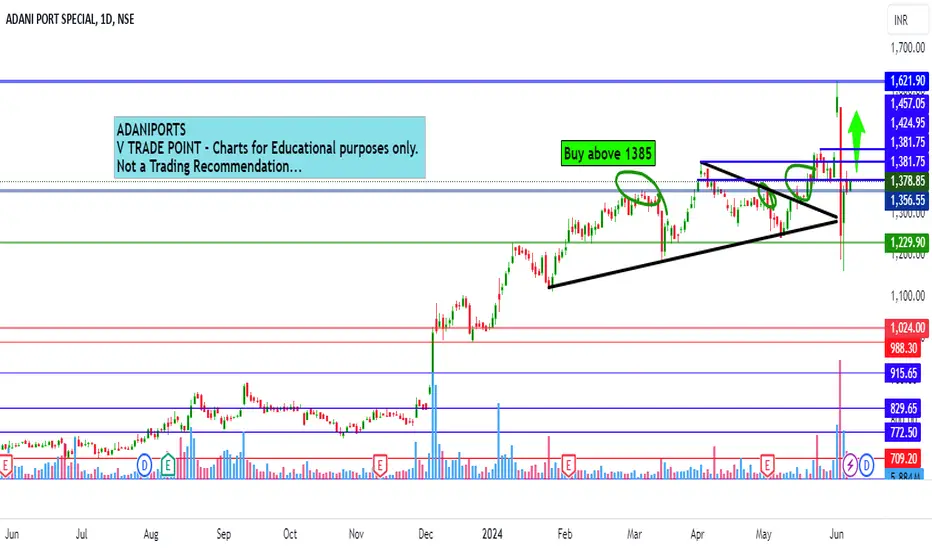
Adaniports Intraday level for today for 10th JuneAdaniports Intraday level for today #ADANIPORTS
Buying opportunity above 1385
Stop Loss area 1372
Charts for Educational purposes only.
Please follow strict stop loss and risk reward if you follow the level.
Thanks,
V Trade Point
ADANI PORTS S/R Support and Resistance Levels: In technical analysis, support and resistance levels are significant price levels where buying or selling interest tends to be strong. They are identified based on previous price levels where the price has shown a tendency to reverse or find support.
Support levels are represented by the green line and green shade, indicating areas where buying interest may emerge to prevent further price decline.
Resistance levels are represented by the red line and red shade, indicating areas where selling pressure may arise to prevent further price increases. Traders often consider these levels as potential buying or selling opportunities.
Breakouts: Breakouts occur when the price convincingly moves above a resistance level (red shade) or below a support level (green shade). A bullish breakout above resistance suggests the potential for further price increases, while a bearish breakout below support suggests the potential for further price declines. Traders pay attention to these breakout signals as they may indicate the start of a new trend or significant price movement.
Disclosure: I am not SEBI registered. The information provided here is for learning purposes only and should not be interpreted as financial advice. It is important to consult with a qualified financial advisor before making any investment decisions. Tweets neither advice nor endorsement.

Adaniports. Will price retrace back to these levels?The election news and outcome have all the Adani group stocks correct more than 20% in a day. There is a possibility of this stock correcting further towards these demand levels.

Intraday levels for today 04th June 2024 #ADANIPORTS Intraday levels for today 04th June 2024 #ADANIPORTS
Buying opportunity above 1602
Support area around 1575-1580
Charts for Educational purposes only.
Not a Trading opportunity
Follow strict risk reward and stop loss if you follow the levels
Thanks,
V Trade Point

ADANI PORTS S/R for 4/6/24Support and Resistance Levels: In technical analysis, support and resistance levels are significant price levels where buying or selling interest tends to be strong. They are identified based on previous price levels where the price has shown a tendency to reverse or find support.
Support levels are represented by the green line and green shade, indicating areas where buying interest may emerge to prevent further price decline.
Resistance levels are represented by the red line and red shade, indicating areas where selling pressure may arise to prevent further price increases. Traders often consider these levels as potential buying or selling opportunities.
Breakouts: Breakouts occur when the price convincingly moves above a resistance level (red shade) or below a support level (green shade). A bullish breakout above resistance suggests the potential for further price increases, while a bearish breakout below support suggests the potential for further price declines. Traders pay attention to these breakout signals as they may indicate the start of a new trend or significant price movement.
Disclosure: I am not SEBI registered. The information provided here is for learning purposes only and should not be interpreted as financial advice. It is important to consult with a qualified financial advisor before making any investment decisions. Tweets neither advice nor endorsement.

ADANI PORTS - Ready to Move to next upper Trajectory?The stock on its upper trajectory faced a price rejection around 1425 levels and it was driven down to below the 50 DMA levels. From there it took support and then started recovering. Recently there was an attempt to take out the price rejection zone but that move did not succeed and it was pushed back to test the price rejection zone. Now it is again attempting to take out the rejection zone. We can see increasing momentum and also the relative strength is positive. The money flow needs to become positive. We can see some increase in the volume as well. Now this stock is likely to succeed in taking out the rejection zone. A good close above 1457 would take it to the next upper trajectory.

ADANI PORTS S/R Support and Resistance Levels: In technical analysis, support and resistance levels are significant price levels where buying or selling interest tends to be strong. They are identified based on previous price levels where the price has shown a tendency to reverse or find support.
Support levels are represented by the green line and green shade, indicating areas where buying interest may emerge to prevent further price decline.
Resistance levels are represented by the red line and red shade, indicating areas where selling pressure may arise to prevent further price increases. Traders often consider these levels as potential buying or selling opportunities.
Breakouts: Breakouts occur when the price convincingly moves above a resistance level (red shade) or below a support level (green shade). A bullish breakout above resistance suggests the potential for further price increases, while a bearish breakout below support suggests the potential for further price declines. Traders pay attention to these breakout signals as they may indicate the start of a new trend or significant price movement.
Disclosure: I am not SEBI registered. The information provided here is for learning purposes only and should not be interpreted as financial advice. It is important to consult with a qualified financial advisor before making any investment decisions. Tweets neither advice nor endorsement.

AdaniportsAdani ports can give a good swing to positional trade with a decent stoploss and for good Targets.
ENTRY - 1420
STOPLOSS - 1410
TARGETS - 1450, 1500++
Note- if any trade or value that's gone from the marked levels then that's not our trade just let it go or wait for it to come back
I'm not sebi registered this is my personal view
Please like or boost my idea if you like it or traded it
