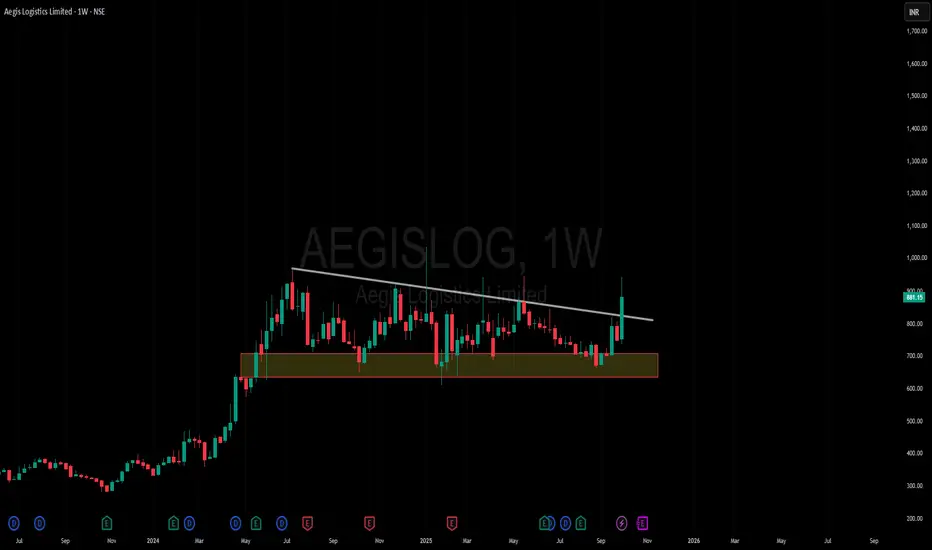
Amazing breakout on WEEKLY Timeframe - AEGISLOGCheckout an amazing breakout happened in the stock in Weekly timeframe, macroscopically seen in Daily timeframe. Having a great favor that the stock might be bullish expecting a staggering returns of minimum 25% TGT. IMPORTANT BREAKOUT LEVELS ARE ALWAYS RESPECTED!
NOTE for learners: Place the breakout levels as per the chart shared and track it yourself to get amazed!!
#No complicated chart patterns
#No big big indicators
#No Excel sheet or number magics
TRADE IDEA: WAIT FOR THE STOCK TO BREAKOUT IN WEEKLY TIMEFRAME ABOVE THIS LEVEL.
Checkout an amazing breakout happened in the stock in Weekly timeframe.
Breakouts happening in longer timeframe is way more powerful than the breakouts seen in Daily timeframe. You can blindly invest once the weekly candle closes above the breakout line and stay invested forever. Also these stocks breakouts are lifelong predictions, it means technically these breakouts happen giving more returns in the longer runs. Hence, even when the scrip makes a loss of 10% / 20% / 30% / 50%, the stock will regain and turn around. Once they again enter the same breakout level, they will flyyyyyyyyyyyy like a ROCKET if held in the portfolio in the longer run.
Time makes money, GREEDY & EGO will not make money.
Also, magically these breakouts tend to prove that the companies turn around and fundamentally becoming strong. Also the magic happens when more diversification is done in various sectors under various scripts with equal money invested in each N500 scripts.
The real deal is when to purchase and where to purchase the stock. That is where Breakout study comes into play.
LET'S PUMP IN SOME MONEY AND REVOLUTIONIZE THE NATION'S ECONOMY!
Trade ideas
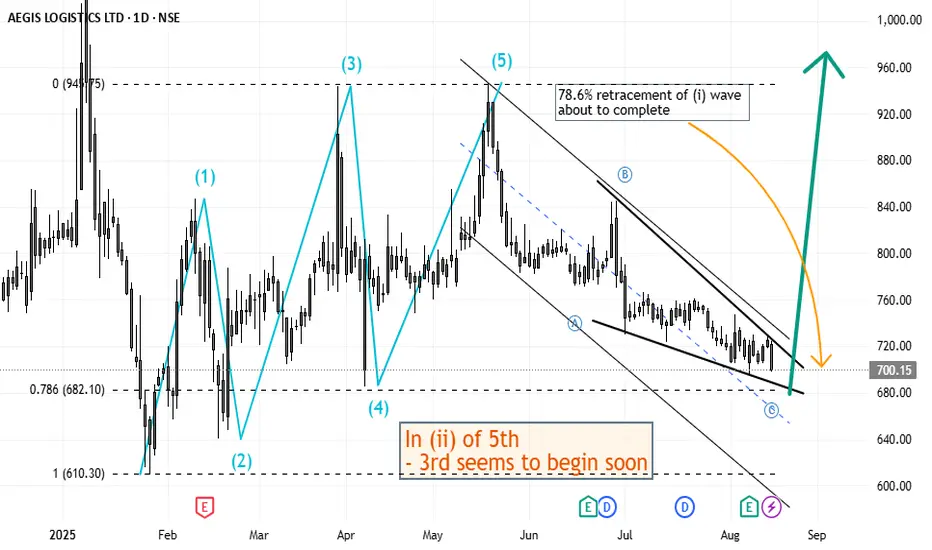
Elliott Wave Analysis of Aegis Logistics AEGISLOGThe script is doing 5th of weekly time-frame and seems to about to complete (i) of 5th with 78.6% retracement. The (i) was a diagonal impulse wave. And now in retracement, the C wave also appears to be forming an ending diagonal. After this is completed, (iii) wave should start.
AEGISLOG - Aegis Logistics Ltd. (45 minutes chart, NSE) - LongAEGISLOG - Aegis Logistics Ltd. (45 minutes chart, NSE) - Long Position; short-term swing research idea.
Risk assessment: High {volatility risk}
Risk/Reward ratio ~ 2.63
Current Market Price (CMP) ~ 880
Entry limit ~ 870 to 860 (Avg. - 865) on May 22, 2025
1. Target limit ~ 890 (+2.89%; +25 points)
2. Target limit ~ 915 (+5.78%; +50 points)
Stop order limit ~ 846 (-2.20%; -19 points)
Disclaimer: Investments in securities markets are subject to market risks. All information presented in this group is strictly for reference and personal study purposes only and is not a recommendation and/or a solicitation to act upon under any interpretation of the letter.
LEGEND:
{curly brackets} = observation notes
= important updates
(parentheses) = information details
~ tilde/approximation = variable value
-hyphen = fixed value

AEGIS LOGISTICS Triangle Pattern• CMP: ₹800| Stop Loss: ₹750| Target:*900 | ₹1000
DISCLAIMER: I am NOT a SEBI registered advisor or a financial adviser. All the views are for educational purpose only.

Flag & Pole breakoutThis stock exhibited highly volatile movements this week, accompanied by remarkable volumes. It attempted to break out above its previous high of ₹970 but failed.
The subsequent correction occurred on low volumes.
A POM is scheduled for January 12th, suggesting the possibility of significant news.
An inverted hammer candlestick has formed, indicating an excellent risk-to-reward opportunity. The support level can serve as the stop loss.
The stock should be analyzed primarily on the weekly timeframe, as charts on other timeframes, including the daily, are extremely noisy. The weekly chart, on the other hand, is clear and well-structured.

Aegis Logistics: Prepping for a Small Rounding Bottom Breakout!🚀 Aegis Logistics: Prepping for a Small Rounding Bottom Breakout! 🚀
Current Market Price: 850
Stop Loss: 780
Targets: 925, 970, 1070
Aegis Logistics is showing signs of a potential small rounding bottom breakout. A confirmation above 925 could set the stage for further upside. Given the stock's volatility and scrutiny, a staggered approach to positioning is recommended for risk management.
📈 Strategy:
Monitor for confirmation above 925 for stronger conviction.
Add positions cautiously, considering the market's volatility.
📉 Disclaimer: As a non-SEBI registered analyst, I recommend conducting thorough research or seeking advice from financial professionals before making investment decisions.
#AegisLogistics #TechnicalAnalysis #RoundingBottom #BreakoutStrategy #MarketOpportunities

Breakout after long consolidationDouble digit ROE and ROCE
Debt to Equity ~1
PEG Ratio a little higher than 2
EPS continuously increasing
FII stake increased
DII presence
Technical: After a strong bull run the stock went into sidewise consolidation forming a triangle pattern. Currently the volumes are the highest ever clearly showing the buying pressure by institutions.
Note: Only analysis not a buy/sell recommendation.

Inverse H&S pattern.The setup looks excellent, with unusual trading volume observed in Friday's session. This indicates a potential massive breakout, with a long-term target of ₹1,485. Good luck!

AEGISLOG | Loss 11% and Profit 40%, are you ready to take risk??Disclaimer:
This is not financial advice. Please do your own research or consult with a financial advisor before making any investment decisions. Investments in stocks can be risky and may result in loss of capital.

Aegis Logistics looks good on chart now 907 Hello Investors,
Aegis Logistics 📊 looks very promising (not a promise) as two chart patterns coincide each other.
Now 907 go long for expected return as flag pole and head & shoulder both sink in together.
short term holding can give good return if market condition and sector performance support the chart pattern. Long term has bigger target's based on quarterly results.
Some news flow and global markets are unstable so keep in mind as sector may get impact due to business parameters.

Flag and Pole breakoutThis is a significant breakout on the weekly charts, indicating substantial potential targets. Please refer to my earlier chart for more information.

Aegis logisticsAegis is making a harmonic pattern. Can touch 1003 if sustains the first horizontal ray marked!

AEGIS LOGISTICS LTD S/RSupport and Resistance Levels:
Support Levels: These are price points (green line/shade) where a downward trend may be halted due to a concentration of buying interest. Imagine them as a safety net where buyers step in, preventing further decline.
Resistance Levels: Conversely, resistance levels (red line/shade) are where upward trends might stall due to increased selling interest. They act like a ceiling where sellers come in to push prices down.
Breakouts:
Bullish Breakout: When the price moves above resistance, it often indicates strong buying interest and the potential for a continued uptrend. Traders may view this as a signal to buy or hold.
Bearish Breakout: When the price falls below support, it can signal strong selling interest and the potential for a continued downtrend. Traders might see this as a cue to sell or avoid buying.
20 EMA (Exponential Moving Average):
Above 20 EMA(50 EMA): If the stock price is above the 20 EMA, it suggests a potential uptrend or bullish momentum.
Below 20 EMA: If the stock price is below the 20 EMA, it indicates a potential downtrend or bearish momentum.
Trendline: A trendline is a straight line drawn on a chart to represent the general direction of a data point set.
Uptrend Line: Drawn by connecting the lows in an upward trend. Indicates that the price is moving higher over time. Acts as a support level, where prices tend to bounce upward.
Downtrend Line: Drawn by connecting the highs in a downward trend. Indicates that the price is moving lower over time. It acts as a resistance level, where prices tend to drop.
RSI: RSI readings greater than the 70 level are overbought territory, and RSI readings lower than the 30 level are considered oversold territory.
Combining RSI with Support and Resistance:
Support Level: This is a price level where a stock tends to find buying interest, preventing it from falling further. If RSI is showing an oversold condition (below 30) and the price is near or at a strong support level, it could be a good buy signal.
Resistance Level: This is a price level where a stock tends to find selling interest, preventing it from rising further. If RSI is showing an overbought condition (above 70) and the price is near or at a strong resistance level, it could be a signal to sell or short the asset.
Disclaimer:
I am not a SEBI registered. The information provided here is for learning purposes only and should not be interpreted as financial advice. Consider the broader market context and consult with a qualified financial advisor before making investment decisions.

POV @ AEGISLOG : Aegis Logistics LtdPOV @ AEGISLOG : Aegis Logistics Ltd
Chart pattern shows Pennant Breakout first challenge at 860-868 for pattern target of 1005

AEGISLOG Breaking out of Falling WedgeAEGISLOG is breaking out of a falling wedge, but additional volume is needed to confirm the breakout.

