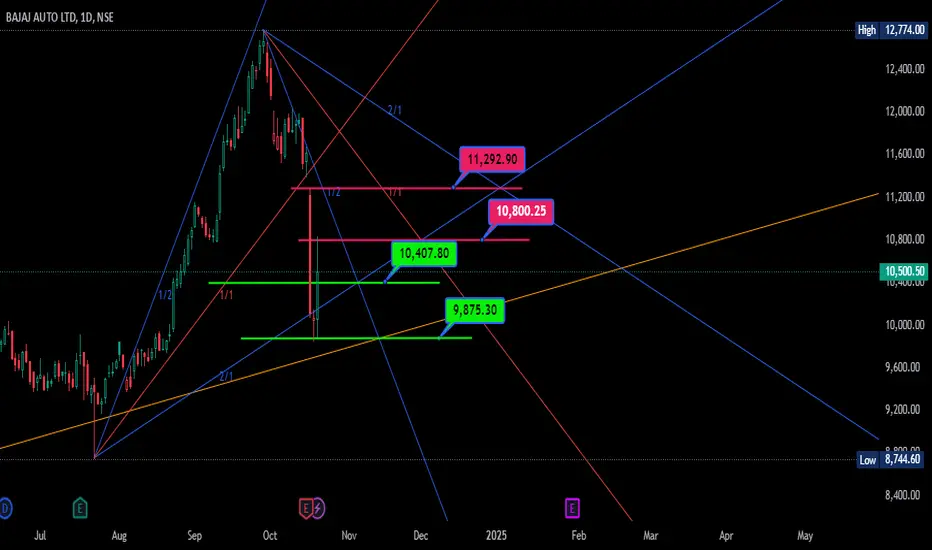
BAJAJ AUTO LTD SWING TRADE SETUP📊 Price Action & Trend Analysis
Analyzing market trends using price action, key support/resistance levels, and candlestick patterns to identify high-probability trade setups.
Always follow the trend and manage risk wisely!
Price Action Analysis Interprets Market Movements Using Patterns And Trends On Price Charts.
👉👉👉Follow us for Live Market Views/Trades/Analysis/News Updates.
BAJAJ_AUTO trade ideas

BAjaj Auto 7500 Bajaj Auto Ltd. is one of India's leading manufacturers of motorcycles, scooters, and three-wheelers. Established in 1945, the company has grown into a global brand known for its innovation, durability, and affordability. Bajaj Auto is renowned for models like the Pulsar, Dominar, and Platina in the motorcycle segment, as well as its popular three-wheelers used for public transport. With a strong presence in over 70 countries, Bajaj has positioned itself as the world's largest manufacturer of three-wheelers and one of the top motorcycle exporters from India. The company continues to focus on technological advancements, electric mobility, and sustainable transportation, reinforcing its reputation as a pioneer in the automotive industry.


BAJAJ AUTO | SHORT | INTRADAYBAJAJ AUTO is correcting from the Highs.
Lower Highs formation noticed. We can anticipate a correction further to 8675 price levels which should be a good support.
An intraday trade is certainly setting up my that logic.


Follow The Trend or Wait for Retracement...NSE:BAJAJ_AUTO trade at 10500. Support is at 9700 and Resistance at 10600.
P/E RATIO - 36.35 Industry P/E - 23.75
On the 23rd AUG Bajaj Auto give a Breakout above 10000 level. You can wait for Retracement otherwise Follow the Trend for Next Resistance at 11200-11500.

BAJAJ AUTO Shortterm VIEW BEARISHAfter a good run from Rs.4,000 (in APRIL 2023) Stock has doubled and more to Rs.10,000.
Along the journey We have seen small consolidations at Rs.8,500-9,300 and stock reached Rs.10k After that we have seen a small dip towards 8,800.
Now its forming a HNS Pattern in Weekly TF.
I expect a Downside correction to 7,000-7,300 Zone.
I also believe Automobile Sector will go through some consolidation.

BAJAJ AUTO --- excellent support for longsI see BAJAJ Auto has been at crucial support and forming nice bullish candles.
It has lot of potential to cross 10k. Actually this stock is running on discount price now for buyers..
THIS IS NOT SELL OR BUY RECOMMENDATION. I AM NOT SEBI REGISTERED
This is for learning purpose only.

BAJAJ AUTO LTD S/RSupport and Resistance Levels:
Support Levels: These are price points (green line/shade) where a downward trend may be halted due to a concentration of buying interest. Imagine them as a safety net where buyers step in, preventing further decline.
Resistance Levels: Conversely, resistance levels (red line/shade) are where upward trends might stall due to increased selling interest. They act like a ceiling where sellers come in to push prices down.
Breakouts:
Bullish Breakout: When the price moves above resistance, it often indicates strong buying interest and the potential for a continued uptrend. Traders may view this as a signal to buy or hold.
Bearish Breakout: When the price falls below support, it can signal strong selling interest and the potential for a continued downtrend. Traders might see this as a cue to sell or avoid buying.
MA Ribbon (EMA 20, EMA 50, EMA 100, EMA 200) :
Above EMA: If the stock price is above the EMA, it suggests a potential uptrend or bullish momentum.
Below EMA: If the stock price is below the EMA, it indicates a potential downtrend or bearish momentum.
Trendline: A trendline is a straight line drawn on a chart to represent the general direction of a data point set.
Uptrend Line: Drawn by connecting the lows in an upward trend. Indicates that the price is moving higher over time. Acts as a support level, where prices tend to bounce upward.
Downtrend Line: Drawn by connecting the highs in a downward trend. Indicates that the price is moving lower over time. It acts as a resistance level, where prices tend to drop.
Disclaimer:
I am not a SEBI registered. The information provided here is for learning purposes only and should not be interpreted as financial advice. Consider the broader market context and consult with a qualified financial advisor before making investment decisions.

Bajaj Auto | Shorted Again | SwingBajaj Auto has once again demonstrated further weakness by breaking the present days low and the crucial neck line.
Price is below all three crucial pivots - monthly, weekly & daily.
I have shorted it once more for the next target as 8760.

Bajaj Auto: Poised for a God Candle!Bajaj Auto is currently showing signs of forming a descending triangle, a pattern that typically signals a potential breakout. The big question is: Which way will it go?
Key Levels to Watch:
1️⃣ Support Zone: If the price breaks below the support, we could see a swift move downward. 📉
2️⃣ Resistance Zone: A breakout above the resistance might ignite a God Candle and send the stock flying. 🚀
Sentiment Check:
Bullish Case: Buyers take control, leading to a sharp upward rally.
Bearish Case: Sellers dominate, causing a breakdown to lower levels.
What’s your take? Are you betting on the bulls 🐂 or the bears 🐻? Share your thoughts! 💬

Bajaj Auto | Short | STBTBajaj Auto had a big gap up today morning and got rejected right away from The Daily resistance level. As per my understanding this has to be a good place to short for optimum risk to reward ratio considering that it has been in a downtrend.
Short target - 8920.

BAJAJ AUTO swing tradeHello,
Trend-Based Analysis. Buy the Dips, Sell The Rallies, Also Following the Trend. Let's see where the Price Action takes us, Riding the wave. Potential trade setups based on trend momentum.
Technical analysis based on trend identification and momentum, Looking for high-probability setups within the prevailing trend.
Analyzing the current market trend and potential future price movement. Focusing on risk management and reward-to-risk ratios.
Details is Mentioned in Chart, Read carefully.. .

buy bajaj auto for swing
BUY BAJAJ AUTO FOR SWING TRADING APPROCHING MAJOR SUPPORT LEVEL CAN BE GOOD LEVELS TO GO LONG WITH 9200 SL ON CLOSING BASIS

Bajaj AutoBajaj Auto is a 12,000 future value stock. currently trading around 9500 levels
Right entry is 9350 levels and can add in every dip
Short Term Stop Loss - 9000 levels
Target levels
Short Term - 10,045
Long Term Targets - 10,463 / 11,129 / 11,809
This idea is just for education purpose and analysis and not for real time trading
kindly consult your financial adviser before investing

Bajaj Auto Weekly Long This level is in the middle of the big candle & a good candidate to go long. It is below the Daily DZ but that isnt a good level hence may act as trap as well.

BAJAJAUTO LONG 15mins Price bounced from this level in uptrend. It could give a quick 1.5:1 or 2:1. Combined both levels LOTL

Buy Bajaj Auto Short Term Trading Advice by Goodluck Capital
Buy Bajaj Auto
Buy Range- 9400 - 9600
Target- 10200 - 10400
StopLoss- below 9000
Potential Return- 7-9%
Approx trade duration 14 - 15 days

Long base breakout: Bajaj_AutoAfter 3 months of consolidation, bajaj auto broke out from a long base, horizontal line.

BAJAJ AUTO LTD S/RSupport and Resistance Levels: In technical analysis, support and resistance levels are significant price levels where buying or selling interest tends to be strong. They are identified based on previous price levels where the price has shown a tendency to reverse or find support.
Support levels are represented by the green line and green shade, indicating areas where buying interest may emerge to prevent further price decline.
Resistance levels are represented by the red line and red shade, indicating areas where selling pressure may arise to prevent further price increases. Traders often consider these levels as potential buying or selling opportunities.
Breakouts: Breakouts occur when the price convincingly moves above a resistance level (red shade) or below a support level (green shade). A bullish breakout above resistance suggests the potential for further price increases, while a bearish breakout below support suggests the potential for further price declines. Traders pay attention to these breakout signals as they may indicate the start of a new trend or significant price movement.
20 EMA: The yellow line denotes 20 EMA, to interpret the 20 EMA, you need to compare it with the prevailing stock price. If the stock price is below the 20 EMA, it signals a possible downtrend. But if the stock price is above the 20 EMA, it signals a possible uptrend.
Disclosure: I am not SEBI registered. The information provided here is for learning purposes only and should not be interpreted as financial advice. It is important to consult with a qualified financial advisor before making any investment decisions. Tweets neither advice nor endorsement.

BAJAJ AUTOFresh break out in bajaj auto. also it has all time high. can buy right now with sl. also gud entry on retest. with proper sl. target will be high. if it makes consolidation here.

BAJAJ AUTO LTD S/R for 16/7/24Support and Resistance Levels: In technical analysis, support and resistance levels are significant price levels where buying or selling interest tends to be strong. They are identified based on previous price levels where the price has shown a tendency to reverse or find support.
Support levels are represented by the green line and green shade, indicating areas where buying interest may emerge to prevent further price decline.
Resistance levels are represented by the red line and red shade, indicating areas where selling pressure may arise to prevent further price increases. Traders often consider these levels as potential buying or selling opportunities.
Breakouts: Breakouts occur when the price convincingly moves above a resistance level (red shade) or below a support level (green shade). A bullish breakout above resistance suggests the potential for further price increases, while a bearish breakout below support suggests the potential for further price declines. Traders pay attention to these breakout signals as they may indicate the start of a new trend or significant price movement.
20 EMA: The yellow line denotes 20 EMA, to interpret the 20 EMA, you need to compare it with the prevailing stock price. If the stock price is below the 20 EMA, it signals a possible downtrend. But if the stock price is above the 20 EMA, it signals a possible uptrend.
Disclosure: I am not SEBI registered. The information provided here is for learning purposes only and should not be interpreted as financial advice. It is important to consult with a qualified financial advisor before making any investment decisions. Tweets neither advice nor endorsement.
