Coforge Limited 4th Wave Contracting TriangleCoforge Limited 4th Wave Contracting Triangle
The larger trend remains bullish, and the current structure fits well as a Wave 4 correction unfolding as a contracting triangle (A–B–C–D–E). Waves A, B, C, and D are already in place with clear overlaps and decreasing volatility, which is typical of a triangle in Wave 4. The ongoing dip looks like the final Wave E, holding above the rising support line, suggesting correction is nearing completion.
Once Wave E finishes, a decisive breakout above the triangle resistance should trigger Wave 5, which is usually sharp and impulsive, often carrying price beyond the previous Wave 3 high.
(Educational view only, not a trading recommendation.)
Market insights

Coforge Reversal Trade - 13/12The stock has fallen for past 3 days and overall 7-8% correction, and is currently at trendline support.

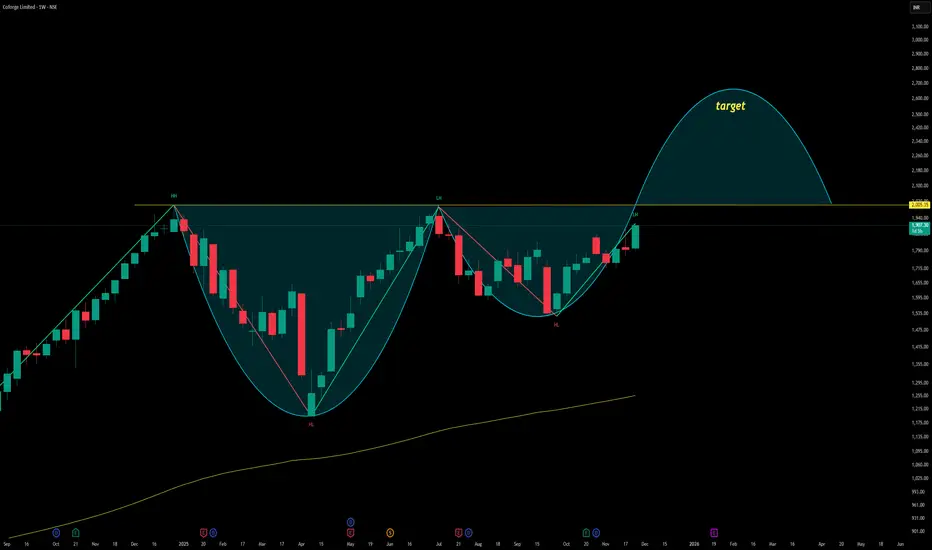
Cup & Hndle in COFORGECoforge is showing formation of a cup and handle pattern. This pattern always forms at top of uptrend and signals a trend continuation. First target will be the height of the handle.
Coforge Ltd., incorporated in the year 1992, is a Mid Cap company (having a market cap of Rs 62,606.27 Crore) operating in IT Software sector.
Coforge Ltd. key Products/Revenue Segments include Sale of services for the year ending 31-Mar-2025.
For the quarter ended 30-09-2025, the company has reported a Consolidated Total Income of Rs 4,024.20 Crore, up 8.55 % from last quarter Total Income of Rs 3,707.20 Crore and up 29.04 % from last year same quarter Total Income of Rs 3,118.60 Crore. Company has reported net profit after tax of Rs 425.40 Crore in latest quarter.
The company’s top management includes Mr.Om Prakash Bhatt, Mr.Sudhir Singh, Mr.Gautam Samanta, Mr.Anil Chanana, Mr.D K Singh, Ms.Mary Beth Boucher, Mr.Saurabh Goel, Ms.Barkha Sharma. Company has S R Batliboi & Associates LLP as its auditors. As on 30-09-2025, the company has a total of 33.46 Crore shares outstanding.
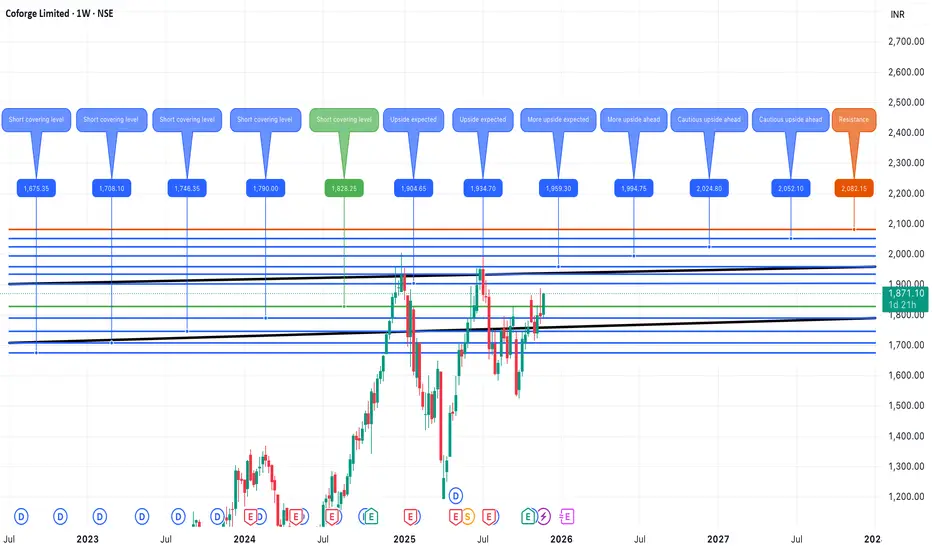
Coforge Short to Medium term viewCoforge is looking positive on charts. The upside in recent weeks looks assuring for further upside. Crucial level for further upside momentum is placed between 1904-1915. Until Coforge crosses and sustains above these levels, we can expect a retracement up to immediate support level which is around 1820 . But if it crosses and sustains above 1904-1915, then we can expect momentum to continue up to 2080 level in short to medium term.
THIS IS MY PERSONAL VIEW AND NOT A BUY/SELL RECOMMENDATION.
DISC.- I have this stock in my portfolio.
Review and plan for 20th November 2025 Nifty future and banknifty future analysis and intraday plan.
Short term ideas included.
This video is for information/education purpose only. you are 100% responsible for any actions you take by reading/viewing this post.
please consult your financial advisor before taking any action.
----Vinaykumar hiremath, CMT

Positional setup + fundamental view on Coforge (COFORGE)Coforge is a mid-tier IT / software services company, working across digital transformation, BPM, insurance, banking, and more.
Return Ratios: ROE ~ 15%, ROCE ~ 15.9% per some sources.
StockAnalysis
Another source shows ROE around 12.8%
Profitability: According to India Infoline, operating margin ~17%, net margin ~10%.
India Infoline
Growth: Strong deal win momentum — ICICIdirect sees good order intake and projects ~17.6% revenue CAGR (FY22-FY25E) because of large deals + offshoring.
Leverage: Very low debt (Debt / Equity ~ 0.11) per
Valuation: Some P/E metrics are elevated — for example, BlinkX reports P/E ~53×.
Risks / Concerns:
High P/E → market may have high expectations.
Margins could be challenged if cost pressures / discretionary spend drops.
Execution risk on large deals; scaling efficiently is key.
Strengths:
Lean balance sheet (low debt) gives flexibility.
Improving order book and deal wins could drive medium-term growth.
Good return metrics compared to some peers in IT-services.
📈 Technical / Positional Setup (4-Hour Chart Context)
From your chart:
Coforge is trying to break out above a resistance zone around ~ ₹1,830-₹1,850 (purple horizontal).
Short-term EMAs (5, 9, 21) are aligned upward, showing bullish short-term momentum.
If breakout holds, the stock could potentially run higher; but we need confirmation (volume + clean close above resistance).
Trade Plan:
Parameter Level
Entry A confirmed breakout with a 4-hr candle close above ~ ₹1,850–₹1,870
Stop-Loss Below recent support / EMA zone, e.g. ₹1,700–₹1,750
Target 1 ~ ₹2,100–₹2,200
Target 2 ~ ₹2,400+ (if strong breakout and IT momentum continues)
If price pulls back after breakout and holds above the breakout zone, that could be a good re-entry.
Use volume and momentum confirmation to validate breakout strength.
Be cautious: since valuation is on the higher side, don’t over-leverage; use a disciplined stop-loss.

Review and plan for 1st October 2025Nifty future and banknifty future analysis and intraday plan.
stock- coforge, hindzinc.
This video is for information/education purpose only. you are 100% responsible for any actions you take by reading/viewing this post.
please consult your financial advisor before taking any action.
----Vinaykumar hiremath, CMT

Buy CoforgeCoforge seems to reverse after correcting. The company seems to form a trend as shown with the line. RSI is coming out of oversold. As previously seen with RSI, the company price has gained when it last came out of oversold. Buy Coforge @CMP (1725) with SL of 1630 and target of 1960.

Coforge, 1D, Long, SupportCoforge is showing good support at the current level. From here we an see an upward movement in the stock for long term.
Entry : 1640
Target1: 1700
Target2: 1750
Target3: 1800

COFORGE SHORT TERM ANALYSISCoforge is looking positive for the short term, and we can expect a bounce from the current level of 1640 up to 1800+ levels. An important level to watch for momentum would be 1705. Once Coforge surpasses and sustains above 1705, we can expect strong momentum . However, if it breaches the recent low of 1600, then there are chances of further retracement up to the imp short covering zone of 1475-1550.
All levels are marked in the chart posted.
DISC. THIS IS MY PERSONAL VIEW AND NOT A BUY/SELL RECOMMENDATION.

Coforge LtdCOFORGE - Weak structure - US tariff could affect further
Market Cap
₹ 53,751 Cr.
Current Price
₹ 1,607
High / Low
₹ 2,005 / 1,153
Stock P/E
55.7
Book Value
₹ 191
Dividend Yield
0.95 %
ROCE
20.7 %
ROE
16.7 %
Face Value
₹ 2.00
Price to book value
8.42
Intrinsic Value
₹ 850
PEG Ratio
6.84
Price to Sales
4.01
Debt
₹ 1,070 Cr.
Debt to equity
0.17
Int Coverage
10.7
Reserves
₹ 6,312 Cr.
Promoter holding
0.00 %
Pledged percentage
0.00 %
EPS last year
₹ 24.3
Net CF
₹ 464 Cr.
Price to Cash Flow
43.4
Free Cash Flow
₹ 680 Cr.
OPM last year
14.0 %
Return on assets
10.4 %
Industry PE
28.0
Sales growth
44.7 %

Review and plan for 25th July 2025Nifty future and banknifty future analysis and intraday plan.
Quarterly results.
This video is for information/education purpose only. you are 100% responsible for any actions you take by reading/viewing this post.
please consult your financial advisor before taking any action.
----Vinaykumar hiremath, CMT

Coforge Is ready to touch 8200 levels soonCoforge is becoming ready to 8200 level soon, after a sharp rally, it will consolidate here , so soon it will touch 8200 levels, lets see

Review and plan for 6th May 2025Nifty future and banknifty future analysis and intraday plan.
Quarterly results.
This video is for information/education purpose only. you are 100% responsible for any actions you take by reading/viewing this post.
please consult your financial advisor before taking any action.
----Vinaykumar hiremath, CMT

COFORGE : 16%+ Move expectedCoforge:
Weekly B/O above 8000
Expected TGT 16% (approx 9300+ levels)
A nice reversal from 61.80% retracement.

$COFORGE: Coforge Ltd. – AI Travel Tech Titan or Overhyped?(1/9)
Good afternoon, everyone! 🌞 NSE:COFORGE : Coforge Ltd. – AI Travel Tech Titan or Overhyped Split?
Coforge snags a $1.56B Sabre deal and a 1:5 stock split—shares spike 10%! Is this IT gem ready to soar or just riding AI hype? Let’s unpack the buzz! 🔍
(2/9) – PRICE PERFORMANCE 📊
• Recent Surge: Shares up 10% post-Sabre deal news 💰
• Stock Split: 1:5 split announced, boosting accessibility 📏
• Sector Trend: IT outsourcing on fire, per X posts 🌟
It’s a hot streak, fueled by big moves! ⚡
(3/9) – MARKET POSITION 📈
• Market Cap: Not specified, but shares soaring 🏆
• Operations: Global IT player, travel tech focus ⏰
• Trend: $1.56B deal lifts travel sector outlook 🎯
Firm, staking its claim in AI-driven IT! 🌐
(4/9) – KEY DEVELOPMENTS 🔑
• Sabre Deal: $1.56B, 13-year AI partnership 🔄
• Revenue Boost: Travel sector growth projected, per analysts 🌍
• Market Reaction: 10% jump, analyst upgrades flying 📋
Scaling up, with AI as the jet fuel! 💡
(5/9) – RISKS IN FOCUS ⚡
• Execution Risk: Big deal, big delivery pressure 🔍
• Hype Factor: AI buzz could overinflate expectations 📉
• Competition: IT giants crowding the space ❄️
High stakes, but risks are real! ⚠️
(6/9) – SWOT: STRENGTHS 💪
• Mega Deal: $1.56B Sabre contract, 13 years locked 🥇
• Travel Tech: Niche expertise shining 📊
• Split Appeal: 1:5 makes it investor-friendly 🔧
Loaded with ammo for growth! 💼
(7/9) – SWOT: WEAKNESSES & OPPORTUNITIES ⚖️
• Weaknesses: Execution hiccups could trip it up 📉
• Opportunities: AI adoption, travel sector boom 📈
Can it deliver or just dazzle? 🤔
(8/9) – 📢Coforge shares up 10%, $1.56B deal in pocket—your take? 🗳️
• Bullish: Skyrocketing on AI wings 🐂
• Neutral: Solid, but watch execution ⚖️
• Bearish: Hype outpaces reality 🐻
Drop your vote below! 👇
(9/9) – FINAL TAKEAWAY 🎯
Coforge’s $1.56B Sabre deal sparks a 10% surge 📈, with a 1:5 split sweetening the pot 🌱. Volatility’s our playground—dips are DCA gems 💰. Snag ‘em cheap, ride the wave! Goldmine or glitter?

IT SECTOR Target Where Can Start Accumulation The IT sector indices of the National Stock Exchange (NSE) represent the performance of companies operating within the information technology and software services sector. These indices track the price movements of IT stocks, offering investors a benchmark for evaluating the sector's overall health and growth. The NSE's Nifty IT Index, for example, includes major players like Tata Consultancy Services (TCS), Infosys, Wipro, and HCL Technologies, reflecting the performance of the top IT firms. As the IT sector plays a crucial role in the global economy, its performance is influenced by factors such as technological advancements, global demand for IT services, and currency fluctuations. The Nifty IT Index serves as an essential tool for investors to gain exposure to India's rapidly growing IT industry and assess the market sentiment toward technology companies.

Coforge Demand ZoneCoforge Limited (formerly known as NIIT Technologies) is a mid-cap IT services company listed on the Indian stock exchanges. A demand zone for Coforge refers to a price level or area on the chart where there is significant buying interest, leading to a potential reversal or pause in a downward trend. Identifying demand zones can help traders find optimal entry points for long positions.

COFORGE | SHORT | STBTCOFORGE is breaking down from the Weekly Pivot and after a series of Lower Highs being formed since 5th Feb.
Short position can be taken for a Target of 8021 price.

COFORGE Options Trading Strategy: Breakout and Momentum-BasedIn this post, we’ll explore a couple of options strategies for COFORGE using the data for strike price 9000 . By closely monitoring the price action and key option data, we can make informed decisions that align with market trends. Here’s how we can approach trading this stock’s options effectively:
Key Option Data Breakdown
Call Short Covering: Indicates that the market sentiment is bullish as traders are closing their call positions, signaling a potential upward movement.
Put Writing: A strong sign of bullishness as traders are actively writing puts, expecting the price to stay above the 9000 strike.
Call and Put LTP (Last Traded Price):
Calls LTP: 278.8 (indicating that calls are gaining traction).
Puts LTP: 100.7 (a lower LTP for puts suggests lower demand).
Open Interest (OI) and Change in OI:
Calls OI Change: -47,850 (indicating a reduction in call positions due to short covering).
Puts OI Change: +123,975 (signifying an increase in put writing, which reinforces the bullish sentiment).
Strategy 1: Buying the Call or Put Based on the First 5-Minute Candle
This strategy involves observing the price movement in the initial 5 minutes after the market opens and deciding whether to buy a call or put, depending on the price action and option data.
When to Buy the Call or Put:
If the first 5-minute candle shows a bullish move, consider buying the call option as the market sentiment appears to be in favor of upward movement.
If the first 5-minute candle shows a bearish move, consider buying the put option. However, given the overall data showing strong put writing, this could be less likely.
Why It Works:
The first 5 minutes are crucial for gauging market sentiment, and with the data indicating strong bullishness (due to call short covering and put writing), a call option is likely to perform well.
Considerations:
This strategy requires watching for clear momentum during the first 5 minutes. If the market remains indecisive, it may be better to stay on the sidelines to avoid wasting premium.
Strategy 2: Breakout Strategy – Buy Calls or Puts on the Break of Highs
This strategy involves waiting for a breakout of the call or put’s high price. The breakout indicates a shift in momentum, and we’ll enter the trade based on whichever direction triggers first.
When to Buy the Call:
Watch for the call’s high price (389.85). If the call option breaks this level, it signals that the upward momentum is gaining strength. Buy the call to capitalize on the breakout.
When to Buy the Put:
If the call option doesn’t break its high and the price starts to show weakness, consider buying the put once it breaks its high (360.6). However, the data suggests that the market bias is bullish, so a call breakout is more likely.
Why It Works:
Breakouts are powerful signals of market momentum. Since the data shows heavy put writing, the call option is more likely to break its high first. This creates an opportunity to buy calls in a bullish trend.
Considerations:
Always monitor the volume and the price action for confirmation of the breakout. If both calls and puts test their highs without clear direction, consider waiting for a clearer signal.
Conclusion:
Given the strong bullish sentiment reflected in the options data—call short covering and put writing—the most reliable strategy is Strategy 2. Watch for a call breakout above 389.85 or a put breakout above 360.6 (if the call fails to break its high). The bullish bias suggests that the call option is more likely to outperform, but a breakout in either direction can trigger the strategy.
Pro-Tip: Set a stop loss just below the breakout level to manage risk effectively. The market sentiment is heavily tilted towards bullishness, so a call option breakout is the most probable outcome.

Stage Analysis of CoforgeThis is stage analysis of Coforge. It seems to me that it has all the 4 stages in this stock.

coforge getting bearishcmp 6845
sl and t1 shown on chart
note : its for educational purpose and not a trading call/tip.

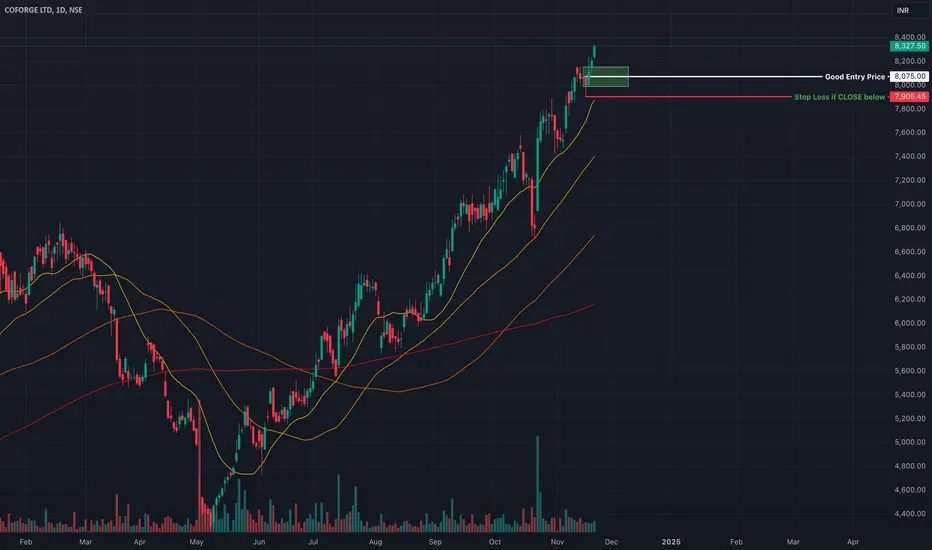
Coforge: Bullish in bear marketThis stock shows very strong trend. Kind of respecting 20SMA and 50SMA.
Trend : Strong Bullish
Trade: Long
SL Price : Recent swing low, 7900.
Entry : 8075.
Target: there is no target. Just trail SL unitl prices closes below recent swing low.
Whenever price bounces back from 20SMA, your can hold with more conviction.
Here risk is about 8075-7900 = Rs.175 per stock.
Aim of 1:3 or 1:5 at least.
For entry you can even target and wait for even better entry level better than 8075.