VALOR ESTATE LTD S/RSupport and Resistance Levels:
Support Levels: These are price points (green line/shade) where a downward trend may be halted due to a concentration of buying interest. Imagine them as a safety net where buyers step in, preventing further decline.
Resistance Levels: Conversely, resistance levels (red line/shade) are where upward trends might stall due to increased selling interest. They act like a ceiling where sellers come in to push prices down.
Breakouts:
Bullish Breakout: When the price moves above resistance, it often indicates strong buying interest and the potential for a continued uptrend. Traders may view this as a signal to buy or hold.
Bearish Breakout: When the price falls below support, it can signal strong selling interest and the potential for a continued downtrend. Traders might see this as a cue to sell or avoid buying.
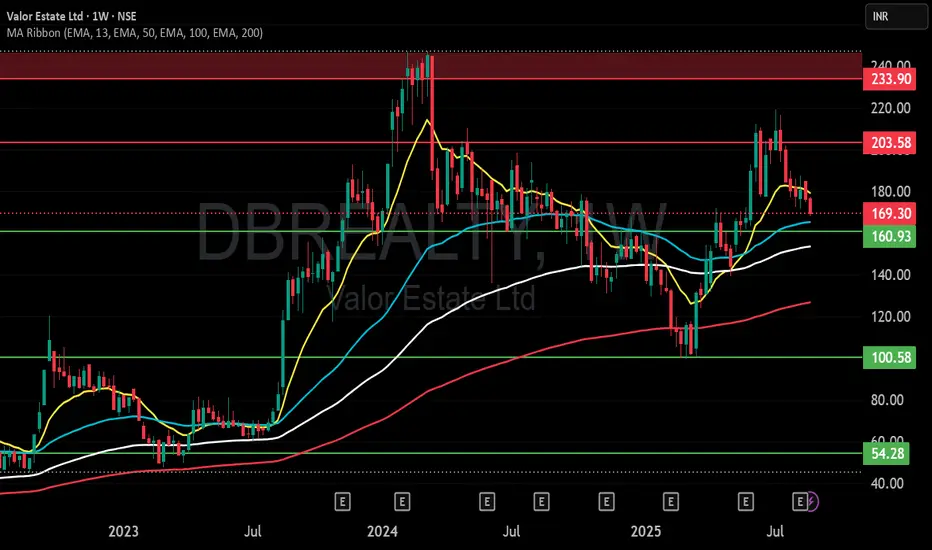
MA Ribbon (EMA 20, EMA 50, EMA 100, EMA 200) :
Above EMA: If the stock price is above the EMA, it suggests a potential uptrend or bullish momentum.
Below EMA: If the stock price is below the EMA, it indicates a potential downtrend or bearish momentum.
Trendline: A trendline is a straight line drawn on a chart to represent the general direction of a data point set.
Uptrend Line: Drawn by connecting the lows in an upward trend. Indicates that the price is moving higher over time. Acts as a support level, where prices tend to bounce upward.
Downtrend Line: Drawn by connecting the highs in a downward trend. Indicates that the price is moving lower over time. It acts as a resistance level, where prices tend to drop.
Disclaimer:
I am not SEBI registered. The information provided here is for learning purposes only and should not be interpreted as financial advice. Consider the broader market context and consult with a qualified financial advisor before making investment decisions.
Trade ideas
DBREALTYDBREALTY
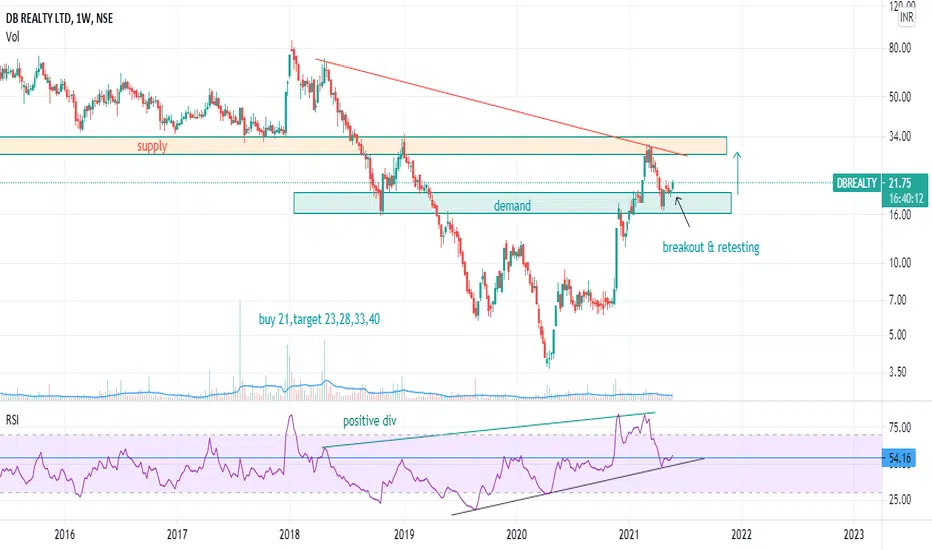
watch above levels. green line is our entry, redline is our SL.
DISCLAIMER : I am NOT a SEBI registered advisor or a financial adviser. All the views are for educational purpose only.
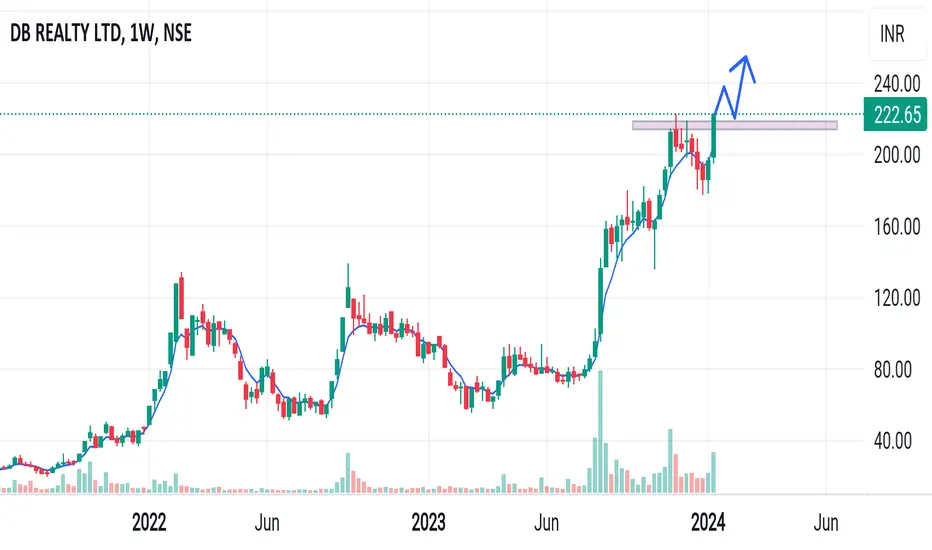
DB REALTYDb realty forming a bullish structure, expected 220 as first target! Once crosses tht cn see a new high!

DB REALTY - LONGNSE:DBREALTY Year with effect of Mars and in numerology also 2025 is the year for Mars- reflect the good momentum in realty sector. Also weekly chart showing buyers at location.


Stock for Short Term Investment
Buy range 193
Target 210,230,240,280,300,325
Holding Period Short Term

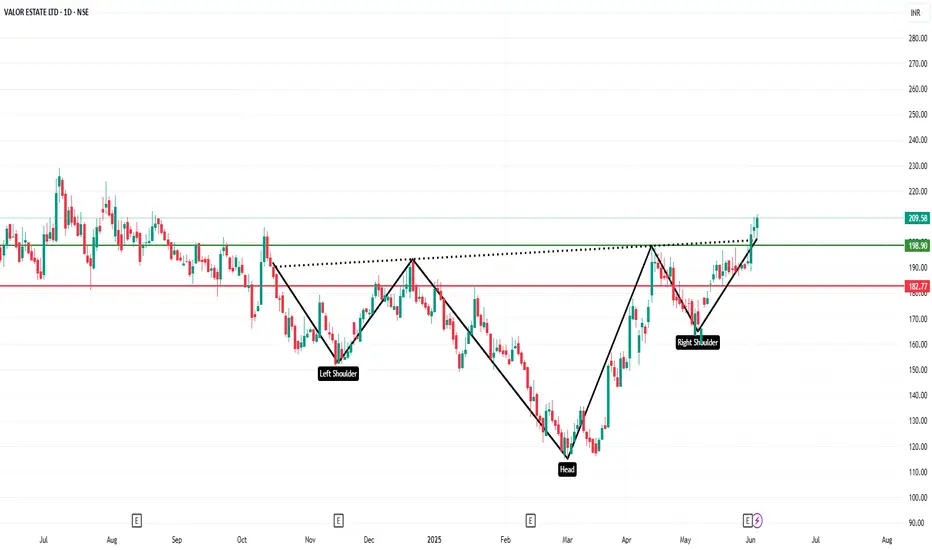
Valor Estate, Volatility compression is visible in chartValor Estate aka DB Realty. Volatility compression is visible in chart. Let's see how it pans out?

Valor Estate , Volatility compression is visible in chartValor Estate , Volatility compression is visible in chart. Let us see how it pans out

Break out possible
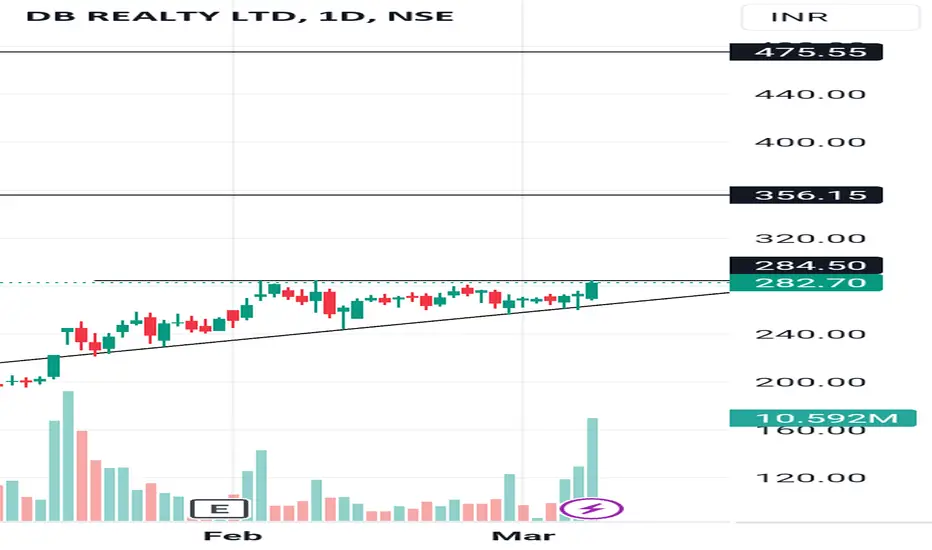
High probability Break out possible in DB Reality.If DB Reality break the the level of 284.50 and because of increasing volume form last couple of days we can see a up side move if stock take rejections from the levels of 284.50 avoid it keep DB Reality in your watch list
Comment down your stocks for analysis
DBREALTYThese are swing ideas which you can add your watchlist and analysis for yourself !
Keep on your radar!
I am not sebi ragister I
All Time High Weekly Closing - DBREALITYPlease look into the chart for a detailed understanding.
Consider these for short-term & swing trades with 4% profit (In my observation, I found that most of the stocks reached 3% to 4% on weekly basis)
Please consider these ideas for educational purposes.

DBREALTY BREAKOUTDBREALTY has give a good breakout of its trendline with high and increasing volumes and risk to reward is also very faverable. ENTRY- at current price , SL- 74.50 , TGT- 120

DB REALITY : BULLISH CHANNEL DB REALITY: Recently make double bottom on daily /Weekly time frame to coming up side.
Best Fresh Entry 68 72 With Stop 64
can go upside 100 124 148+++
Observations -
1. Strong demand to come upside
2. Double bottom on daily chart
3. Double bottom on Weekly chart
4. Making properly XABCD drawing
5. volume also supporting the positive trend development
Disclaimer: Our view only for Educational awareness. do your own due diligence.

Weekly bullish compressing from down side wadge at top.I have checked from many times in below priceaction momentum indicator it showing green signal and also the price is compresing from both side and making down side wadge.
Every one can check with their experiance I think its buy will come after 110. It will take more time to come up and settle in uptrend.

DB Realtyno broken highs, just consistently lows and lows. this is what an utterly manipulated dead stock looks like. Save your money and run away from this if already in it keep the hourly stop loss as, market manipulative news fail to bring any more interest. #typical bse stock

DB Realty on Verge of Breakout post making a high of 32.45 on 14Bought in Nov -21 at Rs 8 .After making a high of 32.5 on 14-09-21 went into profit booking/consolidation and today 08-10-21 is again at 32.45 and on a verge of breakout for higher levels of 35/37/40 in 3 to 4 weeks SL of 27

DB REAILTY LONG ENTERDB REAILTY is forming a dubble bottom W pattern in weekly time frame you can long in this stock by above 40 to tagert of 55+ / 65+ / 80+

DB Reality heading towards 40 and 60Call it Cup and handle or Inverse head and shoulder its bullish on charts