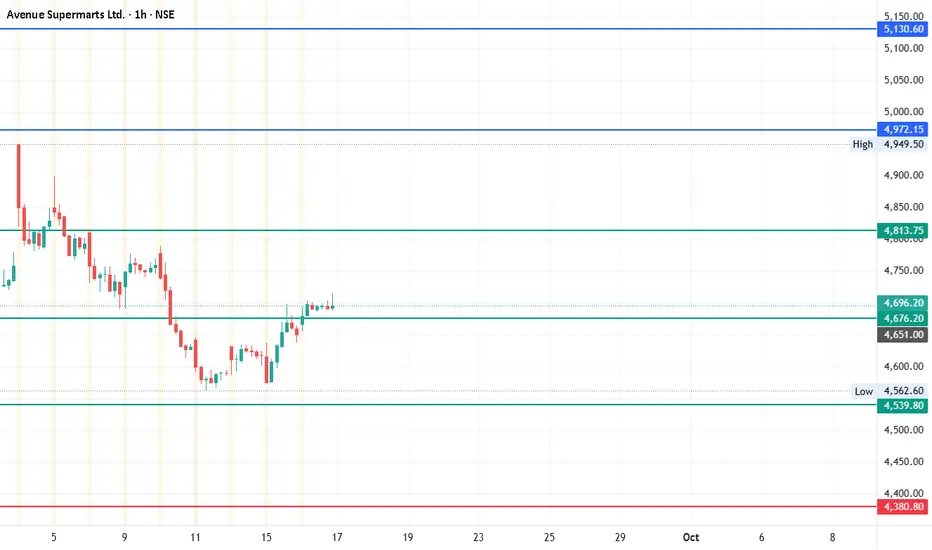
#DMART - 600 Points Move?Date: 16-09-2025
#DMART - Current Price: 4696
Pivot Point: 4676
Resistance: 4814
Support: 4540
#DMART Upside Levels:
UL1: 4972
UL2: 5131
UL3: 5301
UL4: 5471
#DMART Downside Levels:
DL1: 4381
DL2: 4222
DL3: 4051
DL4: 3881
#TradingView #Nifty #BankNifty #DJI #NDQ #SENSEX #DAX #USOIL #GOLD #SILVER
Trade ideas
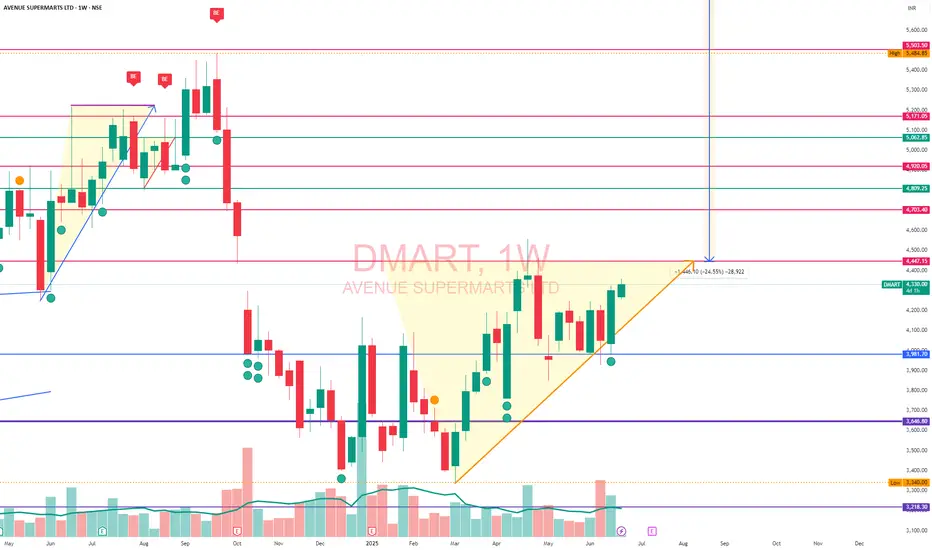
DMARTDMART
Current price: 4330
Time Frame: Few Weeks!
DMart, looks good on weekly chart frame. broken up the previous barrier and ready to move 4400, 4500, 4800 within few weeks.
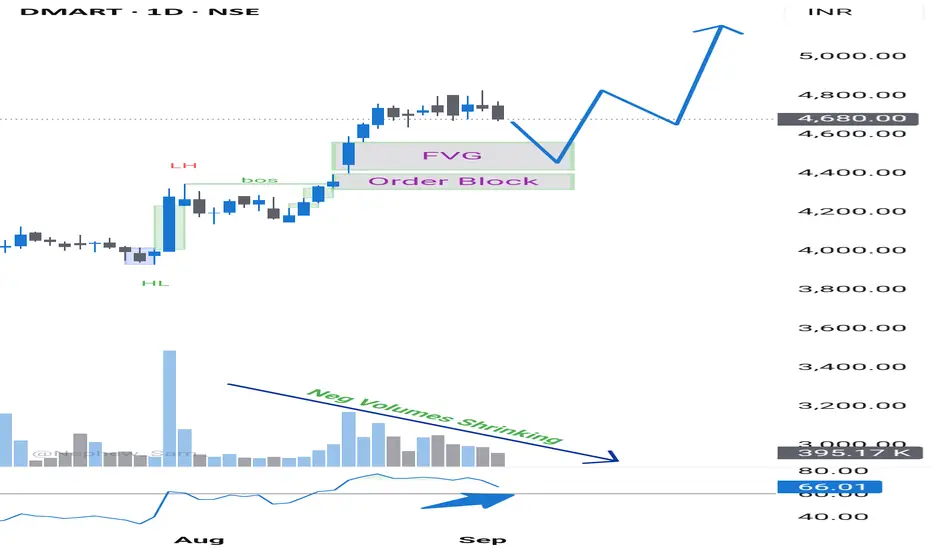
Dmart - Smart Money - RSI - VolumesTeam,
For Swing and Positional - Add in your watchlist.
Monthly RSI is about to cross 60 BUT as you can see daily it has already crossed. A small pullback is expected before a big move. Check volumes in daily - negative volumes are shrinking. As per smart money it is coming to fill some orders near Fair Value Gaps and Order Block.
So, the range will be 4400 to 4600 for Swing and Positional.
Best of luck.
Golden Advice - How to be sure of right entry? As soon as volumes started shrinking, switch to 1 hr and check where is LH is breaking. Because if it's in pullback range it will make LH and LL. We just want one LH broken and then will start accumulating after pull back of that LH.
Avenue Supermarts Ltd. (NSE) - Cup and Handle (W)Pattern Formation : A clear Cup and Handle pattern has formed, with a strong breakout above the handle resistance around ₹4,445.55.
Breakout Confirmation: The breakout is accompanied by a significant bullish candle and above-average volume, indicating strong buying interest.
Next Resistance: The immediate resistance lies near ₹5,400–₹5,500, which is the previous all-time high zone.
Support Levels: The breakout level ₹4,445 now acts as strong support; failure to hold may lead to retesting around ₹4,200–₹4,000.
Momentum: Price closed near the week's high (₹4,698.80, +7.82%), suggesting bullish momentum likely to continue in the short to medium term.
⚠️ Disclaimer: This chart is for educational purposes only.
Regulatory Note: We are an independent development team. Our services are not registered or licensed by any regulatory body in India, the U.S., the U.K., or any global financial authority. Please consult a licensed advisor before making trading decisions.

DMart (Avenue Supermarts) – Full Analysis for Learners📊 DMart (Avenue Supermarts) – Full Analysis for Learners
__Technical View__
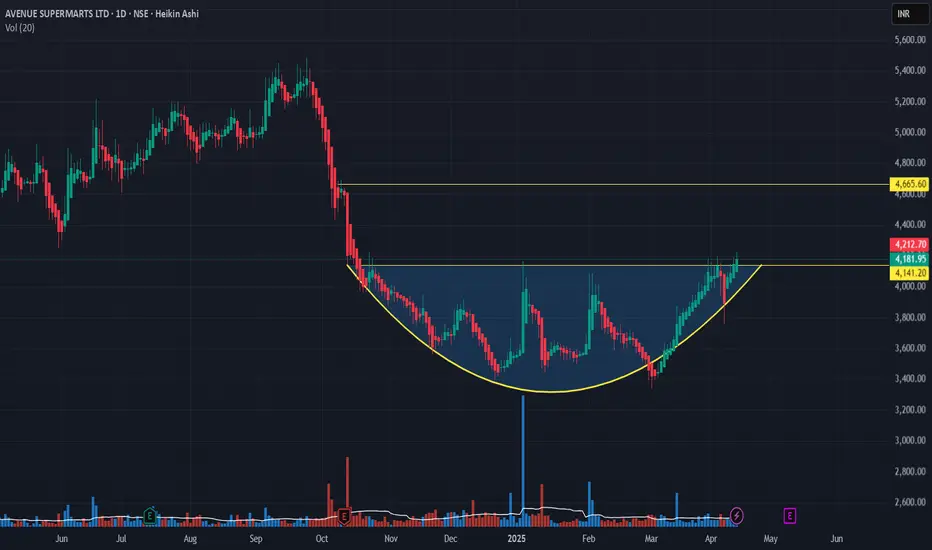
Stock formed a classic rounding bottom , signaling a bullish reversal and shifting sentiment upward.
Post-consolidation, price broke out on strong volume , confirming trend strength.
According to TTB Indicators , both weekly and monthly zones have broken out with solid candlesticks — trend flip confirmed.
After clearing the Fibonacci-based resistance, price is currently up ~1%, showing early momentum.
__Why It Matters for Learners__ :
Volume-backed breakouts show real participation. Combining chart patterns (rounding bottom) with indicators (TTB zones) strengthens conviction.
---
__Targets & Risk__
Entry : CMP (around breakout level)
Stop-Loss : Below ₹4,550 — price maintaining above this keeps setup valid.
Targets :
• TP1: ₹5,060
• TP2: ₹5,460
• TP3 (Aggressive Trend Target): ₹6,000
Potential upside: 10% to 30% , while risk remains ~6–7% — a favorable Risk/Reward ratio.
---
__Fundamental & News Triggers__
DMart is aggressively expanding — aiming to open 50 new stores in FY26 , with special focus on North India and tier-II cities.
Recently celebrated milestone — 428 stores operational with Nagpur location just added.
Q1 FY26 revenue rose ~16–18% YoY, with PAT expected to grow ~6–10%.
Business remains virtually debt-free , continues strong operational discipline.
Expansion strategy stays cluster-focused — efficient operations, footprint growth, and controlled cost model.
__Why It Matters__ : Expansion fuels revenue growth; Q1 earnings support trend, and strong fundamentals back technical setup.
---
__TTB Learning Corner__
Chart Pattern + Volume = Reliable reversal signals.
TTB Zone Breakouts = Confident trend direction (monthly + weekly).
Manage Risk : Define SL, let winners run. Good RRR gives statistical edge.
News + Fundamentals Validate Trends : Expansion, earnings, and business model reaffirm bullish view.
Combine Technical + Fundamental — This holistic approach turns analysis into smart action.
---
__Trade + Investment Summary__
| Strategy | Entry | SL (~6-7%) | TP1 | TP2 | TP3 |
|-------------------------|-----------|------------|---------|---------|---------|
| Swing Trade | CMP | ₹4,550 | ₹5,060 | ₹5,460 | ₹6,000 |
| Medium-Term Position | CMP | ₹4,550 | ₹5,460 | ₹6,000 | Higher if momentum sustains |
---
__TTB Takeaway (Emotional & Motivational)__
Trading isn’t about perfect entries—it’s about trust in your strategy and discipline in execution. Each breakout you spot is a lesson, each move you make builds your capability.
Markets will test your conviction, but every follow-through reaps a little more confidence. Stay sharp, stay learning.
— With You, For You – The Trader Beast

Breakout Trade for DMART (Avenue Supermarts Ltd.)DMART has given a strong daily breakout with volume (a very reliable setup). If the stock closes strong on the weekly chart and sustains momentum, Fibonacci extensions and pattern projections point towards the ₹4,950–₹5,050 zone as the next logical target.

Dmart - LongAs provided earlier in the weekly analysis, Dmart has shown strength
Those who have missed-
New Entry - After the current pullback
SL - Swing Low
Target - 1=5000, 2=5500, 3=6000+
RSI month about to cross 60, that means a huge momentum expected.
RSI daily has crossed 60+
Volumes kick in
Ichimoku Lag Span - Positive bias - above the price
Volume Profile - Demand zone identified

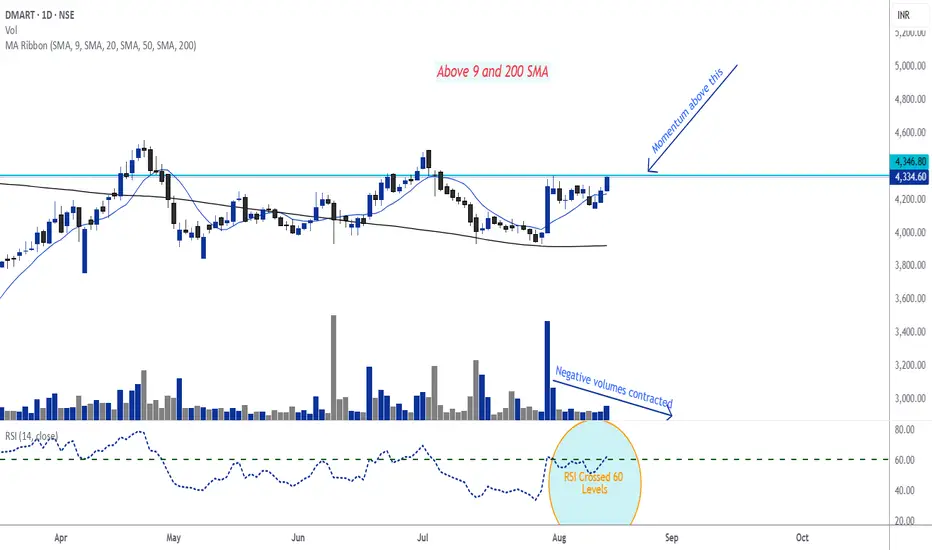
Dmart - In the Range of Smart Players - RSI bullish momentumDmart - As per the Analysis can reach a new heights from here.
Above 9 and 200 SMA.
RSI - Crossed 60 in Daily
Volumes - Negative bars are contracted - means big players are expecting upside move.
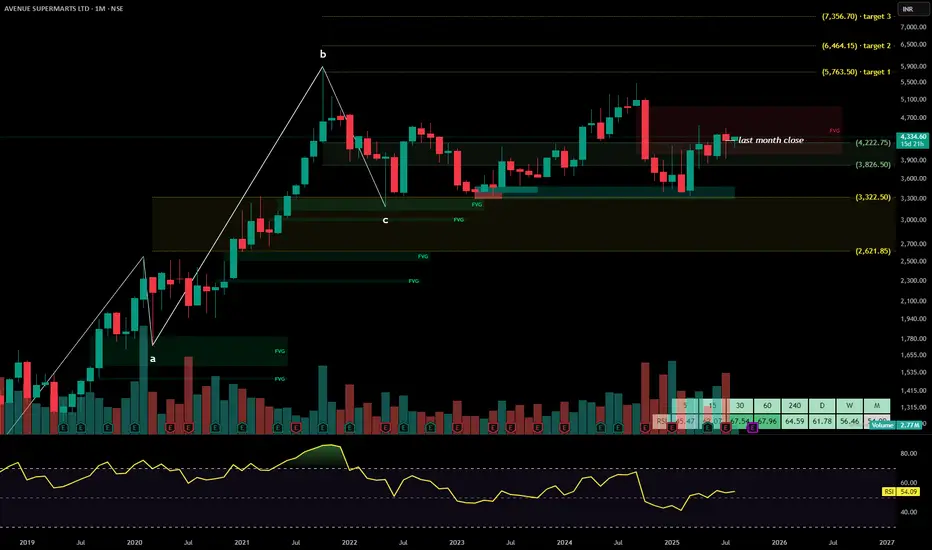
DMARTAvenue Supermarts Ltd. (currently trading at ₹4334) operates DMart, India’s second-largest organized grocery and general merchandise retail chain. Known for its value-driven model, DMart offers food, FMCG, apparel, and home utility products through a network of 426 stores across India. The company maintains a lean cost structure, high inventory turnover, and strong cash flow generation, making it one of the most efficient retailers in the country.
Avenue Supermarts Ltd. – FY21–FY25 Snapshot
Sales – ₹24,143 Cr → ₹30,850 Cr → ₹41,833 Cr → ₹50,790 Cr → ₹59,358 Cr Strong multi-year growth driven by store expansion and higher footfalls
Net Profit – ₹1,099 Cr → ₹1,650 Cr → ₹2,378 Cr → ₹2,520 Cr → ₹2,707 Cr Margin stability despite competitive pressures and input cost volatility
Operating Performance – Strong → Strong → Strong → Strong → Strong Consistent execution across offline and online formats
Dividend Yield (%) – 0.00% → 0.00% → 0.00% → 0.00% → 0.00% No payouts; reinvestment-focused strategy
Equity Capital – ₹648.73 Cr (constant) No dilution; promoter group retains majority stake
Total Debt – ₹0 Cr (debt-free) Fully equity-financed operations
Fixed Assets – ₹9,850 Cr → ₹11,200 Cr → ₹12,650 Cr → ₹13,980 Cr → ₹15,320 Cr Capex focused on store additions and DMart Ready infrastructure
Institutional Interest & Ownership Trends
Promoter holding stands at 74.65%, led by Radhakishan Damani and family. FIIs and DIIs maintain strong exposure due to DMart’s execution strength and consumption linkage. Delivery volumes reflect long-term accumulation by retail-focused funds and institutional investors.
Business Growth Verdict
Avenue Supermarts continues to scale efficiently across geographies Margins remain stable despite competitive intensity Debt-free structure enhances financial flexibility Capex supports long-term store expansion and digital enablement
Management Con Call
Management confirmed 50 new store additions in FY25, with a strategic push into northern India, especially Uttar Pradesh. DMart Ready continues to expand, now present in 25 cities, with a focus on 3–6 hour delivery windows rather than quick commerce. Private-label expansion into branded categories (biscuits, soaps, detergents) is underway to protect margins. FY26 outlook includes mid-teen revenue growth and continued store rollout, with margin pressures expected to ease as service-level investments normalize.
Final Investment Verdict
Avenue Supermarts Ltd. IS a debt-free model, strong promoter backing, and scalable offline-plus-online strategy make it suitable for accumulation by investors seeking exposure to India’s consumption and retail infrastructure. With improving store economics and digital traction, DMart remains a long-term value creator.
D-Mart Breakout 📢 PJV FINANCIAL – 1-2 DAYS TECHNICAL CALL 📢
🔷 SCRIPT: DMART
🔷 Action: BUY above ₹4260
🔷 Stop Loss: ₹4180 (📉 -1.88%)
🔷 Target: ₹4420 (📈 +3.76%)
🔷 Risk–Reward Ratio: 1 : 2.00 ✅
📌 Short-term momentum trade idea – strictly follow SL.
🚀 #PJVSignals | 💼 #TechnicalCall

Review and plan for 14th July 2025 Nifty future and banknifty future analysis and intraday plan.
Results - analysed.
This video is for information/education purpose only. you are 100% responsible for any actions you take by reading/viewing this post.
please consult your financial advisor before taking any action.
----Vinaykumar hiremath, CMT

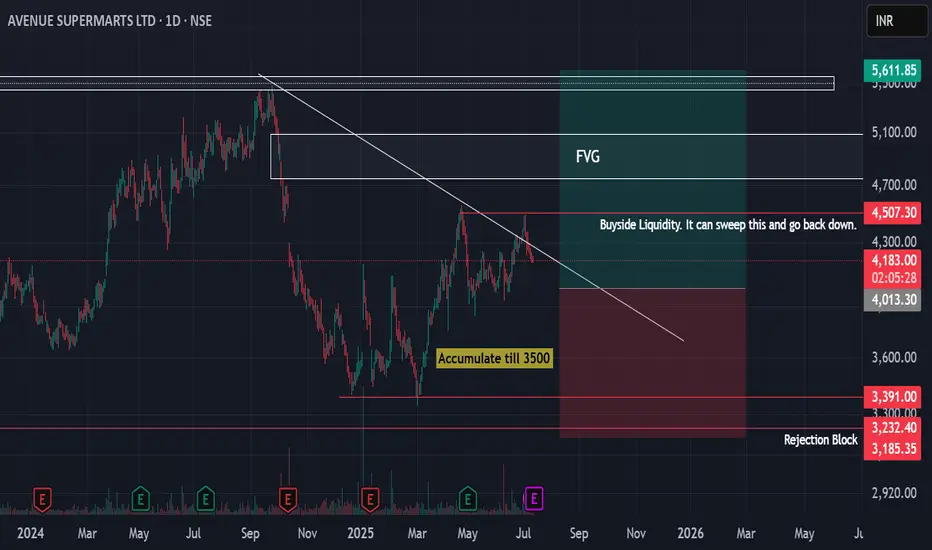
DMART Looking for some upside if everything goes smoothIn the short term, we can see a sweep of the buyside liquidity which has been marked.
For a longer term - atleast a year - one can accumulate for 5400-500 or higher levels.
A rejection block has been marked in case things go south
Buy strong confirmationeverything mention about in my chart
technical strong uptrend DMART stock
buy current market price
target 4970
duration 2 weeks only
happy trade
Happy profit
conclusion; I am not sebi reg,, this is own idea,,

DMART : Buy Triggered DMART : Buy Triggered
First resistsnce level to be watched out for is at 4560.
( Not a Buy / Sell Recommendation
Do your own due diligence ,Market is subject to risks, This is my own view and for learning only .)
DMART - LONGNSE:DMART Weekly rounding bottom formation , price giving breakout with retest and again breakout may continue trend upward till previous top.

Dmart is about to give a breakoutDmart is about to give a breakout we can take a swing trade in d mart above 4250

DMART CMP 4000.DMART is a Portfolio stock for long term Players.Currently trading at hugh discount.Add this to your portfolio.Last quarters numbers are very strong making it a good fundamental stock. 4000 is a down trendline support this level is best risk reward setup for this.


DMart Ready for a Big Move? 2025 Breakout in Sight!
DMart | Long-Term Investment Plan (Weekly Chart Analysis)
Symbol: NSE:DMART | CMP: ₹4,131.50
Chart Summary:
DMart is forming a long base and approaching a consolidation breakout on the weekly chart. CMP is approx. 30% below the 52-week high , offering a potential long-term opportunity.
Key Levels:
Entry Zone: ₹4200
Support: ₹4000
Resistance (2025 High): ₹4288.60
Breakout Zone: ₹4678.60 (52W High)
Targets: ₹4650 / ₹5450 / ₹6000 / ₹6500
Chart Highlights:
Price holding strong horizontal support zone (₹3,300–₹3,500)
Retesting breakout levels after long-term accumulation
All-time high and 52W high are 30–40% away — good long-term potential
Fundamentals:
Q3 FY25 Revenue: ₹15,972.55 Cr ( +17.7% YoY )
Net Profit: ₹723.54 Cr ( +4.8% YoY )
ROE: 13.56% | PE: 98.60 | Low Debt
Promoter Holding: 74.65% | FII + DII: 17.1%
Bias:
Long-term bullish bias building. Weekly close above ₹4288 may lead to breakout. Setup supported by price structure + fundamentals.
Disclaimer: Not financial advice. Do your own research.
#DMart #Breakout #Investment #NSE #TradingViewIndia #TechnicalAnalysis

DMART Technical Analysis – 2H Chart (As of April 5, 2025)📊 Chart Structure Analysis (2h TF)
The chart is forming a classic Triple Top or a Head and Shoulders variant (with the 2nd peak being the highest).
All three peaks are touching the same horizontal resistance zone around ₹4,100–₹4,150.
The bottom support (neckline) is consistent, around ₹3,400 – giving a clear rectangular range.
This is a distribution pattern forming over time.
✅ Pattern Forming: Triple Top / Distribution Zone
🔺 Resistance Zone: ₹4,100 – ₹4,150
🔻 Support (Target) Zone: ₹3,400 – ₹3,450
📌 Key Observations:
Third Touch of Resistance: Price is testing the resistance zone for the third time without breaking out, indicating potential exhaustion.
Volume Analysis:
Peak 1 (Left Shoulder): High volume – likely smart money exiting.
Peak 2 (Head): Slightly lower volume – weakening bullish strength.
Peak 3 (Right Shoulder): Declining volume trend → Distribution confirmed.
Impulse Fall Tendency: In both previous tops, the fall has been sharp and direct, suggesting a similar move if it breaks again.
Breakdown Trigger: A candle closing below ₹4,000 with volume expansion can trigger a fall to ₹3,400.
Caution for Longs: Until a breakout above ₹4,150 with strong volume, long trades should be avoided.
🎯 Target and Risk Zones, Level Observation
Resistance (~₹4,150) Strong zone, tested 3 times, failed breakout → bearish sign.
Support (~₹3,400) Equal lows – neckline of triple top → potential target if breakdown occurs
Target Range ~₹3,400–₹3,450, as noted in the chart with a purple arrow
Fall Trigger A red candle closing below ₹4,000 with increasing volume is a likely trigger.
📌 Psychological & Market Dynamics
This is a well-formed distribution range, and the lower volumes at highs tell us that retail traders may be buying while smart money is exiting.
If the price closes below ₹4,000 with a decent volume spike, it could trigger stop losses and short positions, accelerating the fall.
🔁 Alternate Bullish Scenario (Low Probability for Now)
If somehow DMART breaks above ₹4,150 with strong volume, that would invalidate the triple top and open up fresh upside targets toward ₹4,400–₹4,500. However, current price and volume action do not support this for now.
📌 Conclusion
Bias: Bearish unless it breaks above ₹4,150 with volume.
Pattern: Triple top / distribution range.
Key Trigger: Breakdown below ₹4,000.
Fall Style: Sharp and impulsive, as seen before.
Target Zone: ₹3,400 – expect this to be hit quickly if breakdown starts.
Let me know if you’d like a Pine Script alert for this setup or want me to mark it as a watchlist trade idea with a checklist.
⚠️ DISCLAIMER
This analysis is purely for educational and informational purposes. It is not a recommendation to buy or sell any securities. Trading and investing in the stock market involves risk. Please consult with your financial advisor before making any trading decisions. The author is not responsible for any financial losses that may occur.

DMART Bearish Butterfly Pattern with Divergence🔍 Pattern Identified:
Butterfly Bearish Harmonic Pattern complete near the top.
The right shoulder of the pattern has shown Positive Divergence:
On Awesome Oscillator (AO) — price made higher highs while AO made lower highs.
On Volume — clear divergence showing weakening momentum even as price tried to rise.
These are strong early warning signals that smart money is exiting.
🧠 Technical Confluence:
📉 Bearish Divergence: Suggests exhaustion of bullish momentum.
📐 Harmonic Pattern Target: Typically, butterfly patterns suggest:
Target 1 at 38.2% retracement of leg CD.
Target 2 at 61.8% retracement or more — you have identified this beautifully with a likely target near ₹3800.
📊 Impulse Wave Forecast:
Your projected 5-wave Elliott impulse indicates a sharp, fast corrective leg is expected.
Wave I and III are typically the strongest — if wave I begins soon, the fall could be steep.
🎯 Key Levels:
Immediate Resistance: ₹4180–4200 zone (top of butterfly).
Breakdown Trigger Zone: Below ₹4100–4080 can accelerate fall.
Support Levels:
₹4000 (psychological & previous structure)
₹3900 (near wave iii completion)
Final Target Zone: ₹3800 – aligns with the butterfly harmonic projection.
⏱ Time Expectation:
You mentioned 2–3 days for the full fall — this is reasonable given:
"Volume divergence indicates smart selling is already happening.
Once the neckline or structure breaks, algo selling may kick in, pushing the price rapidly toward the target."
📌 Conclusion:
Bearish bias is very strong based on pattern + divergence.
Expecting a sharp move toward ₹3800 in a short period.
High probability trade setup with clearly defined entry, stop-loss, and target.
⚠️ Disclaimer:
This is not investment advice. The analysis is for educational purposes only. Please consult your financial advisor before making any trading or investment decisions. Trading in the stock market involves risk, and you should trade or invest only based on your own judgment.

DMart Charts showing strengthThe chart pattern assisted by all-time low valuations for DMart makes it worth studying.
The levels are marked clearly.
This isn't a recommendation. I intend to pass my knowledge of technical analysis through the published charts.
Conduct your own research before investing.
