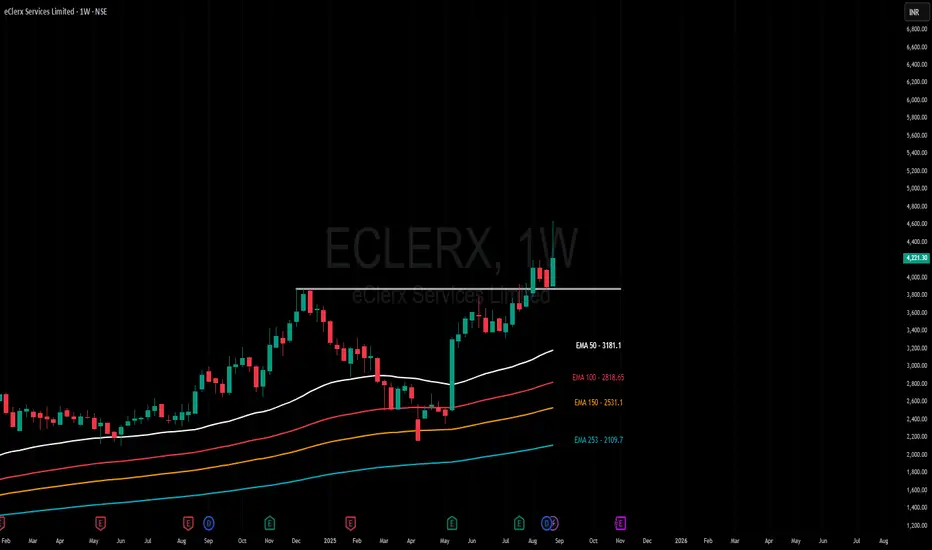
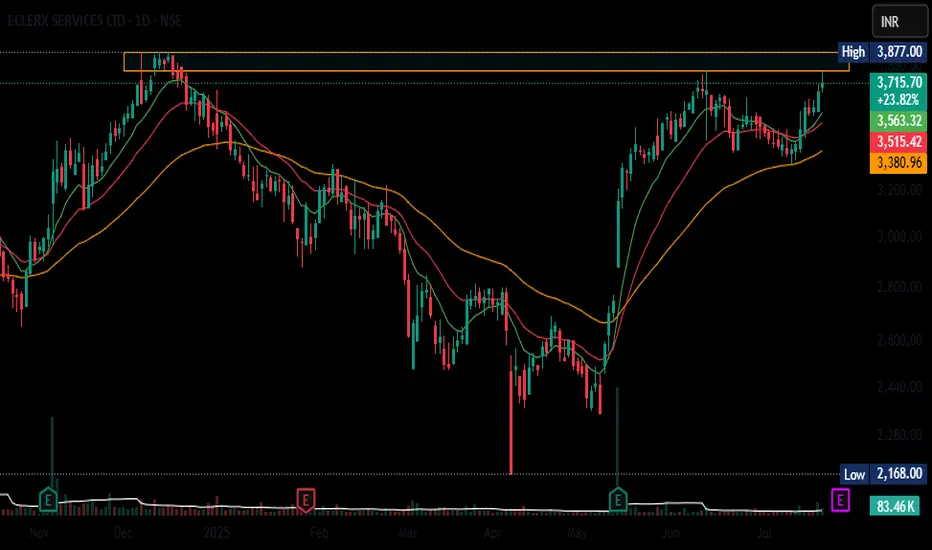
Amazing breakout on WEEKLY Timeframe - ECLERXCheckout an amazing breakout happened in the stock in Weekly timeframe, macroscopically seen in Daily timeframe. Having a great favor that the stock might be bullish expecting a staggering returns of minimum 25% TGT. IMPORTANT BREAKOUT LEVELS ARE ALWAYS RESPECTED!
NOTE for learners: Place the breakout levels as per the chart shared and track it yourself to get amazed!!
#No complicated chart patterns
#No big big indicators
#No Excel sheet or number magics
TRADE IDEA: WAIT FOR THE STOCK TO BREAKOUT IN WEEKLY TIMEFRAME ABOVE THIS LEVEL.
Checkout an amazing breakout happened in the stock in Weekly timeframe.
Breakouts happening in longer timeframe is way more powerful than the breakouts seen in Daily timeframe. You can blindly invest once the weekly candle closes above the breakout line and stay invested forever. Also these stocks breakouts are lifelong predictions, it means technically these breakouts happen giving more returns in the longer runs. Hence, even when the scrip makes a loss of 10% / 20% / 30% / 50%, the stock will regain and turn around. Once they again enter the same breakout level, they will flyyyyyyyyyyyy like a ROCKET if held in the portfolio in the longer run.
Time makes money, GREEDY & EGO will not make money.
Also, magically these breakouts tend to prove that the companies turn around and fundamentally becoming strong. Also the magic happens when more diversification is done in various sectors under various scripts with equal money invested in each N500 scripts.
The real deal is when to purchase and where to purchase the stock. That is where Breakout study comes into play.
LET'S PUMP IN SOME MONEY AND REVOLUTIONIZE THE NATION'S ECONOMY!
ECLERX trade ideas
eclerx target 10,000, cmp 3500ECLERX | Classic Cup Breakout ☕🚀
Buy Zone: ₹3500
🎯 Target: ₹10,000 in 2–3 years
IT + BPM + AI automation = Silent compounder in the making.
Strong volume + base forming above previous highs.

Ready for a Range Breakout...NSE:ECLERX trade at 2715. Resistence is @ 2820 & Support is @ 2320
on the daily time frame chart make a long range. After the Breakout you can watch it as a next Resistence @ 3400...


Eclerx - Runding Bottom BreakoutEclerx has given breakout of rounding bottom
Entry - Above 2960
SL - 10%
TGT - Highlighted on chart.

10% club welcomes you with a new stockweekly to monthly buy, it will show a shoot up growth and 10% will be attained. Exit from your position accordingly.

ECLERX LONG ECLERX LONG Suggested
Monthly Demand 2250
Weekly Demand 2238
Currently Price is close to Monthly & Weekly
Upside First Target 2800
Final Target for Current Demand Closure is 3400

Falling wedge pattern on ECLERXECLERX formed a falling wedge on daily chart. Multiple support and resistance were tested during the formation of pattern. Price broke out of the pattern today with above average volume and the momentum seems to be good for third consecutive day. Stop loss can be had just below breakout candle low with target at previous all time high. This trade offers an ideal risk reward of 1:2 depending on where you enter.
Hope you like this idea. If so please boost this idea or leave a comment below on what you think. Otherwise happy trading :-).


BUY TODAY SELL TOMORROW for 5% DON’T HAVE TIME TO MANAGE YOUR TRADES?
- Take BTST trades at 3:25 pm every day
- Try to exit by taking 4-7% profit of each trade
- SL can also be maintained as closing below the low of the breakout candle
Now, why do I prefer BTST over swing trades? The primary reason is that I have observed that 90% of the stocks give most of the movement in just 1-2 days and the rest of the time they either consolidate or fall
Trendline Breakout in ECLERX
BUY TODAY SELL TOMORROW for 5%


ECLERX SERVICES LONG SWING IDEA ECLERX SERVICES is now trading at 1801.75 .
the stock is indicating a cup and handle pattern .
for now we are expecting a trade on a breakout .
so the entry will be at 1864.85
and the target for this breakout will be at
T1 : 1980.15
T2 : 2201.10 respectively .
its just an idea for a trade ,
please do your own analysis
boost it if you found this informative .

eClerx Services Ltd.*eClerx Services Ltd*
Rising C&H Formation on Yearly Basis.
C&H Formation on Monthly Basis.
7.3% Upside Needed to BreakOut ATH Priceline. Crossed & Sustained, then Good to Go!!
RSI: 1H =1D >W>M
Strong Vol Consolidation & Continued BuiltUp.
*Trail SL with Upside*
*Book Profit as per Risk Appetite*
Do Your Own Research as well. This is an Opinion.
Happy Investing 😇

stock to be trackedthe stock broke out with huge volume along with long correction and a long cup with a flat handle, signs are all good to add to the watchlist. let's see in the coming weeks how the stocks perform.

Resistance BreakoutPlease look into the chart for a detailed understanding.
Consider these for short-term & swing trades with 2% profit.
For BTST trades consider booking
target for 1% - 2%
For long-term trades look out for resistance drawn above closing.
Please consider these ideas for educational purpose

May Slide !
The stock is looking in a down Trend and as per price action things look pretty tricky from the current point of you I am not expecting it to go on the upside but for me specification when the stock is trying to close below the line of sand more specifically the level of 1385 it will try to go in the downward direction and as we can see three times at this testing already 1200 -1270 levels but this time if it will Go there then most probably it will try to break those levels and go deeper and that direction.
please try to work according to the price action.
Gratify if you appreciate the practice then you can like it, share it and
If you want me to investigate any chart for you then would cherish doing that for you.
Thank you for your time and support.
Stay safe.

ECLERX 1DTRADING COMMUNITY
JOIN US ONLY IF YOU WANT PEACE AND PROFIT IN YOUR TRADING LIFE.
I am not a call provider, not SEBI approved person. All the charts and PnL here are for educational purposes. Consult a professional financial advisor before you invest.

eClerex making some clever movesEClerx Services Ltd. is an IT consultations & outsourcing company. It provides services based on process management, change management, data driven insights advance analytics etc. The company serves sectors like finance, telecommunication, media & software etc. eClerx Services CMP is 1394.70.
Negative aspects of the company are declining annual net cash flow. Positive aspects of the company are improving annual net profits, no debt, FIIs increasing stake, MFs are increasing stake, promoter holding increasing & zero promoter pledge.
Entry after closing above 1411. Targets in the stock will be 1446 & 1496. Long term target in the stock will be 1557 & 1681. Stop loss in the stock should be maintained at closing below 1224.

swing trade take position as per risk reward do ur own analysis before taking any trade stock name eclerx service

EclerxEclerx cmp 1445
Buy above 1470
Fundamentally strong company
Good for short term/Swing /Positional


eClerx - positional longBreakout from inverse head and shoulder and downward slopping line, and a retest is also complete. Initiate long positions when price sustains above 2225.
Chart pattern looks very good and it has a potential to hit 2380, 2495 levels, above it a very high chances that a big rounding base formation will happen and then first target will be 2879 and a new high.
Keep a stop loss below 2098 or below the downward support line depending on your risk appetite.
