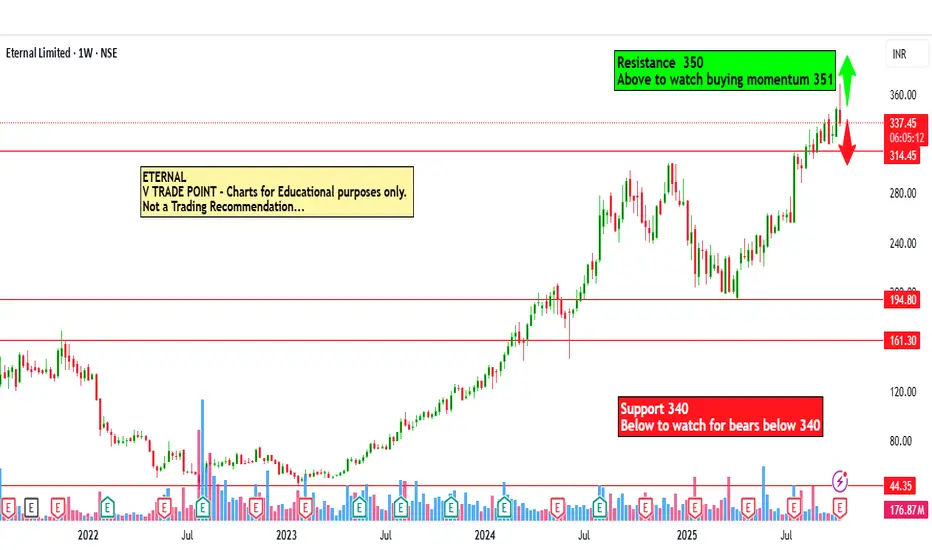
Eternal Ltd for 17th Oct #ETERNAL Eternal Ltd for 17th Oct #ETERNAL
Resistance 350 Watching above 351 for upside momentum.
Support area 340 Below 345 gnoring upside momentum for intraday
Watching below 340 for downside movement...
Above 345 ignoring downside move for intraday
Charts for Educational purposes only.
Please follow strict stop loss and risk reward if you follow the level.
Thanks,
V Trade Point
Trade ideas
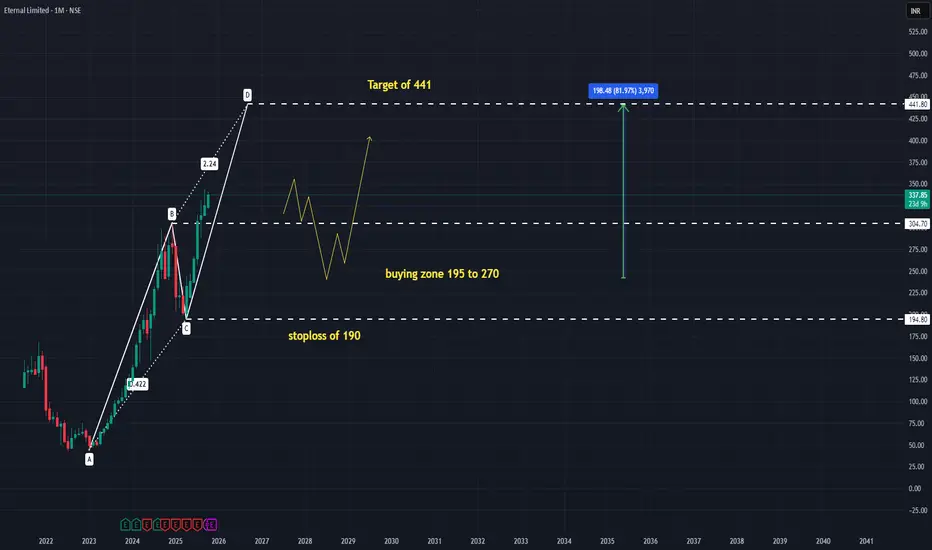
ETERNAL ABCD LONG PATTERN ACTIVATEDCORRECTION REQUIRED FOR SAFE ENTRY
and small stoploss,
entry will be updated the proper price structure if correction happens
eternal eternity time is over in eternal as per charts.
I will be looking for a bearish move in this

Eternal: Positional Long on Cup Base Breakout Eternal shows a Cup base poised for breakout , favouring a positional long with good volume.
$NSE:ETERNAL To SkyRocket in the Coming Days !NSE:ETERNAL
Very Good Price Action is Already Formed.
Its the Time to make Accumulations of Stock near the Current price.
Its The Company, Which Goin to Cater Services the Future.
Its Now or Never !
Boost the idea ! Pal

Amazing breakout on WEEKLY Timeframe - ETERNALCheckout an amazing breakout happened in the stock in Weekly timeframe, macroscopically seen in Daily timeframe. Having a great favor that the stock might be bullish expecting a staggering returns of minimum 25% TGT. IMPORTANT BREAKOUT LEVELS ARE ALWAYS RESPECTED!
NOTE for learners: Place the breakout levels as per the chart shared and track it yourself to get amazed!!
#No complicated chart patterns
#No big big indicators
#No Excel sheet or number magics
TRADE IDEA: WAIT FOR THE STOCK TO BREAKOUT IN WEEKLY TIMEFRAME ABOVE THIS LEVEL.
Checkout an amazing breakout happened in the stock in Weekly timeframe.
Breakouts happening in longer timeframe is way more powerful than the breakouts seen in Daily timeframe. You can blindly invest once the weekly candle closes above the breakout line and stay invested forever. Also these stocks breakouts are lifelong predictions, it means technically these breakouts happen giving more returns in the longer runs. Hence, even when the scrip makes a loss of 10% / 20% / 30% / 50%, the stock will regain and turn around. Once they again enter the same breakout level, they will flyyyyyyyyyyyy like a ROCKET if held in the portfolio in the longer run.
Time makes money, GREEDY & EGO will not make money.
Also, magically these breakouts tend to prove that the companies turn around and fundamentally becoming strong. Also the magic happens when more diversification is done in various sectors under various scripts with equal money invested in each N500 scripts.
The real deal is when to purchase and where to purchase the stock. That is where Breakout study comes into play.
Check this stock which has made an all time low and high chances that it makes a "V" shaped recovery.
> Taking support at last years support or breakout level
> High chances that it reverses from this point.
> Volume dried up badly in last few months / days.
> Very high suspicion based analysis and not based on chart patterns / candle patterns deeply.
> VALUABLE STOCK AVAILABLE AT A DISCOUNTED PRICE
> OPPURTUNITY TO ACCUMULATE ADEQUATE QUANTITY
> MARKET AFTER A CORRECTION / PANIC FALL TO MAKE GOOD INVESTMENT
DISCLAIMER : This is just for educational purpose. This type of analysis is equivalent to catching a falling knife. If you are a warrior, you throw all the knives back else you will be sorrow if it hits SL. Make sure to do your analysis well. This type of analysis only suits high risks investor and whose is willing to throw all the knives above irrespective of any sectoral rotation. BE VERY CAUTIOUS AS IT IS EXTREME BOTTOM FISHING.
HOWEVER, THIS IS HOW MULTIBAGGERS ARE CAUGHT !
STOCK IS AT RIGHT PE / RIGHT EVALUATION / MORE ROAD TO GROW / CORRECTED IV / EXCELLENT BOOKS / USING MARKET CRASH AS AN OPPURTUNITY / EPS AT SKY.
LET'S PUMP IN SOME MONEY AND REVOLUTIONIZE THE NATION'S ECONOMY!
Eternal -ZomatoWhen you look at the chart after the results, there’s a clear spike in the candle. This could indicate one of two possibilities: either distribution or accumulation after the volatility settles. One thing to note is that the spike in the candle occurs above the short-term moving average, and the volume is also low. This suggests that the script may not be ready to move down yet. This is just an observation, not a recommendation — simply my view on the Eternal chart.
What is low risk point? It is near to lowest moving avg on the chart which is 21 days .
Chart period -Weekly
(This is purely an observation, not a recommendation.)

Ye Chart Kuch Kehta Hai - Eternal LimitedTechnical Analysis Recommendation for Eternal Limited:
The technical trend for Eternal Limited is currently bullish with moderate strength as of early August 2025. Key indicators include a bullish MACD on the weekly chart, bullish moving averages on the daily timeframe, and a bullish KST indicator on weekly and monthly charts. However, the weekly RSI indicates some short-term weakness, suggesting minor caution.
Recent technical signals include a 5-day EMA crossover, stochastic crossover on the weekly chart, and 10-day EMA crossover on the daily chart, all indicating buy signals with historical average gains of 4.7% to 11.8% within weeks after such signals.
Moving averages across timeframes (5, 10, 20, 50, 100, 200 days) show a strong buy consensus.
Price is trading near key resistance and pivot levels with expected upside momentum if a breakout occurs.
Clear Technical Recommendation:
Buy or hold if you have positions, especially on confirmed breakouts and after pullbacks to support levels. Use stop-losses below recent swing lows to manage risk.
Fundamental Analysis Recommendation for Eternal Limited:
The company’s valuation is very high, with a P/E ratio close to 999 and price-to-book around 9.6, reflecting a premium typical for high-growth sector stocks.
The Earnings Per Share (EPS) is low but positive (around ₹0.31), with growth in revenue highlighted by a strong quarter-on-quarter growth of 21.29%, the highest in 3 years.
Return on Equity (ROE) and Return on Capital Employed (ROCE) have shown improvement recently, indicating better operational efficiency and profitability recovery in fiscal 2025 compared to prior years where returns were negative or very low.
Interest coverage ratio is healthy at 11.13, showing the company comfortably covers interest expenses.
No dividend yield is offered, indicating reinvestment into growth.
Fundamental risks include the stretched valuations and reliance on sustained strong earnings growth to justify the premium multiples.
Clear Fundamental Recommendation:
Hold if you believe in continued earnings growth and operational improvement. For new buyers, wait for clearer signs of sustainable profit momentum or valuation compression to reduce downside risk.
In summary:
This separation clarifies that technically the stock looks attractive for buying or holding on strength, while fundamentally it requires caution and close monitoring of earnings and valuation justification.

Review and plan for 22nd July 2025Nifty future and banknifty future analysis and intraday plan.
Quarterly results.
This video is for information/education purpose only. you are 100% responsible for any actions you take by reading/viewing this post.
please consult your financial advisor before taking any action.
----Vinaykumar hiremath, CMT

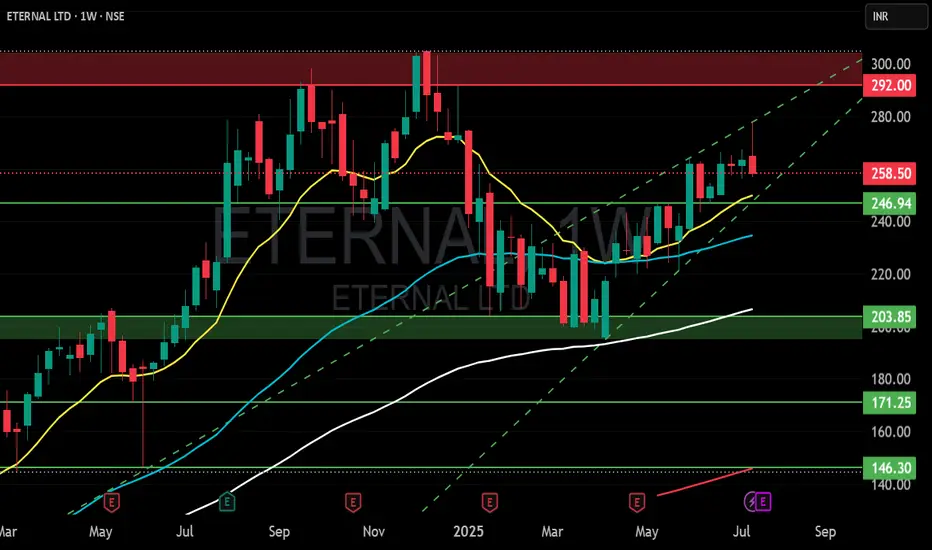
ETERNAL LTD S/RSupport and Resistance Levels:
Support Levels: These are price points (green line/shade) where a downward trend may be halted due to a concentration of buying interest. Imagine them as a safety net where buyers step in, preventing further decline.
Resistance Levels: Conversely, resistance levels (red line/shade) are where upward trends might stall due to increased selling interest. They act like a ceiling where sellers come in to push prices down.
Breakouts:
Bullish Breakout: When the price moves above resistance, it often indicates strong buying interest and the potential for a continued uptrend. Traders may view this as a signal to buy or hold.
Bearish Breakout: When the price falls below support, it can signal strong selling interest and the potential for a continued downtrend. Traders might see this as a cue to sell or avoid buying.
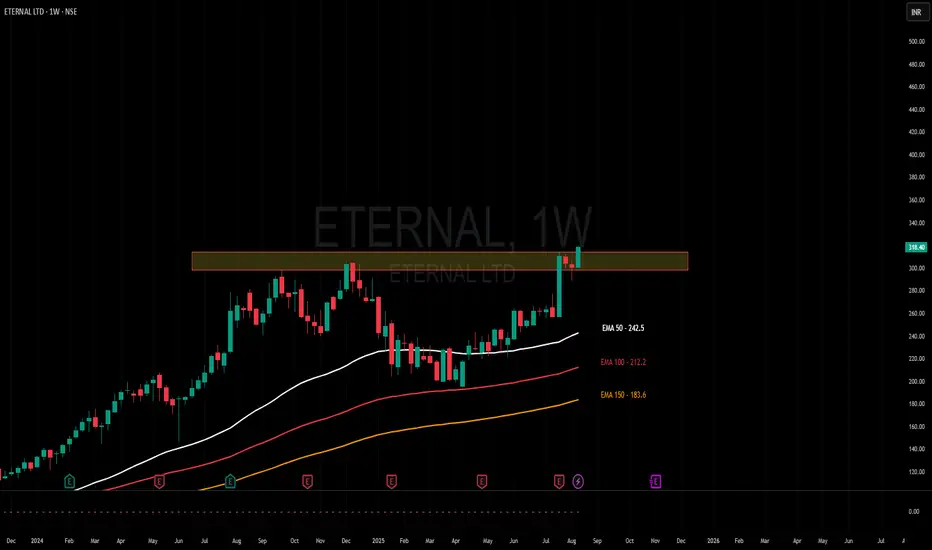
MA Ribbon (EMA 20, EMA 50, EMA 100, EMA 200) :
Above EMA: If the stock price is above the EMA, it suggests a potential uptrend or bullish momentum.
Below EMA: If the stock price is below the EMA, it indicates a potential downtrend or bearish momentum.
Trendline: A trendline is a straight line drawn on a chart to represent the general direction of a data point set.
Uptrend Line: Drawn by connecting the lows in an upward trend. Indicates that the price is moving higher over time. Acts as a support level, where prices tend to bounce upward.
Downtrend Line: Drawn by connecting the highs in a downward trend. Indicates that the price is moving lower over time. It acts as a resistance level, where prices tend to drop.
Disclaimer:
I am not a SEBI registered. The information provided here is for learning purposes only and should not be interpreted as financial advice. Consider the broader market context and consult with a qualified financial advisor before making investment decisions.
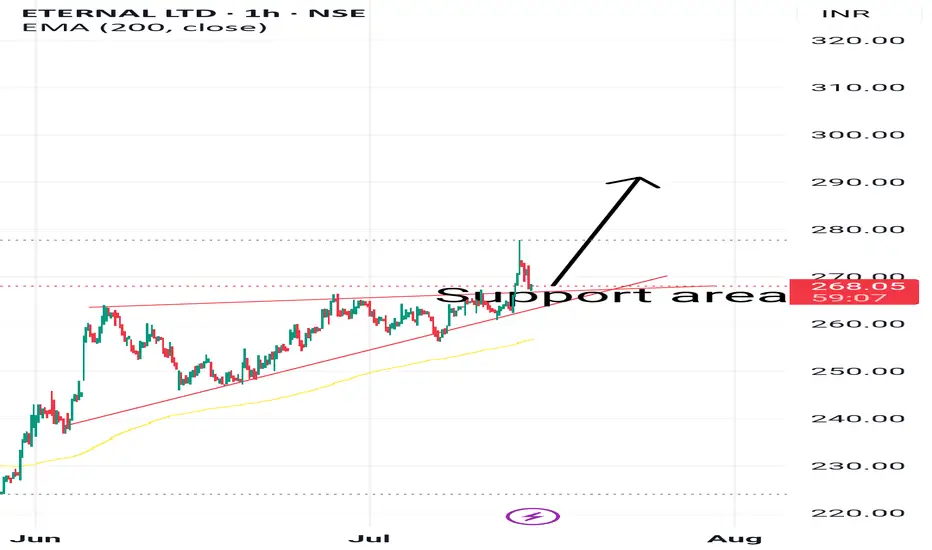
ETERNALHi,
Breakout of acceding triangle. And now price at support area.
Latest Swing low is stop loss area
This idea is for Educational purpose and paper trading only. Please consult your financial advisor before investing or making any position. Facts or Data given above may be slightly incorrect. We are not SEBI registered
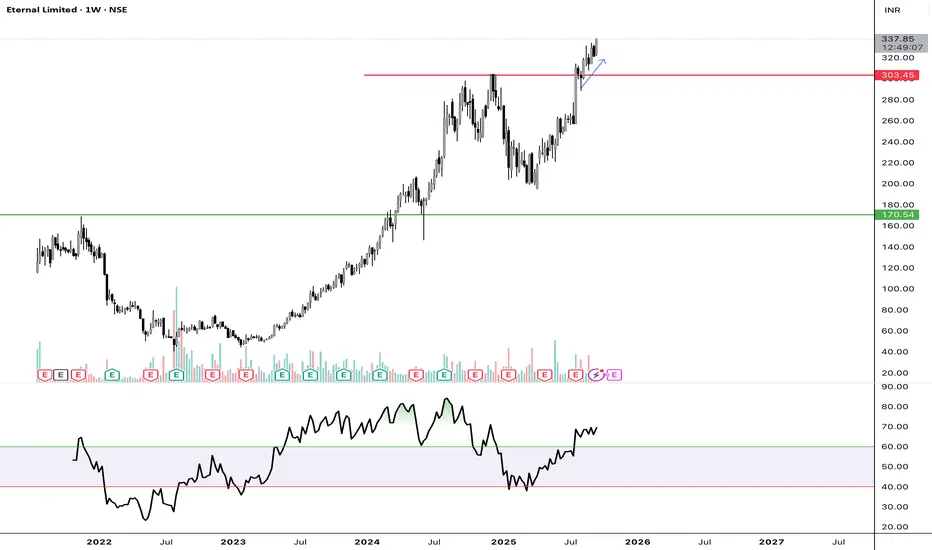
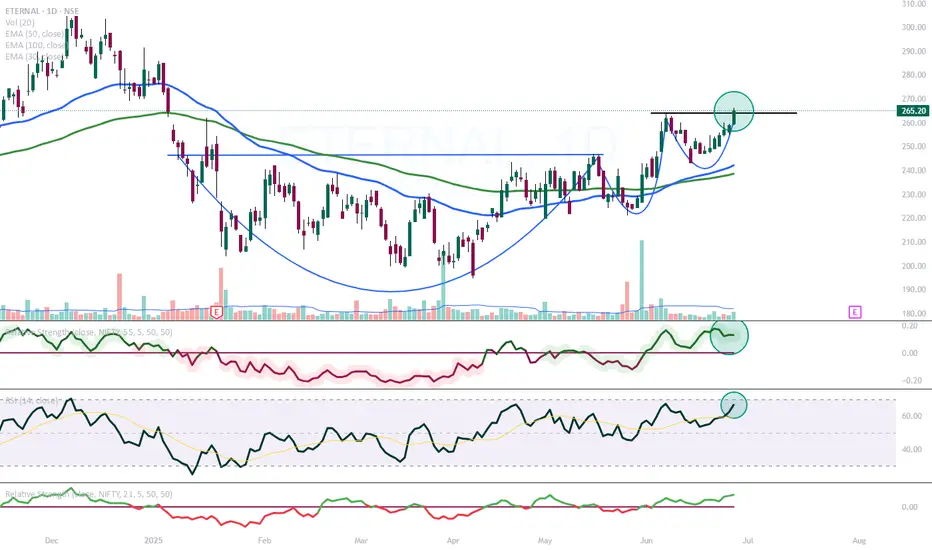
ETERNAL gaining momentum!NSE:ETERNAL seems to be gaining momentum
RS positive
RSI Above 60
Trying to break out.
We need volume confirmation on this breakout.
ETERNAL| Buy @LTP | SL below 240 | Targets 326, 440Disclaimer:
This is not financial advice. Please do your own research or consult with a financial advisor before making any investment decisions. Investments in stocks can be risky and may result in loss of capital.

Eternal Ltd Daily Trend AnalysisEternal Ltd (formerly Zomato Ltd) has broken out of a consolidation phase, indicating the potential start of a bullish trend. The stock appears poised to reach the target level of ₹285 in the near term.
Disclaimer: Traders are encouraged to perform their own technical analysis and implement proper risk management before initiating any positions.

Zomato complete its whole elliot wave does another coming??????Zomato complete its whole Elliot wave move now its making another or its a time for some rest ??????

"U Shape Pattern" *||Eternal Ltd||*
* 6 Month bottom Rounding Tight Consolidation touched on Support & Resistance multiple times, and breakout.
* Expected To reach at the next level. Price level - 298

ETERNAL - Eternal Ltd. (2 hours chart, NSE) - Long PositionETERNAL - Eternal Ltd. (2 hours chart, NSE) - Long Position; short-term research idea.
Risk assessment: Medium {volume structure integrity risk}
Risk/Reward ratio ~ 2.36
Current Market Price (CMP) ~ 240
Entry limit ~239 to 237 (Avg. - 238) on May 05, 2025
1. Target limit ~ 247 (+3.78%; +9 points)
2. Target limit ~ 251 (+5.46%; +13 points)
Stop order limit ~ 232.5 (-2.31%; -5.5 points)
Disclaimer: Investments in securities markets are subject to market risks. All information presented in this group is strictly for reference and personal study purposes only and is not a recommendation and/or a solicitation to act upon under any interpretation of the letter.
LEGEND:
{curly brackets} = observation notes
= important updates
(parentheses) = information details
~ tilde/approximation = variable value
-hyphen = fixed value

Eternal : Swing / Momentum Pick#eternal #chartpattern #breakout #swingtrading #momentumstocks
Eternal : Swing/Momentum Pick
>> Good Clean Breakout
>> Buy at CMP or if it comes near Safe Entry Zone u can add more
>> Good Strength in Stock
>> High Probability Chart Pattern
>> min 12% upside Visible
Swing Traders can Book or lock Profit at 10% and keep Trailing
Disclaimer : This is not a Trade recommendation, Do your own Analysis and consult your Financial advisor before taking position in the stock. Charts Shared are for Educational Purpose only, Pls note i may or may not have position in it.
