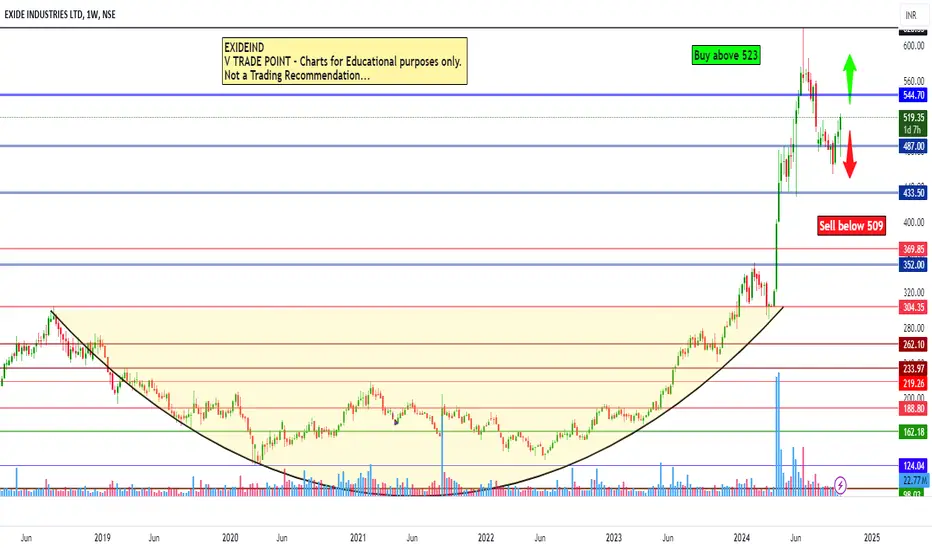
Exide Industries Ltd view for Intraday 10th October #EXIDEIND Exide Industries Ltd view for Intraday 10th October #EXIDEIND
Buying may witness above 523
Support area 515. Below ignoring buying momentum for intraday
Selling may witness below 509
Resistance area 515
Above ignoring selling momentum for intraday
Charts for Educational purposes only.
Please follow strict stop loss and risk reward if you follow the level.
Thanks,
V Trade Point
EXIDEIND trade ideas
Exide Industries Set for a Bullish Rally, Target ₹577.75Exide Industries is showing a strong reversal and bullish momentum after a 10-13% correction, making it an attractive buy for swing traders. Currently trading at ₹502.40, the stock is poised to rally ahead of its quarterly results, with a target of ₹577.75 and a stop-loss at ₹465.60.
Key Technical Insights:
The stock is in a bullish reversal after its recent correction, suggesting that upward momentum is regaining strength.
Multiple RSI indicators are above 60, confirming bullishness on both the weekly and monthly charts.
Unlike most other stocks and indices that saw a 4-6% correction last week, Exide Industries remained bullish, a sign of strong relative strength in the current market.
With quarterly results due on 04 November, the stock may see a pre-results rally, similar to the more than 10% rally it experienced after the previous quarter’s results.
Conclusion:
Exide Industries presents an excellent swing trading opportunity, with a target of ₹577.75 and a stop-loss at ₹465.60.
The bullish momentum, both technically and in anticipation of upcoming results, makes this stock a strong pick in the current market environment.
Disclaimer: This is for educational purposes only and not financial advice. Please do your own research before making any investment decisions.

Exide afterva downtrend ready for upmoveAfter a correction ready for upmove, buy above 505, targetv550, sl-480

Exide afterva downtrend ready for upmoveAfter a correction ready for upmove, buy above 505, targetv550, sl-480

EXIDE INDUSTRIES BUY NOW Stock Name - Exide Industries
Trade Reason :
Weekly uptrend and correction Completed Fib - 50 % .
Take weekly Support .
4 hr - Trendline Breakout and Entry confirm .
Entry - Current Price or 478 Rs
Stoploss - 445 Rs
Target - 564.50 Rs
Expected Return - 12.35 %
Enjoyed ...

EXIDE: reversal and closure above 50 demaExide: has given closing above 50 day ema with big bar green candle.
This is a reversal indication, we may see stock rising more in coming days towards previous high.
its a strong fundamental company,
Breakout at 485 levels.
Stop less can be set at 450 levels

Exide Industry
RSI 38.89 on daily basis
RSI weekly 65
RSI monthly 81.30
Fib Retracement 0.50 level
476.80 Entry Point
454.05 Exit Point
Expected Level Swing High 618.05

One Minute Analysis of Exide IndustriesI think this video will be useful to my followers.
I put my time to show you my view on the exide industries.
All the levels are labeled in the chart. Any query? do write in the comments.
Thank you.
Disclaimer:
The information provided in this stock analysis is for informational purposes only and does not constitute financial advice. Investing in stocks involves risk, and you should consider seeking advice from a qualified financial advisor before making any investment decisions. The author of this analysis does not hold any responsibility for any losses or gains made by any reader. Always conduct your own research and due diligence before making any investment decisions.

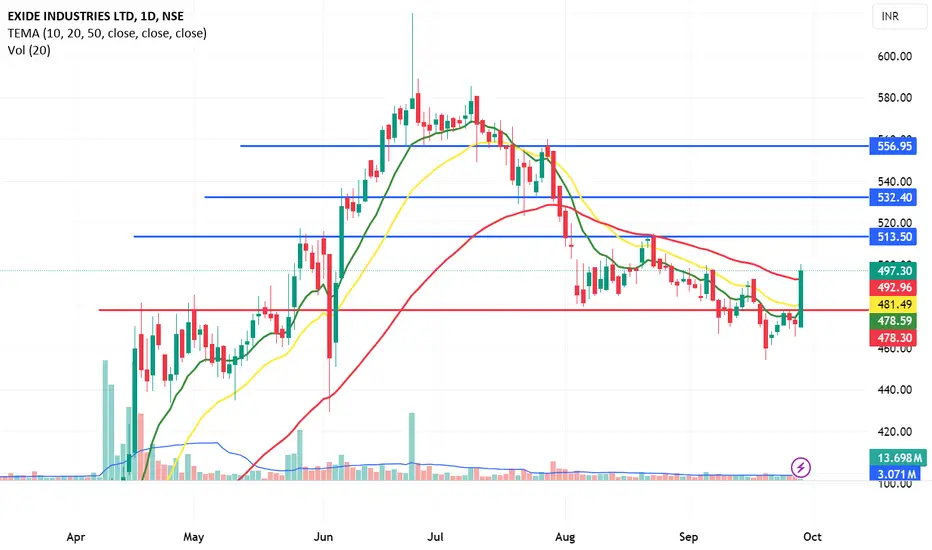
EXIDEIND NSE:EXIDEIND
Given closing above 50 Day MA
good for Swing trade
good volume support
RSI>55
Above 500
taregt - 513/532/556
Potential Bullish Breakout Setup in Exide Industries Ltd.This daily chart of Exide Industries Ltd. highlights a potential bullish setup, with key Fibonacci retracement levels drawn from the recent swing low at ₹480.55 to the swing high at ₹514.25. The price is consolidating around the 0.618 Fibonacci level, a critical support zone, which could indicate a potential reversal to the upside.
The price is currently near the ₹504.30 level, and a move higher could lead to a significant rally toward the ₹671.35 level (100% Fibonacci extension) and possibly ₹789.30 (1.618 Fibonacci extension).
Key Levels:
Support: ₹480.30 (Fibonacci 1.0 retracement)
Resistance: ₹514.25 (Fibonacci 0.0 retracement)
Potential Targets: ₹671.35 (100% Fibonacci extension), ₹789.30 (1.618 Fibonacci extension)
Analysis: The current consolidation near the 0.618 Fibonacci retracement suggests the possibility of a bullish reversal. Traders should watch for signs of strong buying activity or bullish candlestick patterns that confirm the move higher. The key resistance levels and Fibonacci extensions offer attractive target

EXIDE INDUSTRIES S/R for 19/7/24Support and Resistance Levels: In technical analysis, support and resistance levels are significant price levels where buying or selling interest tends to be strong. They are identified based on previous price levels where the price has shown a tendency to reverse or find support.
Support levels are represented by the green line and green shade, indicating areas where buying interest may emerge to prevent further price decline.
Resistance levels are represented by the red line and red shade, indicating areas where selling pressure may arise to prevent further price increases. Traders often consider these levels as potential buying or selling opportunities.
Breakouts: Breakouts occur when the price convincingly moves above a resistance level (red shade) or below a support level (green shade). A bullish breakout above resistance suggests the potential for further price increases, while a bearish breakout below support suggests the potential for further price declines. Traders pay attention to these breakout signals as they may indicate the start of a new trend or significant price movement.
20 EMA: The yellow line denotes 20 EMA, to interpret the 20 EMA, you need to compare it with the prevailing stock price. If the stock price is below the 20 EMA, it signals a possible downtrend. But if the stock price is above the 20 EMA, it signals a possible uptrend.
Disclosure: I am not SEBI registered. The information provided here is for learning purposes only and should not be interpreted as financial advice. It is important to consult with a qualified financial advisor before making any investment decisions. Tweets neither advice nor endorsement.

Will Exide move 45% upon a monthly breakout? cmp 507Buy Exide Ind around 504 - 507 with the short term target of 560 and target as 630, 730 as medium term
Positive outlook in auto segment: Auto segment performance is expected to improve driven by uptick in domestic production levels
UPS segment is the largest business vertical in the industrial segment and is expected to grow at 10%
Exports have steadily increased from ~4% to ~10% of revenues over the last few years and the company is focused on improving the export contribution to ~15% over the next two-three years
Exide is the market leader in the auto OEM market with ~60% of the market holds the 2nd position in the telecom sector and leadership in replacement segment.

Exide Industries intraday level fo 21st June #EXIDEIND Exide Industries intraday level fo 21st June #EXIDEIND
Buying opportunity above 577
Stop Loss area 570
Charts for Educational purposes only.
Please follow strict stop loss and risk reward if you follow the level.
Thanks,
V Trade Point

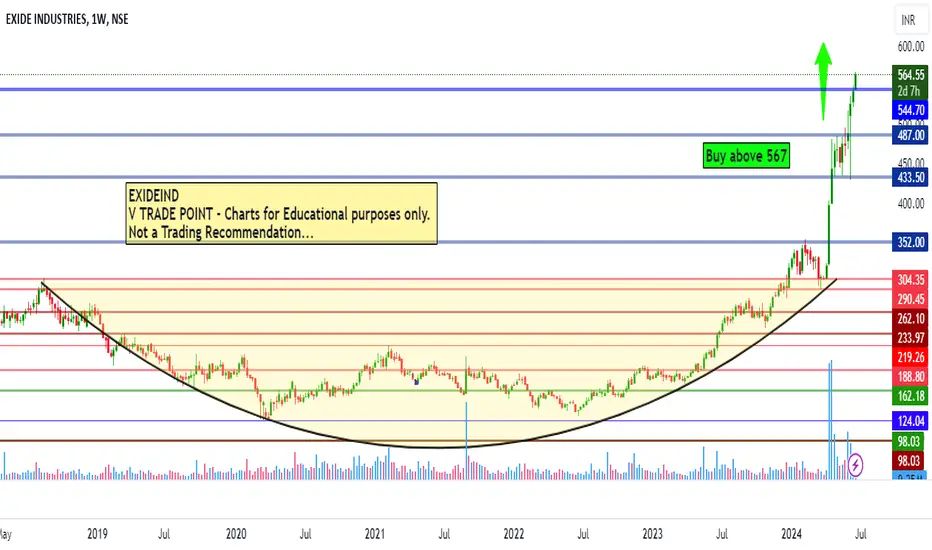
Exide Industries Intraday level for 19th June #EXIDEIND Exide Industries Intraday level for 19th June #EXIDEIND
Buying opportunity above 567
Stop Loss area 560
Charts for Educational purposes only.
Please follow strict stop loss and risk reward if you follow the level.
Thanks,
V Trade Point
EXIDE LEVELSEXIDE Industries has been trending since April and is currently in the final phase of its uptrend. It reached a high of 549.90 on June 13 but did not surpass that level. However, it's important to note that it touched the trendline and resistance level of 549.50, which is why it fell back to 542. Nevertheless, the stock's volume and strength have been well maintained. I anticipate it will break the trendline and resistance once more to reach its uptrend target levels of 630-680, as indicated in the chart.

EXIDEIND - add in watch listAs per my analysis., EXIDEIND can be added in watchlist for for Swing trade
Buy Above 297
Stop loss as per your comfort or 260
First Target will be 365
Second Target 446
Please comment if you wish to see my analysis any stocks.
Please do your due diligence before trading or investment.
Thank you.

EXIDE INDUSTRIESThe stock after a good up move has been re-accumulating for almost a month and half. Now the stock is on the verge of breaking out from this re-accumulation zone. The relative strength is turning positive and the money flow is also on the verge of reversing. Momentum which was weak has started picking up. The volume in the last two sessions has been high. The delivery volumes is also increasing. A good close above today's high, that is a good close above 500 will take the stock to the next orbit and it will move much higher.
We had caught the earlier breakout from the Rejection zone at 280 as well.

EXIDE INUDSTRIES - Tightening squeeze EXIDE is seen in a good tightening phase with a consolidation of about 40 days on daily time frame.
Consistent QoQ growth and contracting volume.
Good to keep on your watchlist.
Disclaimer: Please be advised that the information provided is not intended as financial advice. It is imperative to conduct thorough research before making any investment or trading decisions.

EXIDEIND 1DAY1. candle with a huge red volume is acts as a
strong support and resistance
2. after a break out and retest can observe.
.
.
.
.
.
.
.
I Am Not SEBI Registered Analyst. All Post and Levels Posting is only for educational and knowledge purpose. I Am not responsible for your any kind of loss or profit.
No Claim, All Rights Reserved.‼️

Bullish Flag Pattern in Exide Industries### Pattern Analysis
- Exide Industries is forming a bullish flag pattern, which indicates a potential upward move.
- This pattern suggests a continuation of the previous uptrend after a brief consolidation.
#### Trading Strategy
- Target Placement: Place your target slightly above the indicated target level on the chart.
- Stop Loss: Keep your stop loss a little below the marked stop loss level.
Stay cautious and follow your trading plan!

Exide Industries Ltd *Exide Industries Ltd*
P&F; Formation on Weekly Basis.
BreakOut above upper Flag Priceless Needed & to be Sustained. Watch it.
Strong Vol Consolidation done.
RSI: 1H >D

EXPECTED BUYING IMPORTANT LEVELS FOR THE YEARHey Folks!
All the important levels are marked along with the description.
I have introduced My new concept of "Time Probability" in this chart which is marked with "YELLOW CIRCLE". In simple words expecting a reversal or a breakout when the stock is in the "YELLOW CIRCEL" .
These levels are marked for expected Uptrend.
Strategy is simple.
Entry point is the buying area .
Stoploss is the yellow line.
Targets are the upper green lines.
Club these levels with your analysis to have an edge.

Exide Industries03/03/2024
Exide Industries
CMP 326.85
target: 335-350
SL-As per your risk
Information is only for study purpose
