EXIDEIND trade ideas


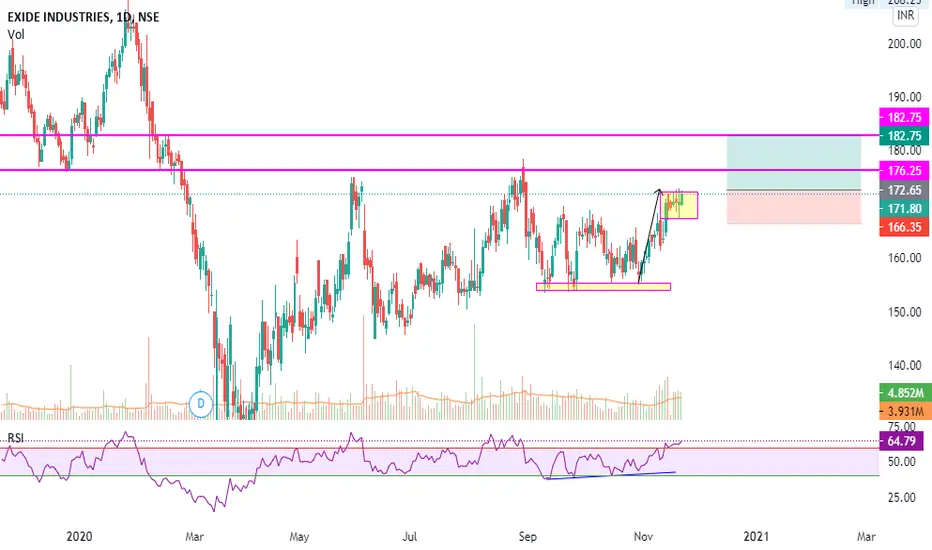
EXIDE - Multiple confirmation trade opportunity - Swing TradeThe above analysis is done purely based on price action and chart patterns.
The analysis is done on daily TF hence price may take few days to few weeks in order to reach the targets.
(This stock was analysed few months ago as well. To check that analysis, see the idea linked below)
The logic behind this analysis is explained in image itself. It is a multi-confirmation trade opportunity.
(Pls note that even after multiple confirmation, there's always a chance of trade going in opposite direction, hence trade as per your own risk management & position sizing)
Entry can be made between 190-CMP.
Targets and SL is shown in image itself with proper logic.
The zoomed-in image to show the formation of morning star reversal pattern at 0.618 Fibo level is below -
Zoomed-in image showing formation of Bull Flag pattern is below -
The above analysis is purely for educational purpose. Traders must do their own study before entering into any trade. Traders must trade as per their own risk taking capacity and money management. [/ b]
Feel Free to comment for any queries regarding the above stock or price action analysis in general.
Also check out my other ideas to understand how price action works and how it can be used to make regular profits without any complex strategies.


Exide Industries - BullishExide Industries CMP - 184.85
Looking bullish in higher time frame. One can go for Intraday / Swing Trade setup with the following entry, exit & targets. Positional players can buy in dips and accumulate for 200 target
Buy at 186 ONLY / Stop Loss - 182
Target 1 - 188
Target 2 - 190
Target 3 - 192 / 195
Swing Targets - 200 - 205 / Stop Loss 173
Disclaimer: This is my view and for educational purpose only.


Exide 15 m { short }Short as per chart .
Note :-
Entry - At the break of mentioned candle's low/high
Stop Loss -
In a Short Trade, I always use Previous Candle High ( PCH ) as a stop loss while entering the trade. Sometime I might use 15 M tf SL & trade in 30M tf which I'll mention. Vice Versa for long trades
Trailing Stop Loss ( TSL ) - Mostly I trail stop loss by PCH as price falls . I exit as PCH breaks & vice versa
Use of PSAR as TSL :- TSL get's hit in trend following due to noise, In such cases I use PSAR to be in trend & exit if PSAR direction change
You can use any one of above mentioned or your own way to manage risk
Time Frame :- I take ~ 90% of my intraday trades in 15m tf. Where my analysis might come from higher frames like W , D or 1hr chart pattern which will be mentioned.t
Target :- I do set target line based on support / resistance slightly above/ below it . Please pay attention to it


EXIDE (Ready to Breakout ?)Exide Industries has formed a triangle and is testing the upper end of the same. The stock hasn't recovered much post the pandemic's fall. Any breach of the upper triangle line might give rise to a new trend in the stock. A normal uptrend consolidation continuation pattern.
The moving averages are in a compact position as well with the 50 EMA below the 200EMA line (Red and Grey one respectively). Any crossover of the moving averages followed by a breakout with add further fuel to the fire to keep burning.
Times are looking uncertain by the day. A lot of good and bad news flowing in from every possible corner. Markets might start getting volatile yet again. With the wait for Pfizer Vaccine on (Gone into FDA review as of Friday) the market will be affected by other news more. Around 8th of December the FDA review team will be putting forward its observations and agenda for the meeting on the 10th of December. The market will be actively looking out for such things and any negative news from that end will surely send the world market at a downward spiral. However further approval of the same might give another lift to the market.
So Trade with Caution.


EXIDEIN ( DAILY) (INTERDAY TRADE) - Trend Line BreakoutEXIDEIND ( DAILY )
INTER DAY TRADE ONLY
Buy above 164
Target ( 1.2% ) 165.9
Broken Horizontal trendline with volume above avg and stochastic > 25
RSI > 50


EXIDE - Intraday or Very short term swing tradeThis analysis is purely based on price action & chart patterns
The analysis is on 15min TF hence target can be achieved in intraday trade or in couple of days
Trade strategy is explained in image itself.
Entry to be made only when reversal sign appears. Don't chase the stock
Keep trailing SL accordingly once in trade
Trade at your own risk and money management
Feel free to comment for any queries & suggestion

Exideind - Bullish WolfewaveExideind has bullish wolfe wave along with low rsi i.e. 24... 154.35 is major support. Target on chart


EXIDE INDUSTRIES - Ascending Triangle Pattern (Swing/Positional)This study is purely based on Price Action and Chart Patterns.
Reasons/Logics for going long is explained in image itself.
Trade strategy -
For Risk Taking Traders - Entry point would be above the high of next green candle or above 170 level - (ENTRY-1). SL is marked below the double bottom for Entry-1
For Risk Averse Traders - Entry point would be on the high of breakdown candle or on high of retesting candle (retesting the recent supply zone and taking it as support) - (ENTRY-2). SL is marked for Entry-2 as well.
This is for short term positional or swing trade.
SL should be trailed accordingly once the trade is initiated.
*This analysis is purely for study purpose, enter the trade at your risk and money management*
Comment for any further queries.


Exide Industries PriceBasically the price is showing weakness and closed below it's 200 Moving Average which is showing down trend for the stock. I'm waiting for 140-150 level for accumulation. Happy Investing 😇

EXIDEINDIf it crosses trendline over 167 then keep your Target at 175.
High chances of breaking trendline upperside.
