GAIL trade ideas


Gail bullish double bottom pattern Double Bottom pattern formed with very high volumes at the end on 5 min chart
Make sure you stay bullish if the market sentiment is bullish
keep checking out the Metal sector every now and then and keep your target likewise
For risk takers you can go bullish and keep a tight stop loss and then a trailing stop loss to book profit
will suggest everyone to ride the trend if possible


GAIL is getting BullishRecent Price action seems to have halted the downtrend. With SL of 4% below current Candle low will go long for 2X as first partial profit target of SL.

GAIL LONGon 15min timeframe gail is forming an ascending triangle pattern, trying to breach level of 84, which is also 0.5 fibo level, it has closed above 84, if it sustains over it then it can go further to test the 0.382 fibo level which is around 85 and even try to test its next resistance around 86.50 in coming session

GAIL seems to be ready to bounce back.NSE:GAIL
If you see daily chart of GAIL will notice in last 4-5 trading sessions it has tested (not a valid test last low was 81.95) its one of major support level of 80.65. And now trying to move up again.
93.45 will going to be bit of hurdle for GAIL. But overall chart looks bullish.
Prefer to plan your entries above 93.45 only SL is of 80.
This view is based on daily chart hence only short term traders/investors do consider this.


third trade for sept expirytrade for next week...
reason....
cci crossing above -100
stock taking support from fib ret level of march fall
heiken ashi resersal
CAUTION...always protect atleast 80% of initial capital


#GAIL #GAS #BANKNIFTY #NIFTY #NSE #TRADING #COVID19 #OIL #INVEST#GAIL
Gail Ltd.
CMP: 95.95
Target: 105 / 114 / 129
SL: 92


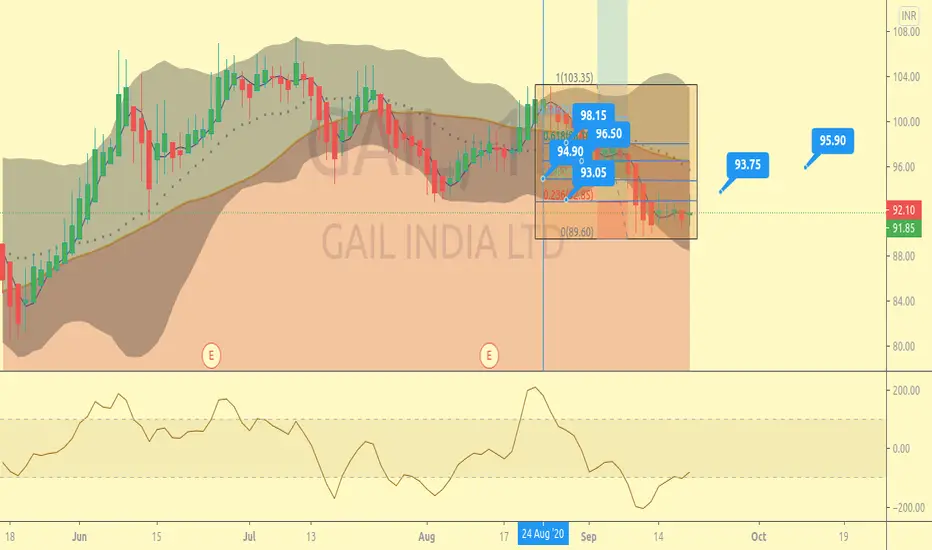
GAIL : Weekly/Daily coinciding level 84-78 cmp:96.85 10 aug GAIL :
Weekly/Daily coinciding level 84-78
cmp:96.85 10 aug 2020 Trending down breaking a weekly demand . If the entry candle is good then only i will enter this traded


